

Key Points
Question
What factors are associated with the occurrence of hyperglycemic crises (diabetic ketoacidosis and hyperglycemic hyperosmolar state) among adults with diabetes?
Findings
In this cohort study of 816 538 adults with diabetes in the US (20 156 adults with type 1 diabetes and 796 382 with type 2 diabetes), younger age, low income, Black race/ethnicity, high hemoglobin A1c level, prior hyperglycemic crises, severe hypoglycemia, depression, neuropathy, and nephropathy were associated with increased risk of hyperglycemic crises in both groups.
Meaning
The findings suggest that multidisciplinary interventions focusing on groups at high risk of hyperglycemic crises are needed to decrease the incidence and impact of these potentially preventable complications of diabetes.
Abstract
Importance
Hyperglycemic crises (ie, diabetic ketoacidosis [DKA] and hyperglycemic hyperosmolar state [HHS]) are life-threatening acute complications of diabetes. Efforts to prevent these events at the population level have been hindered by scarce granular data and difficulty in identifying individuals at highest risk.
Objective
To assess sociodemographic, clinical, and treatment-related factors associated with hyperglycemic crises in adults with type 1 or type 2 diabetes in the US from 2014 to 2020.
Design, Setting, and Participants
This retrospective cohort study analyzed administrative claims and laboratory results for adults (aged ≥18 years) with type 1 or type 2 diabetes from the OptumLabs Data Warehouse from January 1, 2014, through December 31, 2020.
Main Outcomes and Measures
Rates of emergency department or hospital visits with a primary diagnosis of DKA or HHS (adjusted for age, sex, race/ethnicity, and region, and for year when calculating annualized rates) were calculated separately for patients with type 1 diabetes and type 2 diabetes. The associations of sociodemographic factors (age, sex, race/ethnicity, region, and income), clinical factors (comorbidities), and treatment factors (glucose-lowering medications, hemoglobin A1c) with DKA or HHS in patients with type 1 or type 2 diabetes were assessed using negative binomial regression.
Results
Among 20 156 adults with type 1 diabetes (mean [SD] age, 46.6 [16.5] years; 51.2% male; 72.6% White race/ethnicity) and 796 382 with type 2 diabetes (mean [SD] age, 65.6 [11.8] years; 50.3% female; 54.4% White race/ethnicity), adjusted rates of hyperglycemic crises were 52.69 per 1000 person-years (95% CI, 48.26-57.12 per 1000 person-years) for type 1 diabetes and 4.04 per 1000 person-years (95% CI, 3.88-4.21 per 1000 person-years) for type 2 diabetes. In both groups, factors associated with the greatest hyperglycemic crisis risk were low income (≥$200 000 vs <$40 000: type 1 diabetes incidence risk ratio [IRR], 0.61 [95% CI, 0.46-0.81]; type 2 diabetes IRR, 0.69 [95% CI, 0.56-0.86]), Black race/ethnicity (vs White race/ethnicity: type 1 diabetes IRR, 1.33 [95% CI, 1.01-1.74]; type 2 diabetes IRR, 1.18 [95% CI, 1.09-1.27]), high hemoglobin A1c level (≥10% vs 6.5%-6.9%: type 1 diabetes IRR, 7.81 [95% CI, 5.78-10.54]; type 2 diabetes IRR, 7.06 [95% CI, 6.26-7.96]), history of hyperglycemic crises (type 1 diabetes IRR, 7.88 [95% CI, 6.06-9.99]; type 2 diabetes IRR, 17.51 [95% CI, 15.07-20.34]), severe hypoglycemia (type 1 diabetes IRR, 2.77 [95% CI, 2.15-3.56]; type 2 diabetes IRR, 4.18 [95% CI, 3.58-4.87]), depression (type 1 diabetes IRR, 1.62 [95% CI, 1.37-1.92]; type 2 diabetes IRR, 1.46 [95% CI, 1.34-1.59]), neuropathy (type 1 diabetes IRR, 1.64 [95% CI, 1.39-1.93]; type 2 diabetes IRR, 1.25 [95% CI, 1.17-1.34]), and nephropathy (type 1 diabetes IRR, 1.22 [95% CI, 1.01-1.48]; type 2 diabetes IRR, 1.23 [95% CI, 1.14-1.33]). Age had a U-shaped association with hyperglycemic crisis risk in patients with type 1 diabetes (compared with patients aged 18-44 years: 45-64 years IRR, 0.72 [95% CI, 0.59-0.87]; 65-74 years IRR, 0.62 [95% CI, 0.47-0.80]; ≥75 years IRR, 0.96 [95% CI, 0.66-1.38]). In type 2 diabetes, risk of hyperglycemic crises decreased progressively with age (45-64 years IRR, 0.57 [95% CI, 0.51-0.63]; 65-74 years IRR, 0.44 [95% CI, .39-0.49]; ≥75 years IRR, 0.41 [95% CI, 0.36-0.47]). In patients with type 2 diabetes, higher risk was associated with sodium-glucose cotransporter 2 inhibitor therapy (IRR, 1.30; 95% CI, 1.14-1.49) and insulin dependency (compared with regimens with bolus insulin: regimens with basal insulin only, IRR, 0.69 [95% CI, 0.63-0.75]; and without any insulin, IRR, 0.36 [95% CI, 0.33-0.40]).
Conclusions and Relevance
In this cohort study, younger age, Black race/ethnicity, low income, and poor glycemic control were associated with an increased risk of hyperglycemic crises. The findings suggest that multidisciplinary interventions focusing on groups at high risk for hyperglycemic crises are needed to prevent these dangerous events.
This cohort study uses administrative claims and laboratory results from a nationwide database to assess the sociodemographic, clinical, and treatment-related factors associated with diabetic ketoacidosis and hyperglycemic hyperosmolar states among adults with type 1 or type 2 diabetes in the US from 2014 to 2020.
Introduction
More than 1 in 8 American adults are living with diabetes.1 Diabetic ketoacidosis (DKA) and hyperglycemic hyperosmolar state (HHS)2 are life-threatening diabetes emergencies3 that are associated with substantial morbidity,4 mortality,5,6,7 high costs,8,9 and health care use.5,10 Although several studies have examined factors associated with DKA or HHS in the general population,11,12,13,14 there is limited contemporary evidence on patient-level risk factors, hindering efforts to proactively identify patients at risk and to reduce the frequency of these events at the population level.
Most published research has focused on DKA in patients with type 1 diabetes, often among children or young adults.15 The frequently cited factors associated with DKA in this context are adolescence, socioeconomic disadvantage, female sex, elevated hemoglobin A1c (HbA1c) level, prior DKA, and comorbid mental health conditions.15 A recent population-based analysis found that rates of DKA and HHS approximately doubled between 2009 and 2015,16 with higher rates among younger people and individuals residing in lower-income areas.16 However, these studies were limited by the lack of contemporary, longitudinal, patient-level data and granular information that differentiates patients by diabetes type, considers both type 1 diabetes and type 2 diabetes, and examines both DKA and HHS hyperglycemic crises. Accordingly, we examined emergency department (ED) visits and hospitalizations for hyperglycemic crises among adults with type 1 diabetes or type 2 diabetes in the US between 2014 and 2020, focusing on patient-level sociodemographic, clinical, and treatment-related factors associated with these events.
Methods
Study Design
This retrospective cohort study used medical and pharmacy claims data from OptumLabs Data Warehouse (OLDW), a deidentified claims database for privately insured and Medicare Advantage enrollees in a nationwide private US health plan.17 The OLDW database contains longitudinal health information on enrollees, representing a diverse mix of ages, races/ethnicities, and geographic regions across the US. All study data were deidentified in accordance with Health Insurance Portability and Accountability Act expert deidentification determination.18 Mayo Clinic, Rochester, Minnesota, deemed this study to be exempt from institutional review board review and no informed consent was required (or feasible) because all data were deidentified. The results are reported in accordance with the Strengthening the Reporting of Observational Studies in Epidemiology (STROBE) guideline.19
Study Population
We identified adults (age ≥18 years) with diabetes included in OLDW with available HbA1c data between January 1, 2014, and December 31, 2019 (index date), and 1 year of uninterrupted insurance coverage before that date. The diagnosis of diabetes was established using Healthcare Effectiveness Data and Information Set criteria20 and categorized as type 1 diabetes or type 2 diabetes as previously described.11,21,22
Outcomes
The primary outcome was ED visit or hospitalization with a primary or first diagnosis of DKA or HHS (eTable 1 in the Supplement) that occurred between January 1, 2014, and December 31, 2020. In a secondary analysis, DKA and HHS were considered separately; in the event that both codes were present on the same encounter, events were classified as DKA in patients with type 1 diabetes and as HHS in patients with type 2 diabetes.
Independent Variables
Patient age, sex, race/ethnicity, annual household income, and US census region of residence were identified from OLDW enrollment files at the index date. Comorbidities were ascertained from all claims during the 12 months preceding the index date as described in eTable 1 in the Supplement.
Glucose-lowering therapy was characterized based on prescriptions filled during the 120 days before the index date. For patients with type 1 diabetes, we assessed whether they had any prescriptions filled for noninsulin medication(s), prescriptions filled for insulin without noninsulin medications, or no prescriptions filled. For patients with type 2 diabetes, we first assessed whether there were any prescriptions filled, followed by whether there were prescriptions filled for bolus insulin (with or without basal insulin), prescriptions filled for basal insulin, or no prescriptions filled for insulin. Then, we identified fills for individual classes of noninsulin medications (eTable 2 in the Supplement).
Statistical Analysis
We assessed overall frequencies (percentages) and means (SDs) for baseline patient characteristics using the Mantel-Haenszel χ2 test for categorical variables and the t test for continuous variables. Crude and adjusted rates of ED visits or hospitalizations for hyperglycemic crises were calculated and presented as the total number of events per 1000 person-years among patients with type 1 diabetes or type 2 diabetes. Overall and annual adjusted rates of hyperglycemic crises were calculated using negative binomial estimates adjusted for age (during the year of the event), sex, race/ethnicity, region, and year. Adjusted rates of hyperglycemic crises for subgroups by age, sex, race/ethnicity, annual household income, and insulin use status (for type 2 diabetes only) were calculated using negative binomial estimates adjusted for age (at the index date), sex, race/ethnicity, and region. We tested for differences in the outcome by age, sex, race/ethnicity, income level, insulin use (in type 2 diabetes), and year using Wald tests.
Multivariable negative binomial regression models were also used to examine the association between hyperglycemic crises (dependent variable) and the independent variables outlined above. We evaluated hyperglycemic crises as the total number of events per each person, reporting results as incidence risk ratios (IRRs), 95% CIs, and P values. Person-years were used as an exposure to determine the estimated rates of and factors associated with hyperglycemic crises. Secondary analyses examined the outcomes of DKA and of HHS separately. Analyses were conducted using SAS Enterprise Guide, version 7.1 (SAS Institute Inc) and STATA, version 15.1 (StataCorp LLC). A 2-sided P < .05 was considered statistically significant.
Results
Study Population
The study cohort comprised 20 156 adults with type 1 diabetes (mean [SD] age, 46.6 [16.5] years; 51.2% male; 72.6% White race/ethnicity) and 796 382 adults with type 2 diabetes (mean [SD] age, 65.6 [11.8] years; 50.3% female; 54.4% White race/ethnicity) (Table 1 and Table 2). The mean (SD) durations of observation of patients in the 2 cohorts were 2.4 (1.8) years for type 1 diabetes and 2.6 (1.8) years for type 2 diabetes. Of patients with type 2 diabetes, 20.6% were treated with insulin. A higher proportion of patients with type 2 diabetes than with type 1 diabetes had an annual household income less than $40 000 (30.6% vs 14.9%). The mean (SD) HbA1c level among patients with type 1 diabetes was 8.1% (1.6%), compared with 7.4% (1.6%) among patients with type 2 diabetes (to convert to proportion of total hemoglobin, multiply by 0.01).
Table 1. Baseline Sociodemographic, Clinical, and Diabetes Treatment Characteristics of Patients With Type 1 Diabetes.
| Characteristic | Participants, No. (%)a | P value | ||
|---|---|---|---|---|
| Total (N = 20 156) | Without hyperglycemic crises (n = 18 883) | With hyperglycemic crises (n = 1273) | ||
| Sociodemographic variables | ||||
| Age, y | ||||
| Mean (SD) | 46.6 (16.5) | 46.9 (16.4) | 43.2 (18.4) | <.001 |
| 18-44 | 9325 (46.3) | 8649 (45.8) | 676 (53.1) | <.001 |
| 45-64 | 7574 (37.5) | 7175 (38.0) | 399 (31.3) | |
| 65-74 | 2367 (11.7) | 2237 (11.8) | 130 (10.2) | |
| ≥75 | 890 (4.4) | 822 (4.4) | 68 (5.3) | |
| Sex | ||||
| Female | 9846 (48.8) | 9112 (48.3) | 734 (57.7) | <.001 |
| Male | 10 310 (51.2) | 9771 (51.7) | 539 (42.3) | |
| Race/ethnicity | ||||
| White | 14 630 (72.6) | 13 756 (72.8) | 874 (68.7) | <.001 |
| Black | 1969 (9.8) | 1799 (9.5) | 170 (13.4) | |
| Hispanic | 1814 (9.0) | 1690 (9.0) | 124 (9.7) | |
| Asian | 523 (2.6) | 492 (2.6) | 31 (2.4) | |
| Other/unknownb | 1220 (6.0) | 1146 (6.1) | 74 (5.8) | |
| Annual household income, $ | ||||
| <40 000 | 2995 (14.9) | 2730 (14.5) | 265 (20.8) | <.001 |
| 40 000-74 999 | 4454 (22.1) | 4134 (21.9) | 320 (25.1) | |
| 75 000-124 999 | 5477 (27.2) | 5139 (27.2) | 338 (26.6) | |
| 125 000-199 999 | 3283 (16.3) | 3133 (16.6) | 150 (11.8) | |
| ≥200 000 | 2468 (12.2) | 2368 (12.5) | 100 (7.9) | |
| Unknown | 1479 (7.3) | 1379 (7.3) | 100 (7.9) | |
| US census region | ||||
| Midwest | 3855 (19.1) | 3581 (19.0) | 274 (21.5) | <.001 |
| Northeast | 2648 (13.1) | 2517 (13.3) | 131 (10.3) | |
| South | 9740 (48.3) | 9085 (48.1) | 655 (51.4) | |
| West/unknown | 3913 (19.4) | 3700 (19.6) | 213 (16.7) | |
| Index year | ||||
| 2014 | 5151 (25.6) | 4791 (25.4) | 360 (28.3) | <.001 |
| 2015 | 2628 (13.0) | 2448 (13.0) | 180 (14.1) | |
| 2016 | 2977 (14.8) | 2780 (14.7) | 197 (15.5) | |
| 2017 | 3036 (15.1) | 2834 (15.0) | 202 (15.9) | |
| 2018 | 2931 (14.5) | 2754 (14.6) | 177 (13.9) | |
| 2019 | 3433 (17.0) | 3276 (17.4) | 157 (12.3) | |
| Clinical variables | ||||
| Comorbidity | ||||
| Hyperglycemic crisis | 862 (4.3) | 545 (2.9) | 317 (24.9) | <.001 |
| Severe hypoglycemia | 623 (3.1) | 506 (2.7) | 117 (9.2) | <.001 |
| Retinopathy | 5888 (29.2) | 5522 (29.2) | 366 (28.8) | .71 |
| Neuropathy | 5104 (25.3) | 4625 (24.5) | 479 (37.6) | <.001 |
| Nephropathy | 2956 (14.7) | 2671 (14.1) | 285 (22.4) | <.001 |
| Cardiovascular disease | 2920 (14.5) | 2679 (14.2) | 241 (18.9) | <.001 |
| Cerebrovascular disease | 1038 (5.2) | 928 (4.9) | 110 (8.6) | <.001 |
| Peripheral vascular disease | 1837 (9.1) | 1680 (8.9) | 157 (12.3) | <.001 |
| Heart failure | 692 (3.4) | 616 (3.3) | 76 (6.0) | <.001 |
| Dementia | 173 (0.9) | 152 (0.8) | 21 (1.6) | .002 |
| Hypertension | 9336 (46.3) | 8725 (46.2) | 611 (48.0) | .21 |
| Depression | 2549 (12.6) | 2252 (11.9) | 297 (23.3) | <.001 |
| COPD | 1157 (5.7) | 1054 (5.6) | 103 (8.1) | <.001 |
| Cancer | 832 (4.1) | 776 (4.1) | 56 (4.4) | .62 |
| Cirrhosis | 85 (0.4) | ≥74 (0.4)c | <11c | .47 |
| Treatment variables | ||||
| Hemoglobin A1c level, % | ||||
| Mean (SD) | 8.1 (1.6) | 8.0 (1.5) | 9.4 (2.0) | <.001 |
| ≤5.6 | 354 (1.8) | ≥343 (1.8)c | <11c | <.001 |
| 5.7-6.4 | 1859 (9.2) | 1822 (9.6) | 37 (2.9) | |
| 6.5-6.9 | 2444 (12.1) | 2378 (12.6) | 66 (5.2) | |
| 7.0-7.9 | 6359 (31.6) | 6116 (32.4) | 243 (19.1) | |
| 8.0-8.9 | 4493 (22.3) | 4245 (22.5) | 248 (19.5) | |
| 9.0-9.9 | 2387 (11.8) | 2164 (11.5) | 223 (17.5) | |
| ≥10 | 2260 (11.2) | 1811 (9.6) | 449 (35.3) | |
| Prescription fills for glucose-lowering medication in the 120 d before the index date | ||||
| Insulin only | 16 805 (83.4) | 15 724 (83.3) | 1081 (84.9) | <.001 |
| Any noninsulin medication | 1829 (9.1) | 1749 (9.3) | 80 (6.3) | |
| None | 1522 (7.6) | 1410 (7.5) | 112 (8.8) | |
Abbreviation: COPD, chronic obstructive pulmonary disease.
SI conversion factor: To convert hemoglobin A1c to proportion of total hemoglobin, multiply by 0.01.
Data are overall (total) and by whether patients experienced diabetic ketoacidosis or hyperglycemic hyperosmolar state during the follow-up period.
Other is a racial/ethnicity choice in the OptumLabs Data Warehouse database.
Patient counts less than 11 are masked to preserve deidentification. Thus, all numbers lower than 11 are reported as less than 11 and numbers within the same row are presented with less precision to prevent back-calculations of the masked sample.
Table 2. Baseline Sociodemographic, Clinical, and Diabetes Treatment Characteristics of Patients With Type 2 Diabetes.
| Characteristic | Participants, No. (%)a | P value | ||
|---|---|---|---|---|
| Total (N = 796 382) | Without hyperglycemic crises (n = 790 587) | With hyperglycemic crises (n = 5795) | ||
| Sociodemographic variables | ||||
| Age, y | ||||
| Mean (SD) | 65.6 (11.8) | 65.7 (11.8) | 62.0 (13.7) | <.001 |
| 18-44 | 42 356 (5.3) | 41 717 (5.3) | 639 (11.0) | <.001 |
| 45-64 | 281 738 (35.4) | 279 406 (35.3) | 2332 (40.2) | |
| 65-74 | 286 441 (36.0) | 284 676 (36.0) | 1765 (30.5) | |
| ≥75 | 185 847 (23.3) | 184 788 (23.4) | 1059 (18.3) | |
| Sex | ||||
| Female | 400 346 (50.3) | 397 272 (50.2) | 3074 (53.0) | <.001 |
| Male | 396 036 (49.7) | 393 315 (49.8) | 2721 (47.0) | |
| Race/ethnicity | ||||
| White | 433 623 (54.4) | 430 499 (54.4) | 3124 (53.9) | <.001 |
| Black | 141 999 (17.8) | 140 476 (17.8) | 1523 (26.3) | |
| Hispanic | 133 664 (16.8) | 132 901 (16.8) | 763 (13.2) | |
| Asian | 40 971 (5.1) | 40 836 (5.2) | 135 (2.3) | |
| Other/unknownb | 46 125 (5.8) | 45 875 (5.8) | 250 (4.3) | |
| Annual household income, $ | ||||
| <40 000 | 243 621 (30.6) | 241 339 (30.5) | 2282 (39.4) | <.001 |
| 40 000-74 999 | 222 612 (28.0) | 220 975 (28.0) | 1637 (28.2) | |
| 75 000-124 999 | 171 737 (21.6) | 170 747 (21.6) | 990 (17.1) | |
| 125 000-199 999 | 64 332 (8.1) | 64 057 (8.1) | 275 (4.8) | |
| ≥200 000 | 28 576 (3.6) | 28 449 (3.6) | 127 (2.2) | |
| Unknown | 65 504 (8.2) | 65 020 (8.2) | 484 (8.4) | |
| US census region | ||||
| Midwest | 144 126 (18.1) | 143 046 (18.1) | 1080 (18.6) | <.001 |
| Northeast | 120 946 (15.2) | 120 193 (15.2) | 753 (13.0) | |
| South | 446 286 (56.0) | 442 879 (56.0) | 3407 (58.8) | |
| West/unknown | 85 024 (10.7) | 84 469 (10.7) | 555 (9.6) | |
| Index year | ||||
| 2014 | 152 519 (19.2) | 151 000 (19.1) | 1159 (26.2) | <.001 |
| 2015 | 117 351 (14.7) | 116 318 (14.7) | 1033 (17.8) | |
| 2016 | 104 538 (13.1) | 103 777 (13.1) | 761 (13.1) | |
| 2017 | 137 597 (17.3) | 136 555 (17.3) | 1042 (18.0) | |
| 2018 | 142 231 (17.9) | 141 433 (17.9) | 798 (13.8) | |
| 2019 | 142 146 (17.8) | 141 504 (17.9) | 642 (11.1) | |
| Clinical variables | ||||
| Comorbidity | ||||
| Hyperglycemic crisis | 2646 (0.3) | 2063 (0.3) | 583 (10.1) | <.001 |
| Severe hypoglycemia | 6727 (0.8) | 6342 (0.8) | 385 (6.6) | <.001 |
| Retinopathy | 123 148 (15.5) | 121 733 (15.4) | 1415 (24.4) | <.001 |
| Neuropathy | 218 245 (27.4) | 215 790 (27.3) | 2455 (42.4) | <.001 |
| Nephropathy | 186 900 (23.5) | 184 944 (23.4) | 1956 (33.8) | <.001 |
| Cardiovascular disease | 259 985 (32.6) | 257 875 (32.6) | 2110 (36.4) | <.001 |
| Cerebrovascular disease | 92 517 (11.6) | 91 584 (11.6) | 933 (16.1) | <.001 |
| Peripheral vascular disease | 132 101 (16.6) | 130 770 (16.5) | 1331 (23.0) | <.001 |
| Heart failure | 85 846 (10.8) | 84 889 (10.7) | 957 (16.5) | <.001 |
| Dementia | 24 052 (3.0) | 23 788 (3.0) | 264 (4.6) | <.001 |
| Hypertension | 686 124 (86.2) | 681 196 (86.2) | 4928 (85.0) | .01 |
| Depression | 99 487 (12.5) | 98 313 (12.4) | 1174 (20.3) | <.001 |
| COPD | 114 033 (14.3) | 112 987 (14.3) | 1046 (18.0) | <.001 |
| Cancer | 71 797 (9.0) | 71 287 (9.0) | 510 (8.80) | .57 |
| Cirrhosis | 8952 (1.1) | 8834 (1.1) | 118 (2.0) | <.001 |
| Treatment variables | ||||
| Hemoglobin A1c level, % | ||||
| Mean (SD) | 7.4 (1.6) | 7.3 (1.6) | 9.3 (2.4) | <.001 |
| ≤5.6 | 46 822 (5.9) | 46 736 (5.9) | 86 (1.5) | <.001 |
| 5.7-6.4 | 217 748 (27.3) | 217 308 (27.5) | 440 (7.6) | |
| 6.5-6.9 | 144 631 (18.2) | 144 177 (18.2) | 454 (7.8) | |
| 7.0-7.9 | 182 928 (23.0) | 181 943 (23.0) | 985 (17.0) | |
| 8.0-8.9 | 90 804 (11.4) | 89 817 (11.4) | 987 (19.5) | |
| 9.0-9.9 | 49 029 (6.2) | 48 185 (6.1) | 844 (14.6) | |
| ≥10 | 64 420 (8.1) | 62 421 (7.9) | 1999 (34.5) | |
| Prescription fills for glucose-lowering medication in the 120 d before the index date | ||||
| None | 184 079 (23.1) | 183 138 (23.2) | 941 (16.2) | <.001 |
| Insulin | ||||
| Not treated with insulin | 632 323 (79.4) | 629 706 (79.6) | 2617 (45.2) | <.001 |
| Basal only, no bolus | 89 977 (11.3) | 88 724 (11.2) | 1253 (21.6) | |
| Bolus, with or without basal | 74 082 (9.3) | 72 157 (9.1) | 1925 (33.2) | |
| Noninsulin glucose-lowering medication | ||||
| Sulfonylurea | 203 122 (25.5) | 201 852 (25.5) | 201 852 (25.5) | <.001 |
| Metformin | 429 036 (53.9) | 426 884 (54.0) | 2152 (37.1) | <.001 |
| SGLT2 inhibitor | 40 247 (5.0) | 39 933 (5.0) | 314 (5.4) | .20 |
| GLP-1 receptor agonist | 45 950 (5.8) | 45 632 (5.8) | 318 (5.5) | .35 |
| DPP-4 inhibitor | 96 962 (12.2) | 96 377 (12.2) | 585 (10.1) | <.001 |
| Thiazolidinedione | 38 668 (4.9) | 38 439 (4.9) | 229 (4.0) | .001 |
| Other | 7685 (1.0) | 7629 (1.0) | 56 (1.0) | .99 |
Abbreviations: COPD, chronic obstructive pulmonary disease; DPP-4, dipeptidyl peptidase 4; GLP-1, glucagon-like peptide 1; SGLT2, sodium-glucose cotransporter 2.
SI conversion factor: To convert hemoglobin A1c to proportion of total hemoglobin, multiply by 0.01.
Data are overall (total) and by whether patients experienced at least 1 hyperglycemic crisis during the follow-up period.
Other is a racial/ethnicity choice in the OptumLabs Data Warehouse database.
A total of 1273 patients with type 1 diabetes (6.3%) experienced 2397 episodes of hyperglycemic crises. A total of 2364 events (98.6%) were DKA, with only 33 episodes (1.4%) coded as HHS; thus, no secondary analysis by event type was conducted. The mean (SD) number of hyperglycemic crises among patients with at least 1 event was 1.9 (2.2). Compared with those who did not experience hyperglycemic crises, patients who did were more frequently young (mean [SD] age, 43.2 [18.4] vs 46.9 [16.4] years), Black (170 [13.4%] vs 1799 [9.5%]) or Hispanic (124 [9.7%] vs 1690 [9.0%]) individuals, and female (734 [57.7%] vs 9112 [48.3%]) and had lower income levels (<$40,000: 265 [20.8%] vs 2730 [14.5%]) and higher HbA1c levels (mean [SD], 9.4% [2.0%] vs 8.0% [1.5%]) (Table 1).
Among patients with type 2 diabetes, 5795 patients (0.7%) experienced 8005 hyperglycemic crises. The mean (SD) number of hyperglycemic crises among patients with at least 1 event was 1.4 (1.6). Compared with patients who did not experience hyperglycemic crises, patients who did were younger (mean [SD] age, 62.0 [13.7] vs 65.7 [11.8] years) and more likely to be Black individuals (1523 [26.3%] vs 140 476 [17.8%]) and had lower income levels (<$40 000: 2282 [39.4%] vs 241 339 [30.5%]) and higher HbA1c levels (mean [SD], 9.3% [1.5%] vs 7.3% [1.6%]) (Table 2). When DKA and HHS outcomes were examined separately, 4264 patients (0.5%) experienced only DKA, 1329 (0.2%) experienced only HHS, and 202 (0.02%) experienced both types of events during the study period (eTable 3 in the Supplement). The group who experienced both HHS and DKA was analyzed together with the group with only DKA to ensure that patient deidentification was maintained because the characteristics of the 2 groups were similar. Compared with patients who experienced DKA, patients with HHS were older, were more likely to be Black individuals, had lower income levels, were less likely to have had a prior DKA or HHS event, and had higher prevalence of all comorbidities.
Incidence Rates of Hyperglycemic Crises
Adjusted overall rates of hyperglycemic crises were 52.69 events per 1000 person-years (95% CI, 48.26-57.12 events per 1000 person-years) among people with type 1 diabetes and 4.04 events per 1000 person-years (95% CI, 3.88-4.21 events per 1000 person-years) among people with type 2 diabetes. Event rates increased between 2014 and 2019 among patients with type 1 diabetes, from 43.30 events (95% CI, 33.37-53.24 events) to 61.36 events (95% CI, 52.90-69.82 events) but then decreased to 46.27 events (95% CI, 38.59-53.95 events) in 2020 (P = .01) (Figure 1 and Figure 2 and eTable 4 in the Supplement). In contrast, event rates among patients with type 2 diabetes remained stable throughout the study period. For both patients with type 1 diabetes and those with type 2 diabetes, rates of hyperglycemic crises were highest among younger patients, Black patients, patients with lower income, women, and (for type 2 diabetes) patients requiring insulin therapy (Figure 1 and Figure 2 and eTable 5 and eTable 6 in the Supplement). Indeed, among patients with type 2 diabetes treated with bolus insulin, with or without basal insulin, the adjusted rate of DKA or HHS was 17.73 events per 1000 person-years. Patients with type 1 diabetes whose annual household income was less than $40 000 experienced hyperglycemic crises at the adjusted rate of 101.52 events per 1000 person-years, compared with 26.25 events per 1000 person-years among patients with an income of $200 000 or higher. Similarly, for patients with type 2 diabetes, adjusted rates of hyperglycemic crises were 5.78 events per 1000 person-years for individuals with low income and 2.23 events per 1000 person-years for individuals with high income. Tests of differences by age, sex, racial/ethnic groups, and (for type 2 diabetes) insulin use found significant heterogeneity across all (P ≤ .01 for all).
Figure 1. Adjusted Rates of Hyperglycemic Crises Among Adults With Type 1 Diabetes Stratified by Age, Sex, Race/Ethnicity, Annual Household Income, and Year.

All rates are adjusted for age (age at index for all analyses except for annual rates, which used age at the time of the event), sex, race/ethnicity, US region, and year (for annualized rates). For age, P < .001; sex, P < .001; race/ethnicity, P = .002; annual household income, P < .001; and year, P = .01.
Figure 2. Adjusted Rates of Hyperglycemic Crises Among Adults With Type 2 Diabetes Stratified by Age, Sex, Race/Ethnicity, Annual Household Income, Insulin Therapy, and Year.
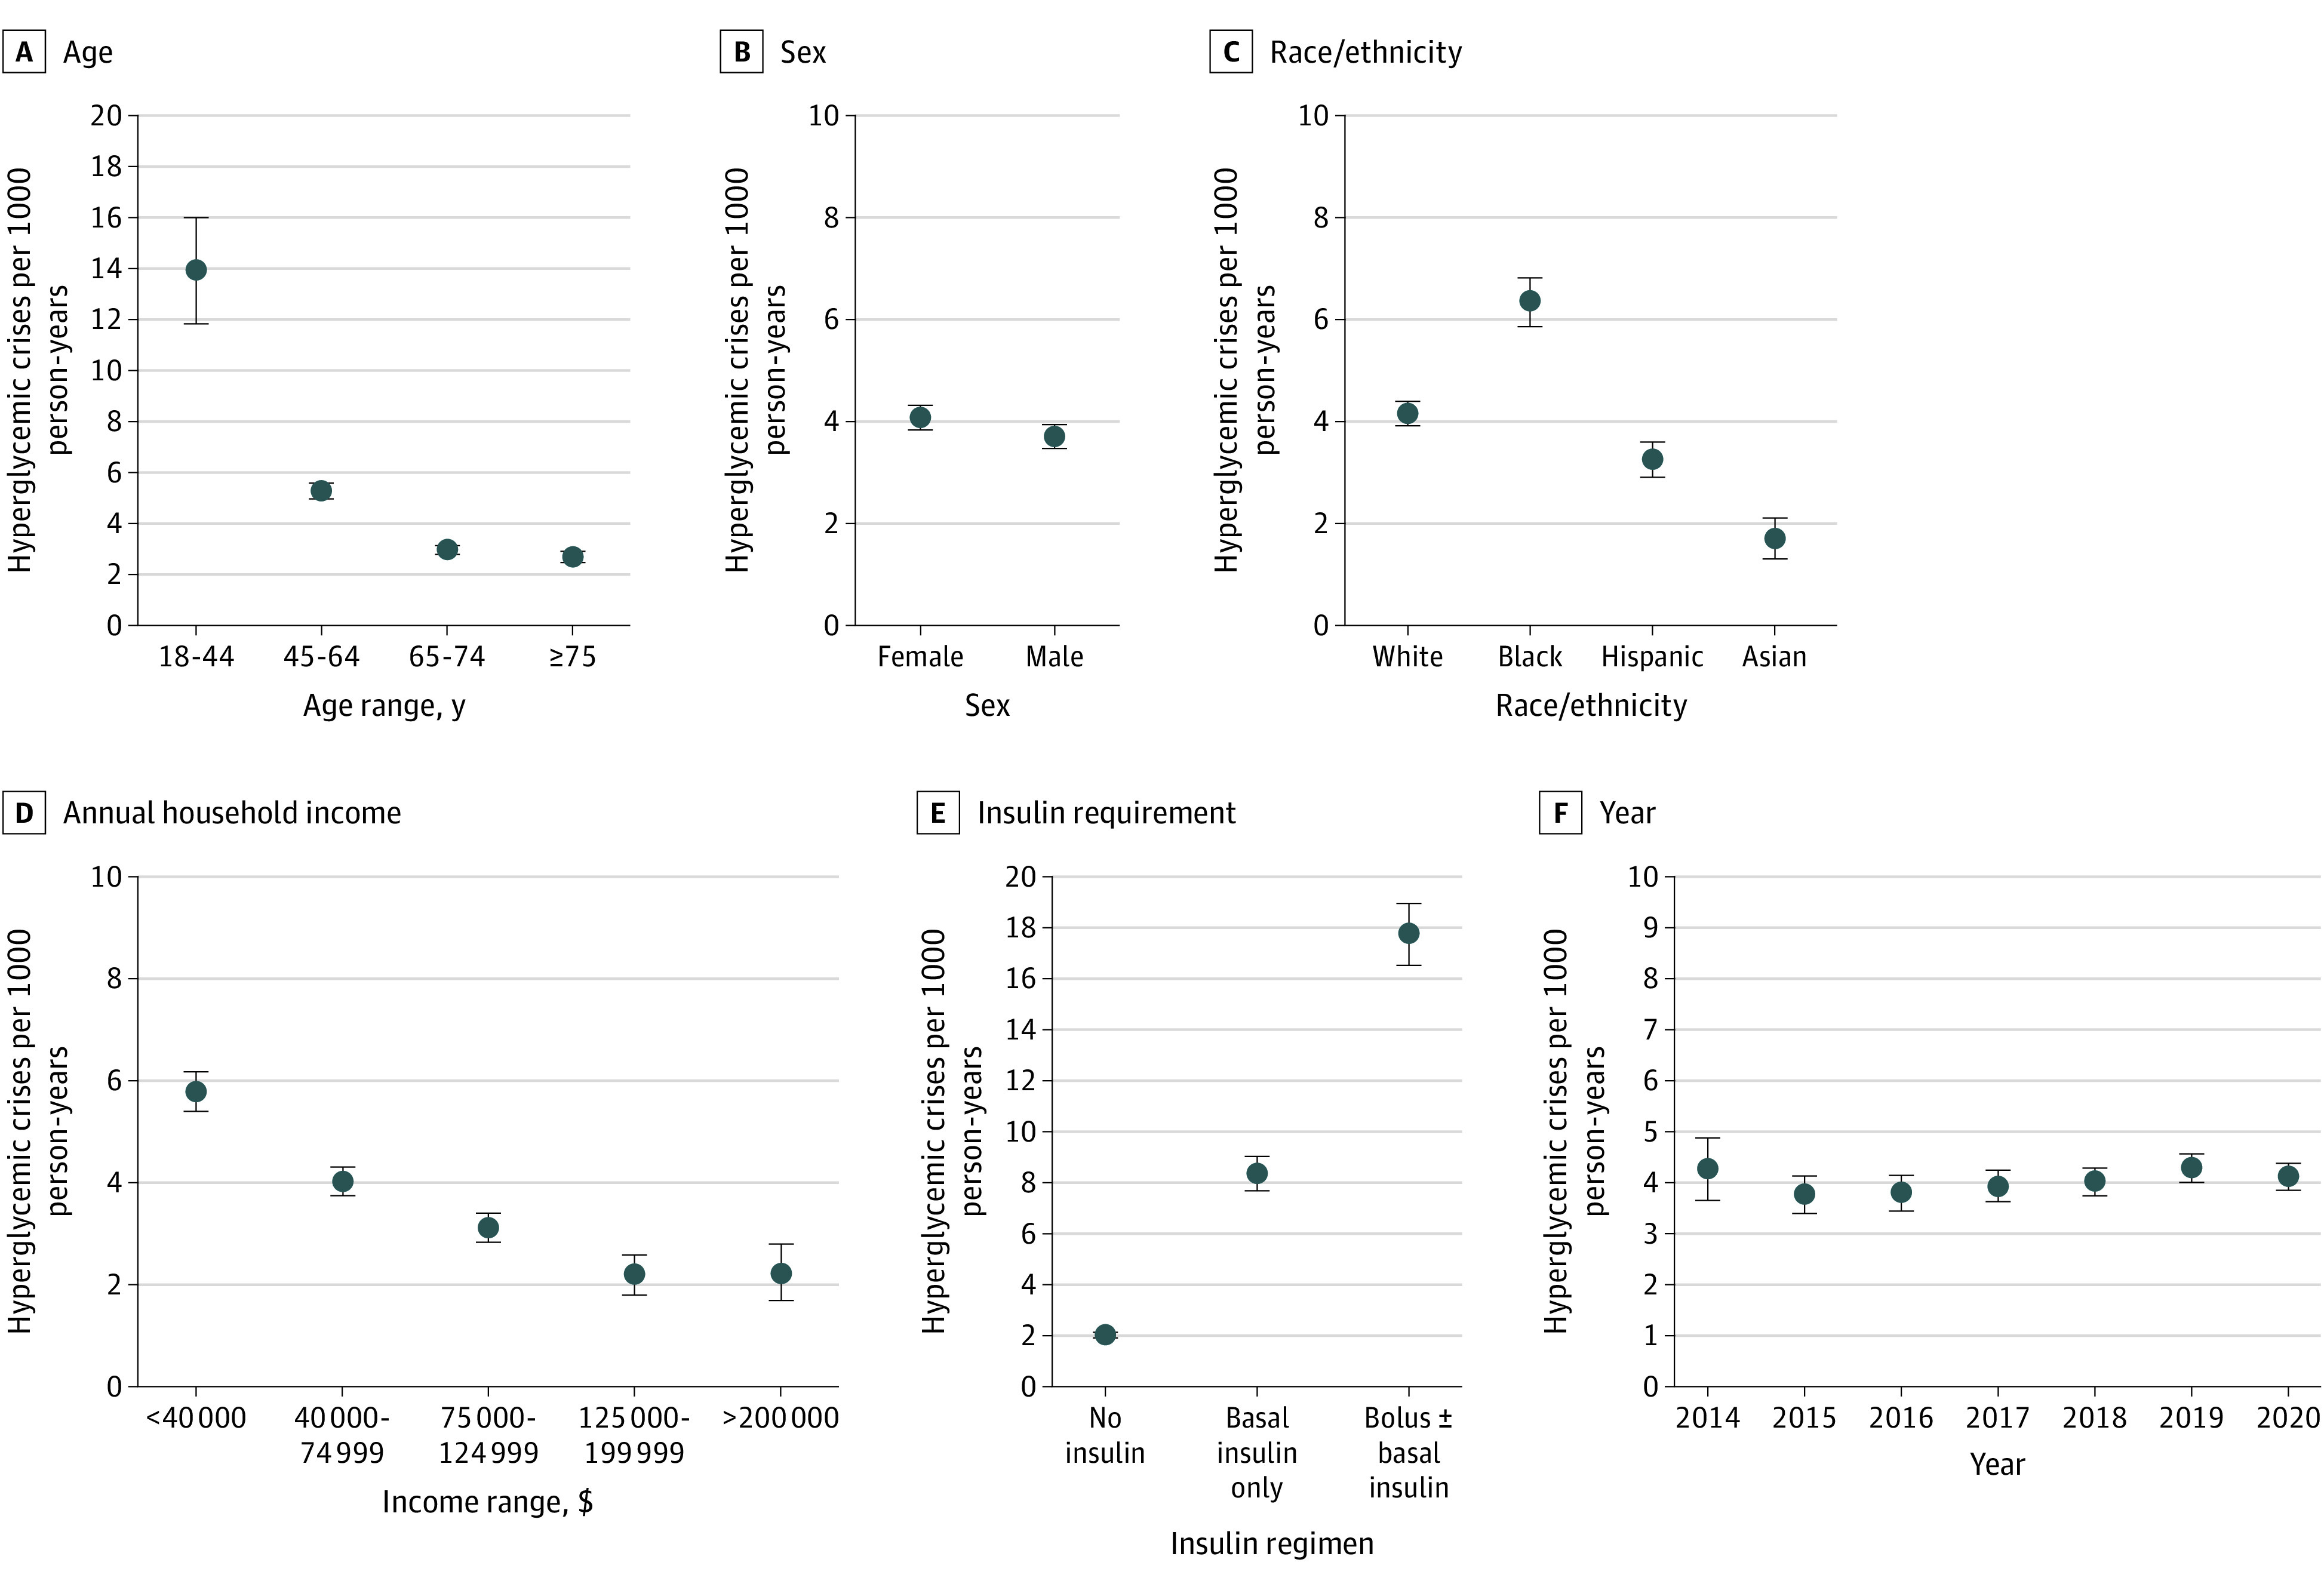
All rates are adjusted for age (age at index for all analyses except for annual rates, which used age at the time of the event), sex, race/ethnicity, US region, and year (for annualized rates). For age, P < .001; sex, P < .001; race/ethnicity, P < .001; annual household income, P < .001; insulin requirement, P < .001; and year, P = .16.
Factors Associated With Hyperglycemic Crises
For patients with type 1 diabetes and with type 2 diabetes, factors associated with increased risk of hyperglycemic crises were Black race/ethnicity (vs White race/ethnicity: type 1 diabetes incidence risk ratio [IRR], 1.33 [95% CI, 1.01-1.74]; type 2 diabetes IRR, 1.18 [95% CI, 1.09-1.27]) and lower annual household income (≥$200 000 vs <$40 000: type 1 diabetes IRR, 0.61 [95% CI, 0.46-0.81]; type 2 diabetes IRR, 0.69 [95% CI, 0.56-0.86]) (Table 3). Age had a U-shaped association with hyperglycemic crisis risk in patients with type 1 diabetes (compared with patients aged 18-44 years: 45-64 years IRR, 0.72 [95% CI, 0.59-0.87]; 65-74 years IRR, 0.62 [95% CI, 0.47-0.80]; ≥75 years IRR, 0.96 [95% CI, 0.66-1.38]). In type 2 diabetes, risk of hyperglycemic crises decreased progressively with age (45-64 years IRR, 0.57 [95% CI, 0.51-0.63]; 65-74 years IRR, 0.44 [95% CI, .39-0.49]; ≥75 years IRR, 0.41 [95% CI, 0.36-0.47]). In a secondary analysis that considered DKA and HHS separately for patients with type 2 diabetes, age was significantly associated with DKA (≥75 vs 18-44 years: IRR, 0.35; 95% CI, 0.30-0.41) but not with HHS (eTable 7 in the Supplement). Differences by sex were significant only for patients with type 1 diabetes, with men having lower risk than women (IRR, 0.75; 95% CI, 0.65-0.87). Among patients with type 1 diabetes, risk of hyperglycemic crises increased progressively in association with HbA1c levels above 7.0%; at HbA1c levels of 10% or higher, the risk was nearly 8-fold higher than at HbA1c levels from 6.5% to 6.9% (IRR, 7.81; 95% CI, 5.78-10.54). Among patients with type 2 diabetes, risk of hyperglycemic crises increased progressively in association with all HbA1c levels, with an IRR of 0.56 (95% CI, 0.43-0.73) at HbA1c levels of 5.6% or lower and an IRR of 7.06 (95% CI, 6.26-7.96) at HbA1c levels of 10% or higher compared with HbA1c levels from 6.5% to 6.9%. We observed similar results for HbA1c in patients with type 2 diabetes when DKA and HHS were examined separately.
Table 3. Factors Associated With Hyperglycemic Crises Among Adults With Type 1 or Type 2 Diabetes, 2014-2020.
| Factor | Type 1 diabetes | Type 2 diabetes | ||
|---|---|---|---|---|
| IRR (95% CI) | P value | IRR (95% CI) | P value | |
| Age, y | ||||
| 18-44 | 1 [Reference] | NA | 1 [Reference] | NA |
| 45-64 | 0.72 (0.59-0.87) | .001 | 0.57 (0.51-0.63) | <.001 |
| 65-74 | 0.62 (0.47-0.80) | <.001 | 0.44 (0.39-0.49) | <.001 |
| ≥75 | 0.96 (0.66-1.38) | .82 | 0.41 (0.36-0.47) | <.001 |
| Sex | ||||
| Female | 1 [Reference] | NA | 1 [Reference] | NA |
| Male | 0.75 (0.65-0.87) | <.001 | 1.00 (0.94-1.07) | .94 |
| Race/ethnicity | ||||
| White | 1 [Reference] | NA | 1 [Reference] | NA |
| Black | 1.33 (1.01-1.74) | .04 | 1.18 (1.09-1.27) | <.001 |
| Hispanic | 0.88 (0.70-1.11) | .28 | 0.69 (0.62-0.75) | <.001 |
| Asian | 1.15 (0.73-1.80) | .55 | 0.64 (0.51-0.80) | <.001 |
| Other/unknowna | 1.07 (0.79-1.44) | .68 | 0.87 (0.73-1.03) | .10 |
| US census region | ||||
| Midwest | 1 [Reference] | NA | 1 [Reference] | NA |
| Northeast | 0.71 (0.56-0.90) | .004 | 0.92 (0.82-1.03) | .14 |
| South | 0.94 (0.78-1.12) | .47 | 1.01 (0.93-1.09) | .90 |
| West/unknown | 0.99 (0.78-1.25) | .90 | 1.00 (0.88-1.13) | .94 |
| Annual household income, $ | ||||
| <40 000 | 1 [Reference] | NA | 1 [Reference] | NA |
| 40 000-74 999 | 0.85 (0.68-1.06) | .15 | 0.84 (0.78-0.91) | <.001 |
| 75 000-124 999 | 0.92 (0.73-1.17) | .51 | 0.73 (0.66-0.80) | <.001 |
| 125 000-199 999 | 0.71 (0.54-0.92) | .009 | 0.57 (0.49-0.66) | <.001 |
| ≥200 000 | 0.61 (0.46-0.81) | .001 | 0.69 (0.56-0.86) | .001 |
| Unknown | 0.98 (0.72-1.35) | .91 | 1.01 (0.88-1.16) | .87 |
| Index year | ||||
| 2014 | 1 [Reference] | NA | 1 [Reference] | NA |
| 2015 | 0.86 (0.69-1.07) | .18 | 0.92 (0.84-1.01) | .09 |
| 2016 | 1.22 (0.94-1.59) | .13 | 0.93 (0.83-1.03) | .16 |
| 2017 | 1.08 (0.86-1.37) | .50 | 0.98 (0.89-1.08) | .66 |
| 2018 | 1.05 (0.85-1.31) | .66 | 0.99 (0.89-1.09) | .81 |
| 2019 | 1.04 (0.82-1.31) | .76 | 1.04 (0.93-1.17) | .49 |
| Comorbidity | ||||
| Hyperglycemic crisis | 7.88 (6.06-9.99) | <.001 | 17.51 (15.07-20.34) | <.001 |
| Severe hypoglycemia | 2.77 (2.15-3.56) | <.001 | 4.18 (3.58-4.87) | <.001 |
| Retinopathy | 0.92 (0.79-1.08) | .31 | 1.27 (1.18-1.38) | <.001 |
| Nephropathy | 1.22 (1.01-1.48) | .04 | 1.23 (1.14-1.33) | <.001 |
| Neuropathy | 1.64 (1.39-1.93) | <.001 | 1.25 (1.17-1.34) | <.001 |
| Cardiovascular disease | 1.22 (0.97-1.53) | .09 | 0.93 (0.87-1.01) | .08 |
| Cerebrovascular disease | 1.04 (0.81-1.34) | .77 | 1.18 (1.07-1.30) | .001 |
| Peripheral vascular disease | 1.18 (0.92-1.51) | .20 | 1.09 (1.00-1.18) | .05 |
| Heart failure | 0.88 (0.64-1.22) | .45 | 1.14 (1.03-1.25) | .01 |
| Dementia | 1.50 (0.89-2.52) | .13 | 1.49 (1.27-1.75) | <.001 |
| Hypertension | 0.93 (0.79-1.10) | .39 | 0.83 (0.76-0.91) | <.001 |
| Depression | 1.62 (1.37-1.92) | <.001 | 1.46 (1.34-1.59) | <.001 |
| COPD | 1.03 (0.79-1.34) | .85 | 1.11 (1.02-1.21) | .02 |
| Cancer | 1.09 (0.77-1.53) | .63 | 1.15 (1.03-1.28) | .01 |
| Cirrhosis | 1.09 (0.51-2.37) | .82 | 1.72 (1.36-2.18) | <.001 |
| Hemoglobin A1c, % | ||||
| ≤5.6 | 0.56 (0.27-1.14) | .11 | 0.56 (0.43-0.73) | <.001 |
| 5.7-6.4 | 0.99 (0.58-1.68) | .96 | 0.67 (0.58-0.77) | <.001 |
| 6.5-6.9 | 1 [Reference] | NA | 1 [Reference] | NA |
| 7.0-7.9 | 1.63 (1.20-2.22) | .002 | 1.48 (1.31-1.67) | <.001 |
| 8.0-8.9 | 2.11 (1.55-2.86) | <.001 | 2.61 (2.30-2.96) | <.001 |
| 9.0-9.9 | 3.57 (2.61-4.89) | <.001 | 3.72 (3.25-4.27) | <.001 |
| ≥10 | 7.81 (5.78-10.54) | <.001 | 7.06 (6.26-7.96) | <.001 |
| Type 1 diabetes management | ||||
| Insulin only | 1 [Reference] | NA | NA | NA |
| No medications | 1.05 (0.80-1.38) | .72 | NA | NA |
| Any noninsulin medication | 0.65 (0.49-0.87) | .003 | NA | NA |
| Type 2 diabetes management | ||||
| No medications | NA | NA | 1.10 (0.98-1.23) | .09 |
| Insulin use | ||||
| Bolus with or without basal | NA | NA | 1 [Reference] | NA |
| Basal only | NA | NA | 0.69 (0.63-0.75) | <.001 |
| Not treated with insulin | NA | NA | 0.36 (0.33-0.40) | <.001 |
| Noninsulin medication | ||||
| Metformin | NA | NA | 0.72 (0.67-0.78) | <.001 |
| Sulfonylurea | NA | NA | 0.90 (0.84-0.98) | .01 |
| SGLT2 inhibitor | NA | NA | 1.30 (1.14-1.49) | <.001 |
| GLP-1 receptor agonist | NA | NA | 0.77 (0.67-0.87) | <.001 |
| DPP-4 inhibitor | NA | NA | 0.87 (0.79-0.96) | .006 |
| Thiazolidinedione | NA | NA | 1.12 (0.96-1.31) | .15 |
| Other | NA | NA | 0.86 (0.64-1.15) | .30 |
Abbreviations: COPD, chronic obstructive pulmonary disease; DPP-4, dipeptidyl peptidase 4; GLP-1, glucagon-like peptide 1; IRR, incidence risk ratio; NA, not applicable; SGLT2, sodium-glucose cotransporter 2.
SI conversion factor: To convert hemoglobin A1c to proportion of total hemoglobin, multiply by 0.01.
Other is a racial/ethnicity choice in the OptumLabs Data Warehouse database.
Patients who experienced hyperglycemic crises or severe hypoglycemia in the previous year were significantly more likely to experience recurrent DKA or HHS (Table 3). Among patients with type 1 diabetes, both prior hyperglycemic crises (IRR, 7.88; 95% CI, 6.06-9.99) and prior severe hypoglycemia (IRR, 2.77; 95% CI, 2.15-3.56) were associated with increased risk of experiencing hyperglycemic crises. Similarly, among patients with type 2 diabetes, prior hyperglycemic crises (IRR, 17.51; 95% CI, 15.07-20.34) and prior severe hypoglycemia (IRR, 4.18; 95% CI, 3.58-4.87) were associated with increased risk of hyperglycemic crises. When DKA and HHS were examined separately, history of hyperglycemic crises had a greater association with DKA (IRR, 20.32; 95% CI, 17.31-23.86) than HHS (IRR, 7.18; 95% CI, 5.68-9.06) (eTable 7 in the Supplement).
Compared with patients without the following health conditions, patients with depression (type 1 diabetes IRR, 1.62 [95% CI, 1.37-1.92]; type 2 diabetes IRR, 1.46 [95% CI, 1.34-1.59]), neuropathy (type 1 diabetes IRR, 1.64 [95% CI, 1.39-1.93]; type 2 diabetes IRR, 1.25 [95% CI, 1.17-1.34]), and nephropathy (type 1 diabetes IRR, 1.22 [95% CI, 1.01-1.48]; type 2 diabetes IRR, 1.23 [95% CI, 1.14-1.33]) had an increased risk of hyperglycemic crises (Table 3). For type 2 diabetes, additional risk was associated with the presence of retinopathy, cerebrovascular disease, heart failure, dementia, chronic obstructive pulmonary disease, cirrhosis, or cancer.
Patients with type 2 diabetes who required basal insulin therapy (IRR, 0.69; 95% CI, 0.63-0.75) or no insulin therapy (IRR, 0.36; 95% CI, 0.33-0.40) had a lower risk of hyperglycemic crises compared with those treated with bolus, with or without basal, insulin therapy. Patients treated with sodium-glucose cotransporter 2 inhibitors (IRR, 1.30; 95% CI, 1.14-1.49) had an increased risk of hyperglycemic crises compared with patients not treated with these medications (Table 3). Therapy with a sodium-glucose cotransporter 2 inhibitor was specifically associated with an increased risk of DKA (IRR, 1.47; 95% CI, 1.27-1.70) but with a decreased risk of HHS (IRR, 0.65; 95% CI, 0.46-0.93) (eTable 7 in the Supplement).
Discussion
In this nationwide cohort study of insured adults with diabetes, adjusted rates of hyperglycemic crises were 52.69 events per 1000 person-years among people with type 1 diabetes, 4.04 events per 1000 person-years among people with type 2 diabetes, and 17.73 events per 1000 person-years among people with type 2 diabetes requiring intensive insulin therapy. In both patients with type 1 diabetes and those with type 2 diabetes, rates of hyperglycemic crises were significantly higher among younger adults, Black patients, individuals with lower income, patients with elevated HbA1c levels, and patients with prior hyperglycemic crises or severe hypoglycemia, suggesting the need for timely patient identification, engagement, and treatment optimization to improve glycemic control and prevent these dangerous events.
We found that the rates of hyperglycemic crises increased over time among patients with type 1 diabetes, from 43.30 per 1000 person-years in 2014 to 61.36 per 1000 person-years in 2019, consistent with previously described trends through 201516 and recent population-level data showing an overall worsening of glycemic control among patients with diabetes in the US.23,24 There was no comparable temporal change in hyperglycemic crises rates among patients with type 2 diabetes. This persistent rise in rates of hyperglycemic crises among patients with type 1 diabetes underscores the urgency of improving glycemic control and diabetes management in this population. Why ED visits and hospitalizations for hyperglycemic crises among patients with type 1 diabetes declined in 2020 in the context of the COVID-19 pandemic is unknown. Although there may have been a delay in adjudication of claims, with not all 2020 claims finalized at the time of our final analysis (June 2021), this delay alone likely did not account for the observed decrease in hyperglycemic crises–associated ED visits or hospitalizations to 46.27 per 1000 person-years in 2020 (particularly as a similar decrease was not observed for patients with type 2 diabetes). Patients may have sought to avoid the ED or hospital to minimize COVID-19 exposure or because EDs and hospitals were overwhelmed by caring for patients with COVID-19. Alternatively, patients may have observed improvements in diabetes management in the context of evolving policy changes regarding insulin access and affordability. Further exploration will be needed to examine diabetes management in 2020, particularly among patients with type 1 diabetes, and to assess for changes in insulin use and adherence, glycemic control, and diabetes-related mortality.
In the present study, incidence and risk of hyperglycemic crises was disproportionately higher for patients with lower income, a finding supporting the need for policies and systems to ensure improved access to affordable glucose-lowering therapies.25,26 Building on earlier work in different populations,27,28 we found that for individuals with type 1 diabetes, the adjusted rate of hyperglycemic crises was 101.52 events per 1000 person-years among patients with low income (<$40 000) compared with 26.25 events per 1000 person-years among patients with high income (≥$200 000). Income-based disparities in hyperglycemic crisis risk were also detected among patients with type 2 diabetes: 5.78 vs 2.23 per 1000 person-years, respectively. The association of an inability to afford insulin with increased risk of DKA has been observed for decades.29 Increasing costs of insulin26,30,31 are associated with an increased prevalence of undertreatment of patients with lower incomes32 and insulin rationing,33 which may lead to severe and uncontrolled hyperglycemia as a result of inadequate access to the medication that all patients with type 1 diabetes and some with insulin-requiring type 2 diabetes need to live. Although rates of hyperglycemic emergencies may be higher among uninsured patients owing to poor access to medical care, healthy food, and housing,16,34 many people with employer-sponsored private health plans have high deductibles and out-of-pocket cost-sharing expenses,35 which may be associated with financial distress36 and greater likelihood of forgoing necessary medical care.37 Young patients may be particularly susceptible to financial instability and underinsurance,34,38 which may be associated with poor glycemic control,21,34,39,40 inadequate ambulatory care, and ultimately, higher rates of hyperglycemic crises, like those observed in our study. Thus, multidisciplinary teams should anticipate these barriers to care, develop care plans that are affordable and accessible, and help patients navigate available support programs.
We believe that greater attention should be given to addressing racial/ethnic disparities in diabetes management. Black patients with type 1 diabetes or with type 2 diabetes had higher risks of hyperglycemic crises than individuals in the other racial/ethnic groups included in the study. This disparity persisted after adjustment for key socioeconomic, clinical, and treatment-related factors, suggesting that additional intrinsic and extrinsic factors are associated with hyperglycemic crises among Black patients. Black patients may be more likely to experience DKA in the context of ketosis-prone type 2 diabetes, which is more prevalent among Black patients.41,42,43 In addition to biological risk factors, increased DKA and HHS risk among Black patients may be associated with unmeasured social determinants of health and manifestations of structural racism both within and outside health care.44 Black patients with type 2 diabetes are more likely than White patients to be undertreated, and undertreated patients are more likely to experience hyperglycemic crises than patients who were treated appropriately.32 Black patients are also more likely to be cared for by clinicians45 and health systems46 that deliver lower-quality care or have fewer resources available to optimally care for their patients,45 which may contribute to worse health outcomes. Furthermore, Black patients are more likely to reside in less walkable neighborhoods47 with fewer healthy food options,48,49,50 which may be associated with worse glycemic control. Thus, additional research is needed to understand the multiplicity of factors contributing to the undertreatment of Black patients with diabetes, barriers to managing their diabetes, and their increased risk of hyperglycemic crises.
Poorly controlled diabetes was another factor associated with hyperglycemic crises. For patients with type 1 diabetes, risk of experiencing a hyperglycemic crisis increased when the HbA1c level exceeded 7%, and the IRR was 7.81 (95% CI, 5.78-10.54) for HbA1c levels of 10% or higher compared with HbA1c levels of 6.5% to 6.9%. For patients with type 2 diabetes, the risk increased continuously for all HbA1c levels above 5.6%, and the IRR was 7.06 (95% CI, 6.26-7.96) for HbA1c levels of 10% or higher. This association of HbA1c level with increased risk of hyperglycemic emergencies overlooks the importance of real-time glycemic variability that would be captured by self-monitoring or continuous glucose monitoring. The importance of glycemic variability is underscored by the finding that severe hypoglycemia was associated with a 3- to 4-fold increase in the risk of experiencing a hyperglycemic crisis. Because patients with high HbA1c levels also frequently experience severe hypoglycemia,11 an elevated HbA1c level is a signal of susceptibility to both hyperglycemic and hypoglycemic crises.
Strengths and Limitations
This study is strengthened by the ability to examine patient- and treatment-level factors associated with hyperglycemic crises at the population level using longitudinal analysis16 and is not limited to a single health care system.16 The present study also provides, to our knowledge, the most contemporary epidemiological data on DKA and HHS through the end of 2020, including during the COVID-19 pandemic in the US.
This study also has limitations. First, this observational analysis was designed to examine the epidemiological features of and factors associated with hyperglycemic crises, not to establish a causal relationship between any factor(s) and these events. The classification scheme for type of diabetes and the adjudication of events as being DKA or HHS may not be accurate because both determinations were limited by data available in the claims database. Because all patients had established diabetes, we did not capture instances of newly diagnosed diabetes in patients presenting with DKA (particularly of interest in the context of COVID-19) or assess the impact of lapsed insurance. Our data also did not allow us to examine the factors leading up to and precipitating hyperglycemic events, such as medication nonadherence or acute illness.2,34 However, our objectives were to characterize the frequency of hyperglycemic crises among adults with type 1 diabetes or with type 2 diabetes in the US and to identify patient- and treatment-related factors associated with these events. These epidemiologic data are necessary to inform targeted interventions at multiple levels to prevent hyperglycemic crises among individuals at highest risk of these conditions.
Conclusions
In this cohort study, younger age, Black race/ethnicity, low income, and poor glycemic control were associated with an increased risk of hyperglycemic crises. The findings suggest that efforts are needed to facilitate engagement of these groups with the health care system, assess and address potential barriers—financial, logistical, psychosocial, or medical—to optimal control of patients’ blood glucose levels, and provide referral for diabetes self-management education and support.15,51 Health care delivery systems should incorporate educational, clinical, and social support systems into clinical practice, and payers should consider expanding reimbursement for self-management education and social services as well as more comprehensive coverage for glucose-lowering medications, insulin, and glucose-monitoring technologies.
eTable 1. Code Sets for Included Health Conditions
eTable 2. Classification Scheme for Glucose-Lowering Medications
eTable 3. Patients With Type 2 Diabetes
eTable 4. Crude and Adjusted Rates of Hyperglycemic Crises Among Patients With Type 1 and Type 2 Diabetes, 2014-2020
eTable 5. Crude and Adjusted Rates of Hyperglycemic Crises Among Patients With Type 1 Diabetes by Prespecified Subgroup, 2014-2020
eTable 6. Crude and Adjusted Rates of Hyperglycemic Crises Among Patients With Type 2 Diabetes by Prespecified Subgroup, 2014-2020
eTable 7. Risk Factors for DKA and HHS (Examined as Independent Outcomes) Among Adults With Type 2 Diabetes, 2014-2020
References
- 1.Centers for Disease Control and Prevention . National Diabetes Statistics Report, 2020. US Department of Health and Human Services, Centers for Disease Control and Prevention; 2020. [Google Scholar]
- 2.Umpierrez G, Korytkowski M. Diabetic emergencies—ketoacidosis, hyperglycaemic hyperosmolar state and hypoglycaemia. Nat Rev Endocrinol. 2016;12(4):222-232. doi: 10.1038/nrendo.2016.15 [DOI] [PubMed] [Google Scholar]
- 3.Karslioglu French E, Donihi AC, Korytkowski MT. Diabetic ketoacidosis and hyperosmolar hyperglycemic syndrome: review of acute decompensated diabetes in adult patients. BMJ. 2019;365:l1114. doi: 10.1136/bmj.l1114 [DOI] [PubMed] [Google Scholar]
- 4.Chang LH, Lin LY, Tsai MT, et al. Association between hyperglycaemic crisis and long-term major adverse cardiovascular events: a nationwide population-based, propensity score-matched, cohort study. BMJ Open. 2016;6(8):e012233. doi: 10.1136/bmjopen-2016-012233 [DOI] [PMC free article] [PubMed] [Google Scholar]
- 5.Mays JA, Jackson KL, Derby TA, et al. An evaluation of recurrent diabetic ketoacidosis, fragmentation of care, and mortality across Chicago, Illinois. Diabetes Care. 2016;39(10):1671-1676. doi: 10.2337/dc16-0668 [DOI] [PubMed] [Google Scholar]
- 6.Kao Y, Hsu CC, Weng SF, et al. Subsequent mortality after hyperglycemic crisis episode in the non-elderly: a national population-based cohort study. Endocrine. 2016;51(1):72-82. doi: 10.1007/s12020-015-0669-8 [DOI] [PubMed] [Google Scholar]
- 7.Benoit SR, Zhang Y, Geiss LS, Gregg EW, Albright A. Trends in diabetic ketoacidosis hospitalizations and in-hospital mortality—United States, 2000-2014. MMWR Morb Mortal Wkly Rep. 2018;67(12):362-365. doi: 10.15585/mmwr.mm6712a3 [DOI] [PMC free article] [PubMed] [Google Scholar]
- 8.Kitabchi AE, Umpierrez GE, Miles JM, Fisher JN. Hyperglycemic crises in adult patients with diabetes. Diabetes Care. 2009;32(7):1335-1343. doi: 10.2337/dc09-9032 [DOI] [PMC free article] [PubMed] [Google Scholar]
- 9.Dhatariya KK, Skedgel C, Fordham R. The cost of treating diabetic ketoacidosis in the UK: a national survey of hospital resource use. Diabet Med. 2017;34(10):1361-1366. doi: 10.1111/dme.13427 [DOI] [PubMed] [Google Scholar]
- 10.Desai D, Mehta D, Mathias P, Menon G, Schubart UK. Health care utilization and burden of diabetic ketoacidosis in the US over the past decade: a nationwide analysis. Diabetes Care. 2018;41(8):1631-1638. doi: 10.2337/dc17-1379 [DOI] [PubMed] [Google Scholar]
- 11.McCoy RG, Lipska KJ, Van Houten HK, Shah ND. Association of cumulative multimorbidity, glycemic control, and medication use with hypoglycemia-related emergency department visits and hospitalizations among adults with diabetes. JAMA Netw Open. 2020;3(1):e1919099. doi: 10.1001/jamanetworkopen.2019.19099 [DOI] [PMC free article] [PubMed] [Google Scholar]
- 12.Schroeder EB, Xu S, Goodrich GK, Nichols GA, O’Connor PJ, Steiner JF. Predicting the 6-month risk of severe hypoglycemia among adults with diabetes: development and external validation of a prediction model. J Diabetes Complications. 2017;31(7):1158-1163. doi: 10.1016/j.jdiacomp.2017.04.004 [DOI] [PMC free article] [PubMed] [Google Scholar]
- 13.Karter AJ, Warton EM, Lipska KJ, et al. Development and validation of a tool to identify patients with type 2 diabetes at high risk of hypoglycemia-related emergency department or hospital use. JAMA Intern Med. 2017;177(10):1461-1470. doi: 10.1001/jamainternmed.2017.3844 [DOI] [PMC free article] [PubMed] [Google Scholar]
- 14.Pathak RD, Schroeder EB, Seaquist ER, et al. ; SUPREME-DM Study Group . Severe hypoglycemia requiring medical intervention in a large cohort of adults with diabetes receiving care in US integrated health care delivery systems: 2005-2011. Diabetes Care. 2016;39(3):363-370. doi: 10.2337/dc15-0858 [DOI] [PMC free article] [PubMed] [Google Scholar]
- 15.Ehrmann D, Kulzer B, Roos T, Haak T, Al-Khatib M, Hermanns N. Risk factors and prevention strategies for diabetic ketoacidosis in people with established type 1 diabetes. Lancet Diabetes Endocrinol. 2020;8(5):436-446. doi: 10.1016/S2213-8587(20)30042-5 [DOI] [PubMed] [Google Scholar]
- 16.Benoit SR, Hora I, Pasquel FJ, Gregg EW, Albright AL, Imperatore G. Trends in emergency department visits and inpatient admissions for hyperglycemic crises in adults with diabetes in the US, 2006-2015. Diabetes Care. 2020;43(5):1057-1064. doi: 10.2337/dc19-2449 [DOI] [PMC free article] [PubMed] [Google Scholar]
- 17.Wallace PJ, Shah ND, Dennen T, Bleicher PA, Crown WH. Optum Labs: building a novel node in the learning health care system. Health Aff (Millwood). 2014;33(7):1187-1194. doi: 10.1377/hlthaff.2014.0038 [DOI] [PubMed] [Google Scholar]
- 18.Office for Civil Rights, Department of Health and Human Services. Guidance regarding methods for de-identification of protected health information in accordance with the Health Insurance Portability and Accountability Act (HIPAA) privacy rule. Published 2012. Updated November 6, 2015. Accessed January 28, 2019. https://www.hhs.gov/sites/default/files/ocr/privacy/hipaa/understanding/coveredentities/De-identification/hhs_deid_guidance.pdf
- 19.von Elm E, Altman DG, Egger M, Pocock SJ, Gøtzsche PC, Vandenbroucke JP; STROBE Initiative . The Strengthening the Reporting of Observational Studies in Epidemiology (STROBE) statement: guidelines for reporting observational studies. Ann Intern Med. 2007;147(8):573-577. doi: 10.7326/0003-4819-147-8-200710160-00010 [DOI] [PubMed] [Google Scholar]
- 20.National Committee for Quality Assurance . National Committee for Quality Assurance (NCQA) Healthcare Effectiveness Data and Information Set (HEDIS) Comprehensive Diabetes Care. National Committee for Quality Assurance; 2015:74-98. [Google Scholar]
- 21.McCoy RG, Lipska KJ, Van Houten HK, Shah ND. Paradox of glycemic management: multimorbidity, glycemic control, and high-risk medication use among adults with diabetes. BMJ Open Diabetes Res Care. 2020;8(1):e001007. doi: 10.1136/bmjdrc-2019-001007 [DOI] [PMC free article] [PubMed] [Google Scholar]
- 22.McCoy RG, Van Houten HK, Deng Y, et al. Comparison of diabetes medications used by adults with commercial insurance vs Medicare Advantage, 2016 to 2019. JAMA Netw Open. 2021;4(2):e2035792. doi: 10.1001/jamanetworkopen.2020.35792 [DOI] [PMC free article] [PubMed] [Google Scholar]
- 23.Fang M, Wang D, Coresh J, Selvin E. Trends in diabetes treatment and control in US adults, 1999-2018. N Engl J Med. 2021;384(23):2219-2228. doi: 10.1056/NEJMsa2032271 [DOI] [PMC free article] [PubMed] [Google Scholar]
- 24.Wang L, Li X, Wang Z, et al. Trends in prevalence of diabetes and control of risk factors in diabetes among US adults, 1999-2018. JAMA. 2021. doi: 10.1001/jama.2021.9883 [DOI] [PMC free article] [PubMed] [Google Scholar]
- 25.Endocrine Society . Addressing insulin access and affordability: an Endocrine Society position statement. J Clin Endocrinol Metab. 2021;106(4):935-941. doi: 10.1210/clinem/dgaa817 [DOI] [PubMed] [Google Scholar]
- 26.Cefalu WT, Dawes DE, Gavlak G, et al. ; Insulin Access and Affordability Working Group . Insulin access and affordability working group: conclusions and recommendations. Diabetes Care. 2018;41(6):1299-1311. doi: 10.2337/dci18-0019 [DOI] [PMC free article] [PubMed] [Google Scholar]
- 27.Everett E, Mathioudakis NN. Association of socioeconomic status and DKA readmission in adults with type 1 diabetes: analysis of the US National Readmission Database. BMJ Open Diabetes Res Care. 2019;7(1):e000621. doi: 10.1136/bmjdrc-2018-000621 [DOI] [PMC free article] [PubMed] [Google Scholar]
- 28.Everett E, Mathioudakis N. Association of area deprivation and diabetic ketoacidosis readmissions: comparative risk analysis of adults vs children with type 1 diabetes. J Clin Endocrinol Metab. 2019;104(8):3473-3480. doi: 10.1210/jc.2018-02232 [DOI] [PMC free article] [PubMed] [Google Scholar]
- 29.Musey VC, Lee JK, Crawford R, Klatka MA, McAdams D, Phillips LS. Diabetes in urban African-Americans. I. cessation of insulin therapy is the major precipitating cause of diabetic ketoacidosis. Diabetes Care. 1995;18(4):483-489. doi: 10.2337/diacare.18.4.483 [DOI] [PubMed] [Google Scholar]
- 30.Hua X, Carvalho N, Tew M, Huang ES, Herman WH, Clarke P. Expenditures and prices of antihyperglycemic medications in the United States: 2002-2013. JAMA. 2016;315(13):1400-1402. doi: 10.1001/jama.2016.0126 [DOI] [PMC free article] [PubMed] [Google Scholar]
- 31.Zhou X, Shrestha SS, Shao H, Zhang P. Factors contributing to the rising national cost of glucose-lowering medicines for diabetes during 2005-2007 and 2015-2017. Diabetes Care. 2020;43(10):2396-2402. doi: 10.2337/dc19-2273 [DOI] [PMC free article] [PubMed] [Google Scholar]
- 32.McCoy RG, Lipska KJ, Van Houten HK, Shah ND. Development and evaluation of a patient-centered quality indicator for the appropriateness of type 2 diabetes management. BMJ Open Diabetes Res Care. 2020;8(2):e001878. doi: 10.1136/bmjdrc-2020-001878 [DOI] [PMC free article] [PubMed] [Google Scholar]
- 33.Herkert D, Vijayakumar P, Luo J, et al. Cost-related insulin underuse among patients with diabetes. JAMA Intern Med. 2019;179(1):112-114. doi: 10.1001/jamainternmed.2018.5008 [DOI] [PMC free article] [PubMed] [Google Scholar]
- 34.Wolf RA, Haw JS, Paul S, et al. Hospital admissions for hyperglycemic emergencies in young adults at an inner-city hospital. Diabetes Res Clin Pract. 2019;157:107869. doi: 10.1016/j.diabres.2019.107869 [DOI] [PMC free article] [PubMed] [Google Scholar]
- 35.Claxton G, Rae M, Damico A, Young G, McDermott D.. Employer Health Benefits: 2019 Annual Survey. Henry J. Kaiser Family Foundation; 2019. [Google Scholar]
- 36.Galbraith AA, Ross-Degnan D, Soumerai SB, Rosenthal MB, Gay C, Lieu TA. Nearly half of families in high-deductible health plans whose members have chronic conditions face substantial financial burden. Health Aff (Millwood). 2011;30(2):322-331. doi: 10.1377/hlthaff.2010.0584 [DOI] [PMC free article] [PubMed] [Google Scholar]
- 37.Rabin DL, Jetty A, Petterson S, Saqr Z, Froehlich A. Among low-income respondents with diabetes, high-deductible versus no-deductible insurance sharply reduces medical service use. Diabetes Care. 2017;40(2):239-245. doi: 10.2337/dc16-1579 [DOI] [PubMed] [Google Scholar]
- 38.Wharam JF, Zhang F, Eggleston EM, Lu CY, Soumerai S, Ross-Degnan D. Diabetes outpatient care and acute complications before and after high-deductible insurance enrollment: a Natural Experiment for Translation in Diabetes (NEXT-D) study. JAMA Intern Med. 2017;177(3):358-368. doi: 10.1001/jamainternmed.2016.8411 [DOI] [PMC free article] [PubMed] [Google Scholar]
- 39.Styles E, Kidney RSM, Carlin C, Peterson K. Diabetes treatment, control, and hospitalization among adults aged 18 to 44 in Minnesota, 2013-2015. Prev Chronic Dis. 2018;15:E142. doi: 10.5888/pcd15.180255 [DOI] [PMC free article] [PubMed] [Google Scholar]
- 40.Lipska KJ, Yao X, Herrin J, et al. Trends in drug utilization, glycemic control, and rates of severe hypoglycemia, 2006-2013. Diabetes Care. 2017;40(4):468-475. doi: 10.2337/dc16-0985 [DOI] [PMC free article] [PubMed] [Google Scholar]
- 41.Umpierrez GE, Kelly JP, Navarrete JE, Casals MM, Kitabchi AE. Hyperglycemic crises in urban blacks. Arch Intern Med. 1997;157(6):669-675. doi: 10.1001/archinte.1997.00440270117011 [DOI] [PubMed] [Google Scholar]
- 42.Banerji MA, Chaiken RL, Lebovitz HE. Long-term normoglycemic remission in black newly diagnosed NIDDM subjects. Diabetes. 1996;45(3):337-341. doi: 10.2337/diab.45.3.337 [DOI] [PubMed] [Google Scholar]
- 43.Mauvais-Jarvis F, Sobngwi E, Porcher R, et al. Ketosis-prone type 2 diabetes in patients of sub-Saharan African origin: clinical pathophysiology and natural history of beta-cell dysfunction and insulin resistance. Diabetes. 2004;53(3):645-653. doi: 10.2337/diabetes.53.3.645 [DOI] [PubMed] [Google Scholar]
- 44.Golden SH, Joseph JJ, Hill-Briggs F. Casting a health equity lens on endocrinology and diabetes. J Clin Endocrinol Metab. 2021;106(4):e1909-e1916. doi: 10.1210/clinem/dgaa938 [DOI] [PubMed] [Google Scholar]
- 45.Bach PB, Pham HH, Schrag D, Tate RC, Hargraves JL. Primary care physicians who treat blacks and whites. N Engl J Med. 2004;351(6):575-584. doi: 10.1056/NEJMsa040609 [DOI] [PubMed] [Google Scholar]
- 46.Lewis VA, Fraze T, Fisher ES, Shortell SM, Colla CH. ACOs serving high proportions of racial and ethnic minorities lag in quality performance. Health Aff (Millwood). 2017;36(1):57-66. doi: 10.1377/hlthaff.2016.0626 [DOI] [PMC free article] [PubMed] [Google Scholar]
- 47.Conderino SE, Feldman JM, Spoer B, Gourevitch MN, Thorpe LE. Social and economic differences in neighborhood walkability across 500 U.S. cities. Am J Prev Med. Published online June 6, 2021. doi: 10.1016/j.amepre.2021.03.014 [DOI] [PubMed] [Google Scholar]
- 48.Bower KM, Thorpe RJ Jr, Rohde C, Gaskin DJ. The intersection of neighborhood racial segregation, poverty, and urbanicity and its impact on food store availability in the United States. Prev Med. 2014;58:33-39. doi: 10.1016/j.ypmed.2013.10.010 [DOI] [PMC free article] [PubMed] [Google Scholar]
- 49.Powell LM, Slater S, Mirtcheva D, Bao Y, Chaloupka FJ. Food store availability and neighborhood characteristics in the United States. Prev Med. 2007;44(3):189-195. doi: 10.1016/j.ypmed.2006.08.008 [DOI] [PubMed] [Google Scholar]
- 50.Larson NI, Story MT, Nelson MC. Neighborhood environments: disparities in access to healthy foods in the U.S. Am J Prev Med. 2009;36(1):74-81. doi: 10.1016/j.amepre.2008.09.025 [DOI] [PubMed] [Google Scholar]
- 51.Wexler DJ, Beauharnais CC, Regan S, Nathan DM, Cagliero E, Larkin ME. Impact of inpatient diabetes management, education, and improved discharge transition on glycemic control 12 months after discharge. Diabetes Res Clin Pract. 2012;98(2):249-256. doi: 10.1016/j.diabres.2012.09.016 [DOI] [PMC free article] [PubMed] [Google Scholar]
Associated Data
This section collects any data citations, data availability statements, or supplementary materials included in this article.
Supplementary Materials
eTable 1. Code Sets for Included Health Conditions
eTable 2. Classification Scheme for Glucose-Lowering Medications
eTable 3. Patients With Type 2 Diabetes
eTable 4. Crude and Adjusted Rates of Hyperglycemic Crises Among Patients With Type 1 and Type 2 Diabetes, 2014-2020
eTable 5. Crude and Adjusted Rates of Hyperglycemic Crises Among Patients With Type 1 Diabetes by Prespecified Subgroup, 2014-2020
eTable 6. Crude and Adjusted Rates of Hyperglycemic Crises Among Patients With Type 2 Diabetes by Prespecified Subgroup, 2014-2020
eTable 7. Risk Factors for DKA and HHS (Examined as Independent Outcomes) Among Adults With Type 2 Diabetes, 2014-2020