

Abstract
Background
Choroid plexus cysts (CPC) and echogenic intracardiac focus (EIF) are obsolete soft markers found on morphology ultrasound and not a valid reason for adjusting fetal risk of aneuploidy.
Method
We conducted a retrospective audit of women referred to genetic counsellor and fetal medicine services at St George Hospital (SGH) and the Royal Hospital for Women (RHW) for CPC and EIF from 1 January 2006 to 31 December 2016 inclusive.
Results
In total, 208 CPC and/or EIF referrals were identified, 118 (57%) of which were for isolated CPC and/or EIF and 102 (49%) occurring in women low risk for aneuploidy prior to morphology ultrasound. Significantly, more women had undergone combined first‐trimester screening in the 2014 to 2016 epoch vs. previous years at both SGH (P = 0.03) and RHW (P = 0.004). However, the number of women referred for CPC and EIF remained relatively constant. No fetus was born with a major structural or chromosomal abnormality in the group of low‐risk women with isolated signs. However, 18% of these women were referred to both genetic counselling and fetal medicine services, 7% had NIPT after morphology, 14% had amniocentesis, and 33% had additional ultrasound(s).
Conclusion
Despite advances in screening technology, low‐risk women are still referred to specialist services for these 2 soft signs and undergoing unnecessary follow‐up, NIPT and amniocentesis.
Keywords: choroid plexus cysts, consequences of reporting, echogenic intracardiac focus, isolated soft markers, morphology ultrasound
Introduction
Choroid plexus cysts (CPC) and echogenic intracardiac focus (EIF) are minor fetal structural changes commonly detected at the second‐trimester morphology ultrasound.1 EIF is microcalcifications of the papillary muscle or chordae tendineae (Figure 1). Despite being structurally a variation of normal, EIF was first reported to be associated with trisomy 21 (Down syndrome, DS) in 1987.2, 3 Similarly, CPC, which are formed when neuroepithelial folds fill with CSF and cellular debris, are of no pathological significance.4, 5 Although found in 0.3–3.5% of the general population, CPC, as shown in Figure 2, are considered to be markers of trisomy 18 due to a reported prevalence of 30–50% in affected fetuses. However, the incidence of CPC as an isolated ultrasonic marker of trisomy 18 is only 4.3%, as additional fetal abnormalities are reported in at least 80% of fetuses with trisomy 18.6, 7, 8
Figure 1.
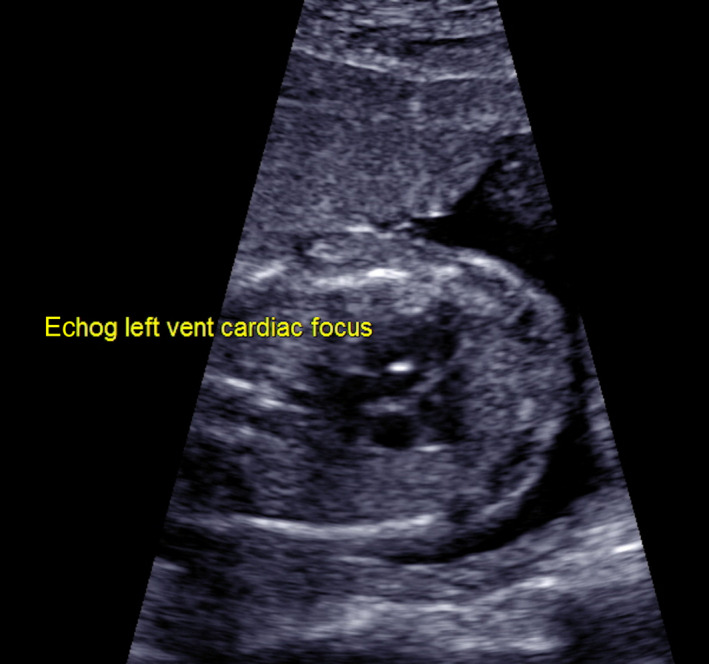
Echogenic intracardiac focus.
Figure 2.
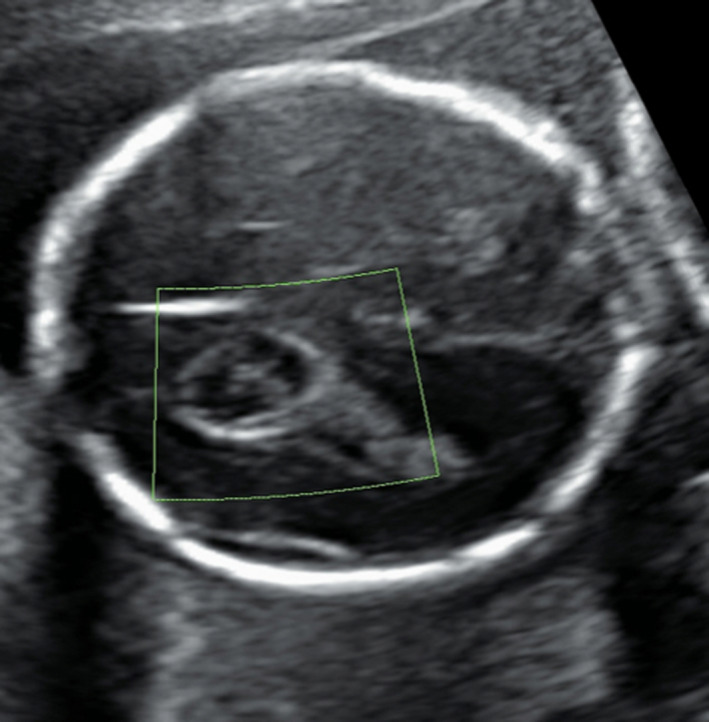
Choroid plexus cyst.
Controversy that surrounds these ‘soft markers’ stems from studies in the 1980s and 1990s that demonstrated an association between these markers and aneuploidy. However, many studies were performed in high‐risk patients and in the absence of other prenatal screening.3, 4, 5, 9, 10, 11 The development of combined first‐trimester screening (CFTS) and, most recently, non‐invasive prenatal testing (NIPT) has altered the way in which we should view and use these soft markers in clinical practice.7, 8, 12, 13 Australian recommendations since 2008 have been not to report isolated CPC and/or EIF.6 More recently, with the widespread availability of NIPT, the International Society of Ultrasound in Obstetrics and Gynaecology has noted that soft markers for trisomy 21 (obviously including EIF) should not be assessed in women with normal NIPT.14
This study aimed to audit local referral practices for isolated EIF and CPC, with specific focus on referral for these soft signs in the context of low‐risk prenatal screening. It also analysed the consequences of continued disclosure particularly in terms of further follow‐up, amniocentesis and NIPT.
Method
Retrospective audit of women referred to genetic and fetal medicine services at 2 metropolitan Sydney hospitals, St George (SGH) and the Royal Hospital for Women (RHW), after a ‘soft sign’ of CPC and/or EIF was reported, from 1 January 2006 to 31 December 2016 inclusive. Cases identified were women referred to MFM and/or genetic counsellors at RHW and SGH; this included women booked into other hospitals for obstetric care. Cases were identified using the Maternal‐Fetal Medicine (MFM) Department's Viewpoint Database and genetic databases at both SGH and RHW, cross‐checked against each other and against medical records to ascertain which patients had seen only the genetic counsellor, which patients had only seen the MFM team, and which patients had seen both.
Data collected are shown in Appendix 1. Data included maternal demographic, specific soft signs reported and whether they were isolated, aneuploidy screening prior to CPC/EIF identification, details relating to genetic counsellor and/or MFM referral, findings at MFM ultrasound where available, further testing undertaken after CPC/EIF identification and pregnancy outcome.
As CPC and EIF are soft markers for different aneuploidies, trisomy 18 and trisomy 21, respectively, findings of patients with both CPC and EIF but no other soft markers were also recorded and considered as ‘isolated’ soft signs for the purpose of this review.
Reflecting the local cut‐offs for high vs. low risk across the time period covered by the audit, ‘low‐risk’ patients were defined as those with any prior testing resulting in less than 1 in 300 risk of trisomy 21 and trisomy 18 (by NIPT, CFTS, NT or triple test) or a maternal age of <35 in the absence of prior testing.
Data analysis
Microsoft Excel was used to maintain the database, and SPSS was used for statistical analysis (SPSS Statics for Windows 24.0, IBM Corporation, Armonk, NY). After data cleaning, descriptive analysis and checking of continuous data for normality were undertaken. Continuous data are presented as mean ± standard deviation, or if non‐parametric as median (interquartile range).
Categorical data are presented as frequencies and percentage. Significance testing between subgroups (isolated vs. non‐isolated soft markers, isolated RHW 2014–2016 vs. isolated SGH 2014–2016, low risk prior to morphology vs. not) was undertaken using t‐test or Mann–Whitney U test for continuous data as appropriate and chi‐squared testing for categorical data. Statistical significance was defined as a P value of < 0.05.
Ethics approval
Prospective ethics approval (low/negligible risk project) was granted by the South‐Eastern Sydney Local Health District Human Research Ethics Committee, (HREC REF 16/384).
Results
From January 2006 to December 2016, 208 women were referred to genetic counsellor and/or fetal medicine services at RHW (n = 114) and SGH (n = 94) for CPC and/or EIF (Figure 3). Of these, 118 were for isolated CPC/EIF and are the focus on this report. Due to missing data 2006–09 SGH and 2009–13 RHW, this is an underestimate of total cases, so overall frequency of referral for soft signs cannot be calculated. In the 2014–2016 epoch, where complete data were available, there were 38 and 43 soft sign referrals at SGH and RHW, respectively, representing about 0.5% and 0.35% of all confinements at those hospitals. Of these referrals, 25 at each centre were for isolated CPC and/or EIF. Both in the overall study period and in 2014–2016, the proportion of referrals for isolated CPC/EIF vs. non‐isolated was similar at the 2 hospitals (approximately 60% of referrals for isolated and 40% non‐isolated).
Figure 3.
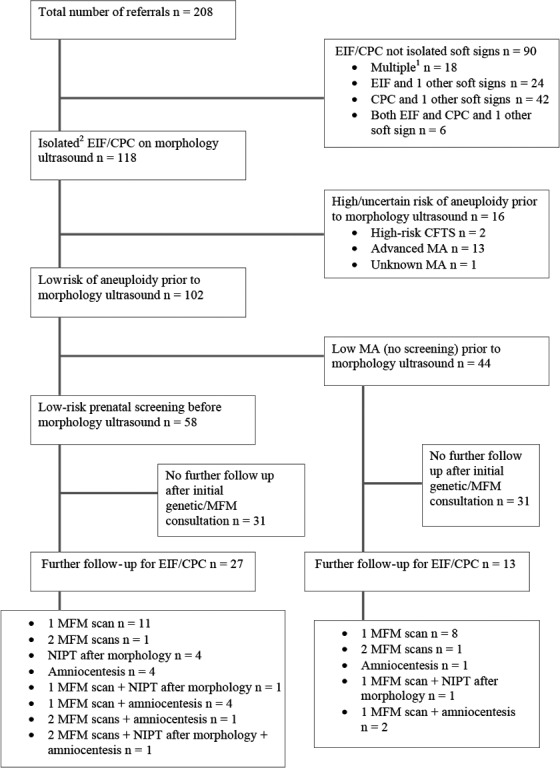
Summary of referrals for CPC/EIF at RHW and SGH from 2006 to 2016.
Table 1 shows demographic and index pregnancy data for all isolated EIF and/or CPC referrals and women referred to either SGH or RHW with isolated EIF/CPC in 2014 to 2016. The majority of women were nulliparous (48%). Most women 81/118 (69%) had no significant obstetric or gynaecological history or any pregnancy complications in the index pregnancy.
Table 1.
Demographic and pregnancy characteristics at time of referral for isolated CPC and/or EIF
| All referrals | SGH 2014–2016 |
RHW 2014–2016 |
P‐value SGH vs. RHW |
|
|---|---|---|---|---|
| n = 118 | n = 25 | n = 24 | ||
| Maternal Age (years), mean ± SD | 31.1 ± 5.7 | 31.3 ± 6.5 | 31.1 ± 4.1 | 0.901 |
| n = 118 | n = 24 | n = 24 | ||
| Body mass index (kg/m2), mean ± SD | 23.2 ± 4.2 | 23.7 ± 4.0 | 22.4 ± 2.4 | 0.178 |
| n (%) | n (%) | n (%) | ||
| n = 118 | n = 25 | n = 25 | ||
| Reason for referral | 0.337 | |||
| Isolated EIF on morphology | 53 (45) | 9 (36) | 14 (56) | |
| Isolated CPC on morphology | 40 (34) | 10 (40) | 6 (24) | |
| Both CPC and EIF | 25 (21) | 6 (24) | 5 (20) | |
| n = 112 | n = 24 | n = 25 | ||
| Region of Birth | 0.068 | |||
| Australia or New Zealand | 50 (42) | 15 (63) | 11 (44) | |
| Europe (including the UK and Ireland) | 16 (14) | 1 (4) | 8 (32) | |
| Asia | 36 (31) | 7 (29) | 6 (24) | |
| Africa | 6 (5) | 1 (4) | 0 (0) | |
| Othera | 4 (3) | 0 (0) | 0 (0) | |
| n = 90 | n = 24 | n = 17 | ||
| Gestation at referral (weeks), mean ± SD | 19.7 ± 1.5 | 19.2 ± 1.1 | 21.7 ± 1.6 | <0.001*** |
| n (%) | n (%) | n (%) | ||
| n = 111 | n = 25 | n = 24 | ||
| Parity | 0.051 | |||
| Nulliparous | 57 (48) | 11 (44) | 18 (75) | |
| Primiparous | 37 (31) | 8 (32) | 5 (21) | |
| Multiparous | 17 (14) | 6 (24) | 1 (4) | |
| n = 118 | n = 25 | n = 25 | ||
| Plurality | 1.000 | |||
| Singleton | 115 (98) | 25 (100) | 25 (100) | |
| Twins | 3 (2) | 0 (0) | 0 (0) |
SGH, St George Hospital; RHW, Royal Hospital for Women; SD, standard deviation; UK, United Kingdom.
Includes women born in the Middle East (n = 2) and North America (n = 2).
Aneuploidy screening (Table 2) had occurred prior to morphology in 96/208 (46%) of total referrals and in 61/118 (52%) with isolated CPC and/or EIF. In this isolated group, screening was most commonly performed by CFTS (n = 57), with 55 women (96%) having a low‐risk result. Of the women with low‐risk CFTS, 5 additionally were low risk on NIPT prior to second‐trimester ultrasound. Seven women with isolated signs opted for NIPT after findings on morphology scan.
Table 2.
Prenatal screening and risk of aneuploidy, isolated CPC and/or EIF
| All referrals | SGH 2014–2016 |
RHW 2014–2016 |
P‐value SGH vs. RHW |
|
|---|---|---|---|---|
| n (%) | n (%) | n (%) | ||
| n = 118 | n = 25 | n = 25 | ||
| CFTS | 0.467 | |||
| Low‐risk | 56 (48) | 18 (72) | 15 (60) | |
| NT onlya (low‐risk) | 2 (2) | 0 (0) | 1 (4) | |
| High‐risk | 2 (2) | 0 (0) | 0 (0) | |
| No CFTS | 58 (49) | 7 (28) | 9 (36) | |
| n = 12 | n = 8 | n = 4 | ||
| Time of NIPTb | 0.408 | |||
| Prior to morphology | 5 (42) | 4 (50) | 1 (25) | |
| After morphology | 7 (58) | 4 (50) | 3 (75) | |
| n = 118 | n = 25 | n = 25 | ||
| Risk of aneuploidy prior to morphology | 0.600 | |||
| Lowc | 102 (86) | 24 (96) | 23 (92) | |
| Uncertaind | 1 (1) | 1 (4) | 1 (4) | |
| Highe | 15 (13) | 0 (0) | 1 (4) |
SGH, St George Hospital; RHW, Royal Hospital for Women; CFTS, combined first‐trimester screening; NT, nuchal translucency; NIPT, non‐invasive prenatal testing.
Risk calculated by measurement of NT only.
All women in this study who underwent NIPT received a low‐risk result.
Includes women of low MA (<35 years) (n = 44), women who received low‐risk CFTS (n = 51), women who received low‐risk CFTS and a low‐risk NIPT (n = 4), a woman who received a low‐risk triple test (n = 1) and women who received a low‐risk NT (n = 2).
Maternal age is not known and no screening performed (n = 1).
Includes women of advanced MA (≥35 years) (n = 13), women who received a high‐risk CFTS (n = 1) and a woman who received a high‐risk NT (n = 1).
Prior to morphology scan, 86% of women with isolated CPC/EIF were low risk. For 44 of these women, the absence of screening meant that low risk was determined by maternal age < 35 years. For the remaining 58, low risk was determined by validated screening tests (CFTS, NT measurement, NIPT or triple test). Of 14 high‐risk women, 13 were of advanced maternal age in the absence of other screening and 1 had prior high‐risk CFTS. There were no significant differences between sites in prenatal screening or risk profile in the 2014–2016 epoch.
A comparison of screening and risk of chromosomal abnormality across time periods found that significantly more women had undergone CFTS in the 2014–2016 epoch compared to previous years, at both SGH (P = 0.03) and RHW (P = 0.004).
While there was no significant change in the number of low‐risk patients being referred across the study time period, the way in which risk of aneuploidy was determined altered. In women referred from 2006–2008 at RHW, the risk prior to morphology was determined for 83% of low‐risk women by their age. However, in 2014–2016 epoch this dropped to 37% (P = 0.001). Similarly, at SGH the number of women whose risk profile was determined by a low‐risk result at prenatal screening rose from 35% to 63% (P = 0.013).
Use of NIPT was seen in the 2014–2016 epoch. All women who underwent NIPT had a low‐risk result. Of the women with isolated soft markers, 5 (42%) had both a low‐risk NIPT and low‐risk CFTS prior to referral and 7 (58%) were referred after morphology. There was some evidence of NIPT being used to provide non‐invasive reassurance, in that women with isolated CPC/EIF were more likely to receive NIPT than women with non‐isolated (P = 0.04).
Consequences of reporting soft markers
Of 118 women with isolated CPC and/or EIF, 76 (64%) were referred to genetic counsellors after soft signs were reported, 21 (18%) were referred to MFM specialists while 21 (18%) received referral to both. There were 102 women with isolated soft signs who prior to morphology ultrasound were low risk for fetal chromosomal abnormality, yet still referred for assessment. As shown in Table 3, 18% of these women underwent both genetic and MFM consultation, 14% had amniocentesis, and 5% had NIPT after morphology ultrasound. Further follow‐up after the initial genetic or MFM consultation (including further ultrasound, NIPT post‐morphology and amniocentesis) occurred in 27/58 (47%) after low‐risk prior screening and 13/44 (30%) with isolated EIF/CPC and age < 35.
Table 3.
Consequences of reporting soft signs, in low‐risk women with isolated soft markers
| Isolateda and low risk prior to morphology n = 102 |
Remainder of cases n = 106 |
P‐value between groups | |
|---|---|---|---|
| n (%) | n (%) | ||
| Referral | <0.001*** | ||
| Genetic counsellor referral | 66 (65) | 32 (30) | |
| MFM referral and scan | 18 (18) | 35 (33) | |
| Both genetic and MFM referral and scan | 18 (18) | 39 (37) | |
| Amniocentesis | 0.003** | ||
| Yes | 14 (14) | 33 (31) | |
| No | 88 (86) | 73 (69) | |
| n = 14 | n = 33 | ||
| Result of amniocentesis | 0.074 | ||
| Chromosomally normal fetus | 11 (79) | 24 (72)b | |
| Trisomy 21 or Trisomy 18 | 0 (0) | 7 (21) | |
| Other results at amnioc | 1 (7) | 1 (3) | |
| Amnio result not available | 2 (14)d | 1 (3)e | |
| n = 12 | n = 9 | ||
| NIPT post‐morphology scan | 0.256 | ||
| Nof | 5 (42) | 6 (67) | |
| Yes | 7 (58) | 3 (33) | |
| n = 34 | n = 73 | ||
| MFM referral and scan | 0.039* | ||
| 1 MFM scan for EIF/CPCg , h | 27 (79) | 43 (59) | |
| 2 MFM scans for EIF/CPCg , h | 4 (12) | 7 (10) | |
| MFM scan(s) for other indicationsg | 3 (9) | 23 (32) | |
| Results of MFM scan | 0.813 | ||
| Normal MFM ultrasound | 22 (65) | 43 (59) | |
| No data available | 5 (15) | 11 (15) | |
| Soft marker confirmed at MFM ultrasound | 7 (21) | 19 (26) | |
| Findings of MFM scan | 0.475 | ||
| No findings | 22 (65) | 44 (60) | |
| Abnormal biometry | 7 (21) | 15 (21) | |
| No data available | 5 (15) | 9 (12) | |
| Other abnormalities††† | 0 (0) | 5 (7) |
MFM, maternal–fetal medicine; NIPT, non‐invasive prenatal testing; EIF, echogenic intracardiac focus; CPC, choroid plexus cysts.
Includes women referred for CPC and EIF and no additional soft markers.
Includes karyotypically normal fetus with severe intrauterine growth restriction, oligohydramnios and confirmed Dandy‐Walker malformation with partial agenesis of the corpus callosum, feticide at 33 + 0 weeks (n = 1).
Includes a low‐risk isolated fetus diagnosed with 47XX dicentric 15 (same known chromosomal variant as mother and sibling, both of whom are phenotypically normal) (n = 1) and a fetus with multiple soft signs and Pallister Killian syndrome (n = 1).
Includes women whose pregnancy outcome data indicate normal pregnancy outcome (n = 2).
Includes a fetus with multiple abnormalities including lumbosacral spina bifida, TOP 22 + weeks (n = 1).
Includes NIPT referrals whereby it is uncertain whether NIPT occurred before or after morphology (n = 2).
Cases whereby both amniocentesis and anomaly scan were completed in one consultation have been counted as one ultrasound.
Subsequent scans for other abnormalities/soft markers are not included in the number of MFM scans.
Including abnormal placenta, abnormal biometry and amniotic fluid, abnormal biometry and placenta, abnormal Doppler.
Eleven of the 208 pregnancies resulted in a chromosomally abnormal fetus. Only one of these was in the low‐risk isolated CPC/EIF group and was a morphologically normal 47XX dicentric 15 fetus. This was a previously known familial anomaly (same variant in normally functioning mother and sibling) and the pregnancy continued. All three cases of trisomy 21 and the 6 trisomy 18 cases were in the non‐isolated group. There was also one case of Pallister Killian syndrome in the non‐isolated group.
Pregnancy outcome
Complete pregnancy outcome data were available for 175 of the 208 women referred (84%). Most women had vaginal birth at term of normal birthweight infants (Table 4). Eleven neonates were stillborn (seven pregnancy terminations after 20 weeks and four intrauterine fetal deaths). There was a significant difference when comparing the isolated vs. non‐isolated populations, with 99% of isolated CPC/EIF babies live born (one stillbirth of a chromosomally normal fetus). In comparison, 12% of non‐isolated subgroup babies were stillborn (P = 0.001), mostly due to pregnancy termination for aneuploidy or fetal death in utero in a fetus with a known aneuploidy. Similarly, 94% of neonates with isolated morphology had similarly superior outcomes (Table 4) with no undiagnosed chromosomal or major structural abnormalities post‐natally.
Table 4.
Pregnancy outcome
| All referrals n = 208 |
Isolated n = 118 |
Not isolated n = 90 |
Isolateda and low risk prior to morphology n = 102 | Remainder of cases n = 106 |
P‐value isolated1 vs. not isolated | P value isolated1 low risk vs. others | |
|---|---|---|---|---|---|---|---|
| n (%) | n (%) | n (%) | n (%) | n (%) | |||
| n = 183 | n = 103 | n = 80 | n = 89 | n = 94 | |||
| Mode of birth | 0.597 | 0.575 | |||||
| NVB | 110 (60) | 65 (63) | 45 (56) | 56 (63) | 54 (57) | ||
| Assisted | 32 (17) | 18 (17) | 14 (18) | 16 (18) | 16 (17) | ||
| Caesarean section (indicated)b | 30 (16) | 16 (16) | 14 (18) | 14 (16) | 16 (17) | ||
| Caesarean section (elective) | 9 (5) | 4 (4) | 5 (6) | 3 (3) | 6 (6) | ||
| Vaginal breech | 2 (1) | 0 (0) | 2 (3) | 0 (0) | 2 (1) | ||
| n = 185 | n = 103 | n = 82 | n = 89 | n = 96 | |||
| Neonatal outcome | 0.001** | 0.008** | |||||
| Live born | 174 (94) | 102 (99) | 72 (88) | 88 (99) | 86 (90) | ||
| Stillborn | 11 (6) | 1 (1) | 10 (12) | 1 (1) | 10 (10) | ||
| n = 176 | n = 98 | n = 78 | n = 84 | n = 92 | |||
| Neonatal complications at birth | 0.001** | 0.004** | |||||
| None | 149 (85) | 92 (94) | 57 (73) | 79 (94) | 70 (76) | ||
| Structural abnormalityc | 6 (3) | 1 (1) | 5 (6) | 0 (0) | 6 (7) | ||
| Other abnormalitiesd | 12 (7) | 5 (5) | 7 (9) | 5 (6) | 7 (8) | ||
| Trisomy 18 | 6 (3) | 0 (0) | 6 (8) | 0 (0) | 6 (7) | ||
| Trisomy 21 | 3 (2) | 0 (0) | 3 (4) | 0 (0) | 3 (3) | ||
| n = 175 | n = 98 | n = 77 | n = 84 | n = 91 | |||
| Gender | 0.291 | 0.283 | |||||
| Male | 99 (57) | 52 (53) | 47 (61) | 44 (52) | 55 (60) | ||
| Female | 76 (43) | 46 (47) | 30 (39) | 40 (48) | 36 (40) | ||
| n = 180 | n = 102 | n = 78 | n = 88 | n = 92 | |||
| Admission to NICU | 0.161 | 0.139 | |||||
| Yes | 11 (6) | 4 (4) | 7 (9) | 3 (3) | 8 (9) | ||
| No | 169 (94) | 98 (96) | 71 (91) | 85 (97) | 84 (91) | ||
| n = 21 | n = 3 | n = 18 | n = 2 | n = 19 | |||
| Abnormal neonatal outcomes | 0.323 | 0.094 | |||||
| Chromosomally normale | 2 (10) | 1 (33) | 1 (6) | 1 (50) | 1 (5) | ||
| Structural abnormalityc | 7 (33) | 1 (33) | 6 (33) | 0 (0) | 7 (37) | ||
| Other chromosomal abnormalitiesf | 2 (10) | 1 (33) | 1 (6) | 1 (50)f | 1 (5)††† | ||
| Trisomy 18 | 6 (29) | 0 (0) | 3 (17) | 0 (0) | 6 (32) | ||
| Trisomy 21g | 3 (14) | 0 (0) | 6 (33) | 0 (0) | 3 (16) | ||
| Major abnormalityh | 1 (5) | 0 (0) | 1 (6) | 0 (0) | 1 (5) | ||
| n = 11 | n = 1 | n = 10 | n = 1 | n = 10 | |||
| Stillbirth | 0.165 | 0.165 | |||||
| Fetal death in utero | 4 (36) | 1 (100) | 3 (30) | 1 (100)§§§ | 3 (30) | ||
| Termination | 7 (63) | 0 (0) | 7 (70) | 0 (0) | 7 (70) | ||
| TOP | N/A | N/A | N/A | N/A | N/A | N/A | |
| Trisomy 21 | 1 (14) | ||||||
| Trisomy 18 | 4 (57) | ||||||
| Other chromosomal abnormalities††† | 1 (14) | ||||||
| Other abnormalities | 1 (14) | ||||||
| Fetal death in utero | N/A | N/A | N/A | N/A | N/A | N/A | |
| T21 | 1 (25) | ||||||
| T18 | 2 (50) | ||||||
| Chromosomally normal‡‡‡ | 1 (25) | ||||||
| n = 174 | n = 96 | n = 78 | n = 82 | n = 92 | |||
| Gestation at birth (weeks), median (IQR) | 39.4 (38.3–40.3) | 39.9 (38.5–40.8) | 39.0 (37.1–40.0) | 39.9 (38.4–40.9) | 39.1 (37.9–40.1) | 0.001** | 0.007** |
| Birthweight (grams), median (IQR) | 3360 (3025–3653) | 3388 (3181–3703) | 3195 (2780–3560) | 3385 (3079–3699) | 3310 (2862–3600) | 0.041* | 0.227 |
SGH, St George Hospital; RHW, Royal Hospital for Women; NVB, normal vaginal birth; NICU, neonatal intensive care unit; N/A, not applicable; IQR, interquartile range; TOP, termination of pregnancy.
Includes women referred for CPC and EIF and no additional soft markers.
Includes obstetric and/or fetal indication and indication due to previous caesarean section.
Structural abnormalities including bilateral talipes (n = 2), post‐axial polydactyl feet (n = 1), deformity of all fingers on the left hand (n = 1), cleft lip and palate (n = 1), cleft lip and palate in addition to bilateral talipes (n = 1) and sacral meningomyelocele with Arnold Chiari (n = 1).
Other complications at birth include respiratory distress (n = 2), hypoglycaemia (n = 1), fetal admission to NICU due to maternal gestational diabetes (n = 2), low arterial cord pH (n = 1), ectopic heartbeat (n = 1), 2 vessel cord (n = 1), borderline ventriculomegaly (n = 1), subgaleal haematoma (n = 1), agenesis of the corpus callosum (n = 1) and fetal Dandy‐Walker malformation and partial agenesis of the corpus callosum (n = 1).
Includes fetal death in utero of chromosomally normal fetus (n = 1) and live birth of a fetus with agenesis of the corpus callosum (n = 1).
Includes live birth of fetus with dicentric 15 (47XX), the same chromosomal variant as mother and sibling, both of whom are phenotypically normal (n = 1) and a termination of fetus > 20 weeks due to Pallister Killian syndrome (n = 1).
Including 1 live birth.
Dandy‐Walker malformation and partial agenesis of the corpus callosum (n = 1).
Pallister Killian syndrome, an atypical chromosomal abnormality not screened for by CFTS or NIPT (n = 1).
Unknown cause of fetal death.
Chromosomally normal fetus.
Discussion
This study found that referral and invasive testing (with its potential for pregnancy loss) for women with isolated CPC and/or EIF remains an issue in an Australian obstetric setting. Women at low prior risk of aneuploidy, referred for isolated CPC and/or EIF, still made up approximately half of all referrals to genetic counselling and MFM for these soft signs even in 2014–2016. The only chromosomal or major structural anomaly found in this isolated/low‐risk group was an atypical chromosomal anomaly already known to be present in mother and sibling, reinforcing the lack of utility and potential harms of reporting and specialist referral for isolated CPC and EIF in low‐risk women.
In the most recent 3 years (2014–2016), approximately 0.5% of pregnancies at SGH and 0.35% at RHW were still being referred on due to these soft markers. This is despite both the Australian Association of Obstetrical and Gynaecological Ultrasonologists, and more recently ISUOG calling for these signs to be considered normal variants that do not necessitate discussion or investigation.1, 14
The number of women who were considered to be at low risk of a chromosomally abnormal fetus, referred for CPC and EIF at second‐trimester ultrasound, remained relatively constant at both hospitals from 2006 to 2016. However, the reason for being low risk changed, with more women being low risk due to (more accurate) prior aneuploidy screening in 2014–2016 rather than maternal age < 35.
Moreover, the introduction of NIPT in the last 5 years has seen greater levels of prenatal screening in the 2014–2016 era (10 women at SGH and 11 at the RHW).15 As such, this means that an even higher proportion of women were low risk by prior screening before the second‐trimester ultrasound. Despite the high detection rate and low false‐positive rate of NIPT, four women who received NIPT prior to morphology were referred to specialist services for isolated CPC and/or EIF.16 This suggests that while isolated CPC and/or EIF continue to be reported, anxiety of women and their healthcare providers will continue to result in potentially harmful referrals and invasive tests.
Despite significantly greater numbers of women undertaking prenatal screening, there was also no significant change in the proportion of isolated verses multiple soft markers referred. This suggests that referring radiology practices have not updated their reporting guidelines to appropriately remove the reporting of isolated CPC and/or EIF in low‐risk women.
The likelihood that a previously screened low‐risk patient with an isolated EIF or CPC would have a chromosomally abnormal fetus is extremely low. The 2013 Agathokleous et al.17 meta‐analysis recently reasserted isolated EIF as an unhelpful indicator for DS, and in a previous study of nearly 17000 women, no women with isolated EIF and a low‐risk prenatal screen had fetuses affected by DS.1 Similarly, in a study of 49,345 fetuses at morphology ultrasound spanning 12 years, no trisomy 18 fetus had an isolated CPC.18 These results correspond with this study in which no woman with an isolated sign went on to have fetuses affected by trisomy 21 or trisomy 18 (P = 0.002). Hence, these women with isolated signs in addition to a low‐risk prenatal screen need not be referred to specialist services. Ideally, they should not be reported in the first place, as even if labelled a ‘normal variant’, women may reasonably ask why they are being reported and fail to be reassured.
Disclosure of isolated soft markers EIF and CPC has known negative impact.1, 19, 20 Consequent invasive testing with the potential of harm, anxiety, conflict of personal values and clinical ambiguity is at odds with the premise of prenatal screening, to prevent suffering.21, 22, 23 The impact of reporting these soft markers has been highlighted by Bradley et al.3 who found women aged < 35 with isolated EIF are 2.5 times more likely to decide upon amniocentesis compared to women without. Additionally, the public health impact of unnecessary genetic counselling, maternal–fetal medicine services and invasive testing must be considered.4 Of the 102 low‐risk women with an isolated soft sign in this study, a substantial proportion underwent both genetic counselling and MFM scan, amniocentesis, NIPT and/or additional follow‐up ultrasounds. None of these women had a fetus with a major structural or screen‐detectable chromosomal abnormality.
Thus, this study suggests that despite advances in screening technology, the ambiguity that continues to surround the clinical significance of these soft markers has caused dilemmas in prenatal counselling and maternity care. Despite the option of NIPT, many women continue to choose to undergo amniocentesis after the disclosure of an isolated soft sign in order to ease their concern. This highlights the discrepancy between a perceived risk and actual risk, and emphasises that once a finding is reported, it may start a cascade of intervention potentially resulting in pregnancy loss.21, 22, 24
Strengths and limitations
This study provides contemporary Australian data about continued referral and consequences of reporting of isolated CPC and EIF. However, as a consequence of its retrospective design, there is no record of the women who had soft signs reported on morphology ultrasound but who were not referred to specialist services. Therefore, we cannot comment on what proportion of women had a soft sign reported but were able to be reassured by their primary maternity carer. It also excludes women who were offered referral but felt adequately reassured by initial counselling and did not pursue follow‐up. Consequently, an understanding of the total number of women who have these soft markers reported at second‐trimester ultrasound cannot be obtained.
This study is also limited by missing data, with pregnancy outcome data not available for all cases (likely due to birth in the private sector). Referral data in the years from 2009 to 2013 at RHW were also incomplete. Similarly, at SGH, a lack of paper records for 2006 to 2008 meant fewer referrals were available for audit. This importantly prevented a comparison of SGH and RHW in the 2011–2013 period and subsequent comparison with the most current epoch. However, despite some data being unavailable, as the study was conducted using referrals from 2 hospital sites, comparison across time periods was still possible. The comparison of SGH and RHW facilitates assessment of referral practice. Thus, it seeks to create convergence of reporting practices, minimise the potential for harm and reduce burden on genetic and fetal medicine services.6
Conclusion
There have been repeated calls to cease reporting isolated CPC and EIF in low‐risk women. However, a significant number of women are being referred to specialist services for these isolated soft signs, despite a low‐risk result at more accurate prior aneuploidy screening. The negative consequences of this continued disclosure are evident in this study. It is an undue cause of maternal anxiety, as well as an unnecessary burden on specialist fetal medicine and genetic services. The public health impact and potential for harm call for an improvement in the reporting practice of radiology services to reduce unnecessary intervention and alleviate the potential for ambiguity and distress.
Authorship statement
GP collected, analysed and interpreted the audit data and was a major contributor to the writing of this manuscript. AH supervised the study and was a major contributor to the study's design and methodology. AW played a supervisory role and contributed to the study's design. DR and AH contributed to data collection. All authors read and approved the final manuscript.
Funding
No funding information is provided.
Conflict of interest
The authors declare that they no competing interest and have not received financial support that may pose a conflict of interest.
Acknowledgements
Nil financial grants and funding.
Genetic referral search terms
Choroid plexus cysts
CPC
Plexus cyst
Choroid
Echogenic intracardiac focus
EIF
ICEF
IEF
EICF
Echogenic focus
Focus
Foci
Referral data extracted from Viewpoint and genetic databases
Referral reason
Mode of collection
Maternal ethnicity
Gestational age at referral
Soft signs reported
Combined first‐trimester screening result
Second‐trimester screening result
Non‐invasive prenatal testing result
Maternal–fetal medicine ultrasound findings
Pregnancy outcome data extracted from ObstetriX database
Maternal age
Country of birth
Weeks of pregnancy at booking visit
Gravidity
Parity
Plurality (number of fetuses this pregnancy)
Smoking prior to pregnancy (self‐reported)
Smoking at booking (self‐reported)
Alcohol consumption (self‐reported)
Illegal Drug Use (self‐reported)
Past medical history
Past obstetric and gynecological history
Past surgical history
Medication used during pregnancy
Antenatal admissions
Pregnancy complications
Mode of birth
Neonatal outcome
Neonatal complication
Gestational at birth
Gender
Birth weight
References
- 1.Bethune M. Management options for echogenic intracardiac focus and choroid plexus cysts: a review including Australian Association of Obstetrical and Gynaecological Ultrasonologists consensus statement. Australas Radiol 2007; 51(4): 324–9. [DOI] [PubMed] [Google Scholar]
- 2.Caughey AB, Lyell DJ, Filly RA, Washington AE, Norton ME. The impact of the use of the isolated echogenic intracardiac focus as a screen for Down syndrome in women under the age of 35 years. Am J Obstet Gynecol 2001; 185(5): 1021–7. [DOI] [PubMed] [Google Scholar]
- 3.Bradley KE, Santulli TS, Gregory KD, Herbert W, Carlson DE, Platt LD. An isolated intracardiac echogenic focus as a marker for aneuploidy. Am J Obstet Gynecol 2005; 192(6): 2021–6. [DOI] [PubMed] [Google Scholar]
- 4.Choong S, Meagher S. Management of choroid plexus cysts in the mid‐trimester fetus. Aust N Z J Obstet Gynaecol 1999; 39(1): 7–11. [DOI] [PubMed] [Google Scholar]
- 5.Norton ME. Follow‐up of sonographically detected soft markers for fetal aneuploidy. Semin Perinatol 2013; 37(5): 365–9. [DOI] [PubMed] [Google Scholar]
- 6.Bethune M. Time to reconsider our approach to echogenic intracardiac focus and choroid plexus cysts. Aust N Z J Obstet Gynaecol 2008; 48(2): 137–41. [DOI] [PubMed] [Google Scholar]
- 7.Wright D, Syngelaki A, Bradbury I, Akolekar R, Nicolaides KH. First‐trimester screening for trisomies 21, 18 and 13 by ultrasound and biochemical testing. Fetal Diagn Ther 2014; 35(2): 118–26. [DOI] [PubMed] [Google Scholar]
- 8.Reddy UM, Abuhamad AZ, Levine D, Saade GR; for the Fetal Imaging Workshop Invited P . Fetal imaging. J Ultrasound Med 2014; 33(5): 745–57. [DOI] [PubMed] [Google Scholar]
- 9.Walkinshaw S, Pilling D, Spriggs A. Isolated choroid plexus cysts—the need for routine offer of karyotyping. Prenat Diagn 1994; 14(8): 663–7. [DOI] [PubMed] [Google Scholar]
- 10.Bromley B, Lieberman E, Laboda L, Benacerraf BR. Echogenic intracardiac focus: a sonographic sign for fetal down syndrome. Obstet Gynecol 1995; 86(6): 998–1001. [DOI] [PubMed] [Google Scholar]
- 11.Sotiriadis A, Makrydimas G, Ioannidis JPA. Diagnostic performance of intracardiac echogenic foci for Down syndrome: a meta‐analysis. Obstet Gynecol 2003;101(5, Part 1):1009–16. [DOI] [PubMed] [Google Scholar]
- 12.Soothill PW, Lo YMD. Non‐invasive prenatal testing for chromosomal abnormality using maternal plasma DNA. London, UK: Royal College of Obstetricians and Gynaecologists; 2014. Contract No.: Scientific Impact Paper No. 15. [Google Scholar]
- 13.Whittle M. Ultrasonographic “soft markers” of fetal chromosomal defects. Detecting them may do more harm than good. BMJ 1997; 314(7085): 918. [DOI] [PMC free article] [PubMed] [Google Scholar]
- 14.Salomon LJ, Alfirevic Z, Audibert F, Kagan KO, Paladini D, Yeo G, et al. ISUOG updated consensus statement on the impact of cfDNA aneuploidy testing on screening policies and prenatal ultrasound practice. Ultrasound Obstet Gynecol 2017; 49(6): 815–6. [DOI] [PubMed] [Google Scholar]
- 15.Gil MM, Quezada MS, Revello R, Akolekar R, Nicolaides KH. Analysis of cell‐free DNA in maternal blood in screening for fetal aneuploidies: updated meta‐analysis. Ultrasound Obstet Gynecol 2015; 45(3): 249–66. [DOI] [PubMed] [Google Scholar]
- 16.McLennan A, Palma‐Dias R, da Silva Costa F, Meagher S, Nisbet DL, Scott F. Noninvasive prenatal testing in routine clinical practice – an audit of NIPT and combined first‐trimester screening in an unselected Australian population. Aust N Z J Obstet Gynaecol 2016; 56(1): 22–8. [DOI] [PubMed] [Google Scholar]
- 17.Agathokleous M, Chaveeva P, Poon LCY, Kosinski P, Nicolaides KH. Meta‐analysis of second‐trimester markers for trisomy 21. Ultrasound Obstet Gynecol 2013; 41(3): 247–61. [DOI] [PubMed] [Google Scholar]
- 18.Bronsteen R, Lee W, Vettraino IM, Huang RW, Comstock CH. Second‐trimester sonography and trisomy 18 – the significance of isolated choroid plexus cysts after an examination that includes the fetal hands. J Ultrasound Med 2004; 23(2): 241–5. [DOI] [PubMed] [Google Scholar]
- 19.Smith‐Bindman R, Hosmer W, Feldstein VA, Deeks JJ, Goldberg JD. Second‐trimester ultrasound to detect fetuses with down syndrome: a meta‐analysis. JAMA 2001; 285(8): 1044–55. [DOI] [PubMed] [Google Scholar]
- 20.Filly RA, Benacerraf BR, Nyberg DA, Hobbins JC. Choroid plexus cyst and echogenic intracardiac focus in women at low risk for chromosomal anomalies. J Ultrasound Med 2004; 23(4): 447–9. [DOI] [PubMed] [Google Scholar]
- 21.Åhman A, Runestam K, Sarkadi A. Did I really want to know this? Pregnant women's reaction to detection of a soft marker during ultrasound screening. Patient Educ Couns 2010; 81(1): 87–93. [DOI] [PubMed] [Google Scholar]
- 22.Bar‐Oz B, Levichek Z, Moretti ME, Mah C, Andreou S, Koren G. Pregnancy outcome following rubella vaccination: a prospective controlled study. Am J Med Genet 2004; 130A(1): 52–4. [DOI] [PubMed] [Google Scholar]
- 23.Edvardsson K, Lalos A, Åhman A, Small R, Graner MDPS, Mogren I. Increasing possibilities – Increasing dilemmas: a qualitative study of Swedish midwives’ experiences of ultrasound use in pregnancy. Midwifery 2016; 42: 46–53. [DOI] [PubMed] [Google Scholar]
- 24.Nicolaides KH. The 11–13 + 6 week scan. London: The Fetal Medicine Foundation; 2004. [Google Scholar]