Abstract
The authors sought to evaluate the prevalence of hypertension (HTN) in patients with sleep apnea (SA) who had normal kidney function and in patients with SA and chronic kidney disease (CKD). It has not been determined whether there is an effect of interplay of SA and CKD on the prevalence of HTN. In this study, the diagnosis of CKD was established based on the glomerular filtration rate and the presence of proteinuria. SA and HTN were diagnosed based on International Classification of Diseases, Ninth Revision coding, Current Procedural Terminology coding, and medication use. Using the database of a large integrated health system, 434,388 patients aged 18 years and older with 2 or more years of continuous enrollment during January 2002 to December 2004 were analyzed. The HTN rate with SA alone was 51%, compared with 70.2% with SA and CKD. The overall prevalence of HTN was 28% in patients without CKD or SA. The prevalence ratio for HTN was 1.36 (95% confidence interval, 1.33–1.39) more prevalent in patients with SA and CKD compared with patients with SA without CKD. The high prevalence of HTN in patients with SA and CKD suggests the need for evaluation of SA in patients with concurrent HTN and CKD.
Sleep apnea (SA) is a possible etiology for secondary hypertension (HTN) that may be under‐diagnosed. In patients with both SA and chronic kidney disease (CKD), HTN may play a prominent role in the morbidity associated with both disease processes. The Seventh Report of the Joint National Committee on Prevention, Detection, Evaluation, and Treatment of High Blood Pressure (JNC 7)1 recommends screening for SA in unexplained cases of HTN. HTN has been well described in association with SA; a relationship between SA severity and blood pressure elevation has been reported.2, 3, 4, 5 Estimated rates of HTN in patients with SA are 2 to 5 times greater than those observed in the general population.6 In addition, SA has also been associated with increases in cardiovascular disease, cerebrovascular disease, and mortality.7, 8, 9
The Institute of Medicine estimates that 50 to 70 million persons in the United States may experience sleep disorders; an indefinite number of these patients may have SA.10 Given the close association between SA and HTN, clinicians may be under‐screening for SA in the hypertensive population. A proportion of the hypertensive population may have underlying SA that is amenable to treatment.
The overall prevalence of HTN according to data from the Third National Health and Nutrition Examination Survey (NHANES III)11 is approximately 24%. In patients with CKD, the prevalence of HTN has been reported to be 8 times greater when compared with patients without CKD.12
Using the database of a large integrated health plan, we investigated the prevalence of HTN in patients with SA who had normal kidney function and in patients with SA and CKD. We also sought to evaluate the overall prevalence of HTN in patients with normal kidney function and different stages of CKD. All patients studied were part of the database of the same health plan. We were able to obtain information regarding renal function, medications, and medical coding on more than 400,000 patients. If HTN is prevalent in SA and even more prevalent in SA with CKD, an early diagnosis of SA following recognition of increased risk might help clinicians treat HTN.
METHODS
The study protocol was reviewed and approved by the institutional review board of Kaiser Permanente Southern California. The source data for this study were obtained from clinical and administrative databases for Kaiser Permanente Southern California, which is an integrated health system serving more than 3 million members of diverse race/ethnicity at 11 medical centers and numerous satellite clinics. For inclusion in the analysis, members had to be aged 18 years or older with continuous membership for 2 or more years (to allow time for glomerular filtration rate [GFR] measurement and SA diagnosis) in the health system during January 1, 2002, to December 31, 2004. All participants had to have serum creatinine levels documented to estimate renal function. Renal function was defined and classified based on GFR using the modified Modification of Diet in Renal Disease (MDRD) equation based on serum creatinine level, age, sex, and African American compared with non‐African American race.13 Baseline GFR ranges >90 (CKD stage 1 if proteinuria14), 60 to 89 (CKD stage 2), 30 to 59 (CKD stage 3), and 15 to 29 mL/min/1.73 m2 (CKD stage 4) were examined.
Stable‐state GFR was estimated based on an algorithm that examined GFR patterns and mimicked clinical reasoning when determining a patient's kidney function. Starting from January 1, 2002, serial serum creatinine values were examined. Serum creatinine values measured ≥90 days apart were used to avoid defining a “stable GFR” during acute renal failure.14 Two or 3 GFRs were used to determine the presence of stable GFR. Urinary protein excretion was used as a marker of kidney disease to further categorize CKD stages 1 and 2. Thus, elderly patients who may have a GFR <90 mL/min/1.73 m2 would have to have proteinuria as a marker of kidney damage to be classified as having CKD. Proteinuria was determined when a second abnormal urine test result revealed a quantification of either protein‐to‐creatinine ratio >200, albumin‐to‐creatinine ratio >30, 24‐hour protein >300 mg, or 24‐hour albumin >30 mg. Patients without CKD were defined by a GFR ≥90 mL/min/1.73 m2 and no evidence of proteinuria. Patients without a documented serum creatinine value were excluded from analysis.
Although the modified MDRD equation was not validated in patients older than 65 years, we included and calculated GFR in patients older than 65 years. This may have resulted in a higher percentage of older patients being classified as having stage 2 CKD, given the fact that elderly patients would have a higher likelihood of a calculated GFR <90 mL/min/1.73 m2. Patients with stage 1 CKD required documented proteinuria for inclusion. We felt that this would dilute the pool of hypertensive persons, given the higher prevalence of primary HTN with advancing age, and make the association with SA stronger if a relationship did exist.
HTN was determined using a combination of International Classification of Diseases, Ninth Revision (ICD‐9) codes for a diagnosis of HTN and the use of antihypertensive medications. This method of HTN identification has a positive predictive value of >90% based on previous validation, including chart review. SA was identified using inpatient and outpatient ICD‐9 codes for SA (central or obstructive, 780.51, 780.53, 780.57) or dispensation of continuous positive airway pressure (CPAP) or bilevel positive airway pressure devices. We were unable to distinguish obstructive from central SA using these electronic codes. To validate the accuracy of the coding, a physician chart review of 50 patients at one medical center demonstrated that 44 of 50 patients (88% positive predictive value) had either a positive sleep study or written evidence of CPAP use for treatment of SA. The chart review suggested that physicians coded for SA when sufficient evidence was present, such as positive sleep study results or CPAP being used for treatment of SA. SA may have been overdiagnosed if CPAP was being used for other disorders instead of SA (eg, neuromuscular disease).
Period prevalence rates were estimated for HTN, SA, and both conditions by CKD stages. Prevalences were compared by chi‐squared tests. Prevalence ratios and 95% confidence intervals were determined. Statistical tests were performed using Stata 9.2 (StataCorp LP, College Station, TX).
RESULTS
A total of 434,388 patients met the inclusion criteria for our study analysis. Our population had a broad range of ethnic representation, with white/non‐Hispanic persons accounting for the largest proportion of our study population (43%). This was followed by Hispanic persons (35%), Asian and Pacific Islanders (10%), African Americans (9%), persons of ≥2 races (2.5%), and American Indian and Alaskan Natives (0.5%). Women accounted for 54% of the study population.
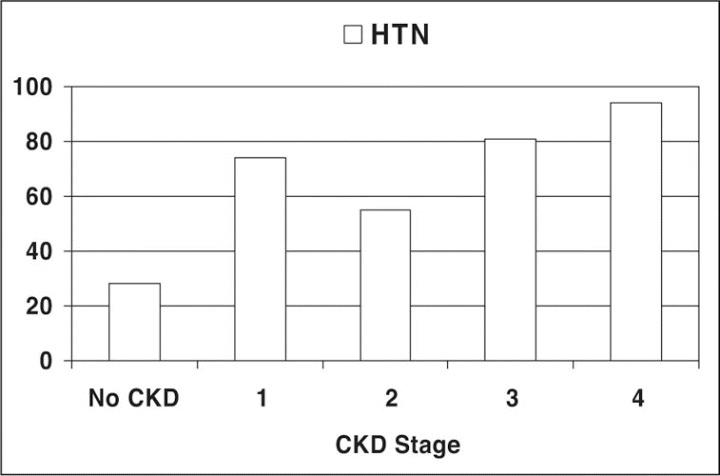
Table I summarizes the total number of patients in each CKD class and prevalence of HTN, SA, HTN with SA, and HTN if SA was present by each CKD class. HTN was common in patients with SA, occurring at a rate of 51%, significantly greater than the 28% observed in our general population without SA (P<.001). Overall, the highest rates of HTN occurred in patients with the lowest GFR (15–29 mL/min/1.73 m2), reaching 94% in CKD stage 4 (Figure 1). Proteinuric (CKD stage 1) patients with a GFR >90 also had a 74% rate of HTN compared with 28% without CKD (P<.001) (Figure 1).
Table I.
Risk of Hypertension by CKD Stage in Patients With Sleep Apneaa
| CKD Stage | Prevalence Ratio | 95% Confidence Interval |
|---|---|---|
| 0 (normal) | 1 | ‐‐ |
| 1 | 1.7 | 1.63–1.80 |
| 2 | 1.3 | 1.26–1.32 |
| 3 | 1.7 | 1.65–1.74 |
| 4 | 2.0 | 1.70–2.26 |
| 2–4 | 1.4 | 1.34–1.40 |
| aPrevalence ratios: prevalence of hypertension at each chronic kidney disease (CKD) stage vs prevalence of hypertension at normal kidney function. | ||
Figure 1.

Prevalence of hypertension (HTN) by chronic kidney disease (CKD) stages.
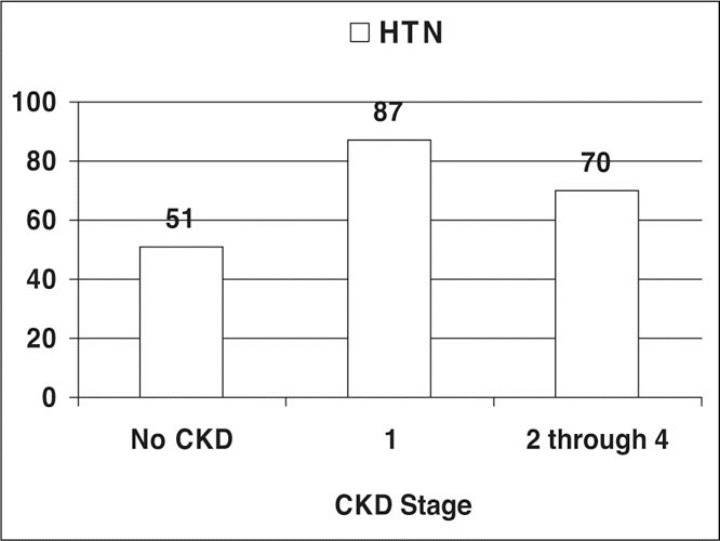
Absolute rates of HTN in patients with SA by CKD stage are shown in Figure 2. Patients with SA and stage 1 CKD had an HTN prevalence of 87%. In patients with both SA and CKD stages 2 through 4 combined (ie, GFR 15–89 mL/min/1.73 m2), the prevalence of HTN was 70.2% (Figure 3). Patients with SA and stage 1 CKD had an HTN prevalence of 87%. Prevalence ratios for HTN by each CKD stage vs normal kidney function among patients with SA by CKD stage compared with those without CKD are shown in Table I. The risk of HTN in the presence of SA increased from higher GFR in CKD stage 2 to lower GFR in CKD stage 4 (rate ratio 2.0). Again, patients with SA and proteinuria with normal GFR values (ie, stage 1 CKD) more commonly had HTN (rate ratio 1.7;95% confidence interval [CI], 1.63–1.80). The overall risk of HTN in patients with SA and CKD stages 2 through 4 (ie, GFR 15–89 mL/min/1.73 m2) was 1.36 (95% CI, 1.33–1.39) compared with those without CKD.
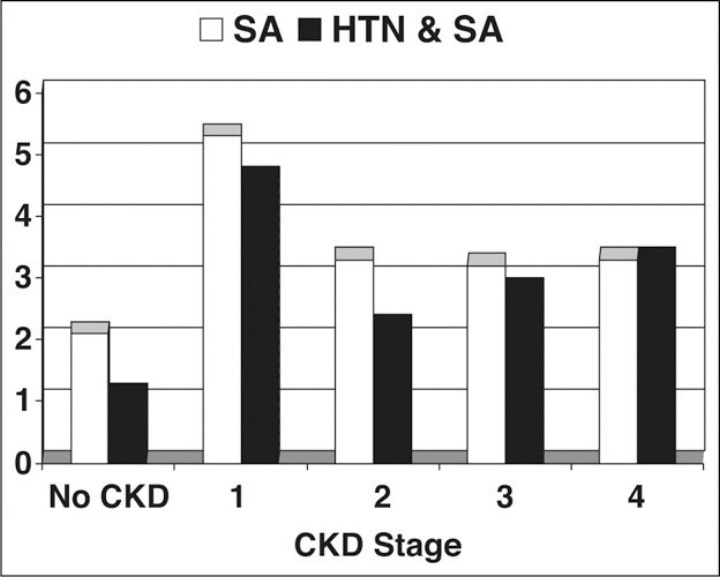
Figure 2.

Rate of sleep apnea (SA) alone and SA with hypertension (HTN) by chronic kidney disease (CKD) stages.
Figure 3.

Prevalence of hypertension (HTN) in sleep apnea (SA) patients by chronic kidney disease (CKD) stages.
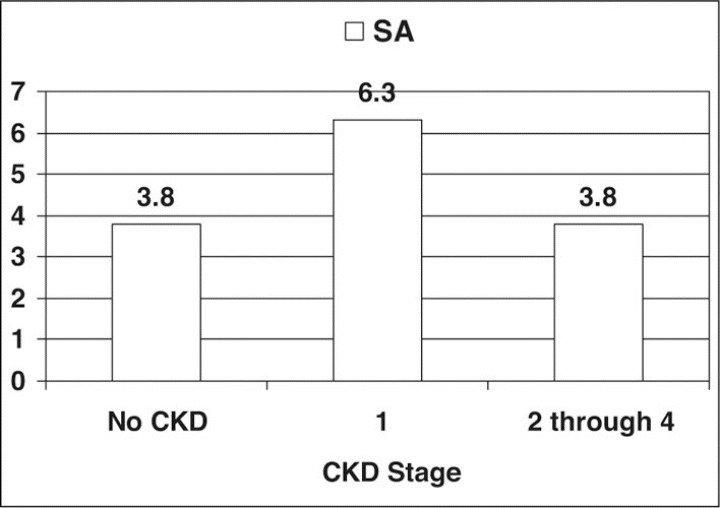
Figure 4 shows the prevalence of SA in patients with HTN by CKD stage. Table II compares the prevalence ratios for SA in patients with HTN across different CKD stages. We found little difference in risk for SA in patients with CKD compared with patients with normal kidney function. The prevalence ratio remained at approximately 1.0 throughout CKD stages 2 through 4. Patients with proteinuria and normal GFR values (stage 1 CKD) compared with those who did not have proteinuria, however, demonstrated a prevalence ratio of 1.6 (95% CI, 1.44–1.87) for a diagnosis of SA.
Figure 4.

Sleep apnea (SA) rates in patients with hypertension (HTN) by chronic kidney disease (CKD) stages.
Table II.
Risk of Sleep Apnea by CKD Stage in Patients With Hypertension
| CKD Stage | Prevalence Ratio | 95% Confidence Interval |
|---|---|---|
| 0 (Normal) | 1 | ‐‐ |
| 1 | 1.6 | 1.44–1.87 |
| 2 | 1.0 | 0.99–1.07 |
| 3 | 0.9 | 0.84–0.94 |
| 4 | 0.9 | 0.74–1.11 |
| 2–4 | 1.0 | 0.95–1.03 |
| aPrevalence ratio: prevalence of sleep apnea at each chronic kidney disease (CKD) stage vs prevalence of sleep apnea at normal kidney function. | ||
DISCUSSION
This study demonstrates a disproportionately high rate of HTN in patients with SA and CKD compared with those who had SA and normal kidney function. This suggests a possible interplay or additive effect of SA and CKD with HTN. A higher prevalence of HTN is reported in patients with CKD,12 and our data similarly reflect this association, raising the question of whether the higher prevalence of HTN is due entirely to CKD instead of SA. In our study evaluating SA patients with ≥2 years of continuous enrollment, the rate of SA was similar in both CKD and non‐CKD patients (Figure 4). When HTN was evaluated in patients with SA across different CKD stages, however, HTN was greater in patients with SA and CKD compared with those with SA and normal kidney function.
Admittedly, the data may not reflect a true prevalence but rather a reported prevalence of SA, which may introduce a selection bias among patients with CKD. Nevertheless, our findings suggest that a diagnosis of SA should be considered a potentially important comorbid condition in patients with HTN and CKD. HTN and CKD are both easily recognized conditions; they are often diagnosed as part of routine health care.
SA is associated with increased cerebrovascular disease, cardiovascular disease, and endocrine abnormalities.7, 8, 9, 15 Psychosocial complications are also a common manifestation.16 Treatment of SA may prevent some of these complications and improve blood pressure as well as cognitive function and quality of life.17, 18
Although the rates of SA itself were unchanged in the HTN patients with and without CKD stages 2 through 4, the overall prevalence of SA with concurrent HTN was higher in CKD patients. Our study looked at a prevalence rate where patients had to be continuously enrolled in the health plan for at least 2 of the entire 3‐year observation period for inclusion in the analysis. Given the higher mortality described in SA and CKD patients,7, 19 the prevalence rates we observed may have been less than a true point prevalence rate obtained from a cross‐sectional analysis of the population. Thus, the higher rates of SA and HTN in the earlier stages of CKD may reflect the fact that these patients are less likely to progress to later stages of CKD because of increased mortality. The HTN and SA patients in advanced stages of CKD might actually represent a group reduced to SA survivors. Nevertheless, crude rates of clinically diagnosed HTN in patients with SA were still significantly higher in all CKD stages (Figure 1) than in patients without CKD.
Not surprisingly, stage 4 CKD patients with SA had the highest rate of HTN; twice the rate of the non‐CKD patients with SA. This is consistent with the high prevalence of HTN in end‐stage renal disease; the rate increases with worsening renal function. An equal rate of HTN, however, was observed in patients with a GFR 30 to 59 mL/min/1.73 m2, as in patients with a normal GFR and proteinuria. Proteinuria and SA have been described in past studies, suggesting that proteinuria may be a manifestation of SA.20, 21 Case reports have demonstrated improvement of proteinuria after treatment for SA.22 Admittedly, this is not a universally accepted premise; others have reported no such correlation between SA and proteinuria.23, 24
HTN rates in patients with normal kidney function (28%) were comparable to the 24% rate reported in the NHANES III study.11 Our population may represent a different risk group compared with the NHANES III population, because in our analysis, only patients with clinically documented GFRs were studied. Therefore, our patients may be more likely to have comorbid illnesses such as HTN, since serum creatinine measurements are not routinely performed in all patients. We were also able to show HTN prevalence within different CKD stages in more than 190,000 patients, which exceeds the number of CKD patients in the NHANES III analysis. Our rate of HTN overall in CKD stages 1 through 4 was 60%; HTN rates were significantly higher in patients with every class of CKD compared with patients without evidence of CKD.
This study had several limitations that may impact the clinical relevance of the findings. This is a population‐level, observational study evaluating the prevalence of HTN and SA in patients with various ranges of renal function. We therefore are not able to demonstrate causality in any way. In addition, adjustments were not made for age and sex, diabetes mellitus, congestive heart failure, and other comorbidities such as obesity, which are related to HTN, SA, and CKD. Subgroup analyses were not performed to evaluate the contribution or significance of these conditions. We reported population rates of these conditions based on physician practice patterns, diagnosis coding, medication dispensation, and laboratory values within a large, integrated health system. The data may thus better represent clinical practice rather than true prevalence.
CONCLUSIONS
The rate of HTN is high in SA patients with and without CKD. SA is an established cause of HTN and may play an even more prominent role in patients with CKD. Based on these observations, a diagnosis of SA should be considered in patients with HTN and CKD.
References
- 1.Seventh report of the Joint National Committee on Prevention, Detection, Evaluation, and Treatment of High Blood Pressure. Hypertension. 2003;42(6):1206–1252. [DOI] [PubMed] [Google Scholar]
- 2.Lavie P, Herer P, Hoffstein V. Obstructive sleep apnoea syndrome as a risk factor for hypertension: population study. BMJ. 2000;320(7233):479–482. [DOI] [PMC free article] [PubMed] [Google Scholar]
- 3.Peppard PE, Young T, Palta M, et al.Prospective study of the association between sleep‐disordered breathing and hypertension. N Engl J Med. 2000;342(19):1378–1384. [DOI] [PubMed] [Google Scholar]
- 4.Young T, Peppard P, Palta M, et al.Population‐based study of sleep‐disordered breathing as a risk factor for hypertension. Arch Intern Med. 1997;157(15):1746–1752. [PubMed] [Google Scholar]
- 5.Nieto FJ, Young TB, Lind BK, et al.Association of sleep‐disordered breathing, sleep apnea, and hypertension in a large community‐based study. Sleep Heart Health Study. JAMA. 2000;283(14):1829–1836. [DOI] [PubMed] [Google Scholar]
- 6.Hla KM, Young TB, Bidwell T, et al.Sleep apnea and hypertension. A population‐based study. Ann Intern Med. 1994;120(5):382–388. [DOI] [PubMed] [Google Scholar]
- 7.Yaggi HK, Concato J, Kernan WN, et al.Obstructive sleep apnea as a risk factor for stroke and death. N Engl J Med. 2005;353(19):2034–2041. [DOI] [PubMed] [Google Scholar]
- 8.Gami AS, Pressman G, Caples SM, et al.Association of atrial fibrillation and obstructive sleep apnea. Circulation. 2004;110(4):364–367. [DOI] [PubMed] [Google Scholar]
- 9.Kraiczi H, Peker Y, Caidahl K, et al.Blood pressure, cardiac structure and severity of obstructive sleep apnea in a sleep clinic population. J Hypertens. 2001;19(11):2071–2078. [DOI] [PubMed] [Google Scholar]
- 10.Colten HR, Altevogt BM, eds. Sleep Disorders and Sleep Deprivation: An Unmet Public Health Problem. Washington, DC: Institute of Medicine of the National Academies; 2006. [PubMed] [Google Scholar]
- 11.Burt VL, Whelton P, Roccella EJ, et al.Prevalence of hypertension in the US adult population. Results from the Third National Health and Nutrition Examination Survey, 1988–1991. Hypertension. 1995;25(3):305–313. [DOI] [PubMed] [Google Scholar]
- 12.Coresh J, Wei GL, McQuillan G, et al.Prevalence of high blood pressure and elevated serum creatinine level in the United States: findings from the third National Health and Nutrition Examination Survey (1988–1994). Arch Intern Med. 2001;161(9):1207–1216. [DOI] [PubMed] [Google Scholar]
- 13.Levey AS, Bosch JP, Lewis JB, et al.A more accurate method to estimate glomerular filtration rate from serum creatinine: a new prediction equation. Modification of Diet in Renal Disease Study Group . Ann Intern Med. 1999;130(6):461–470. [DOI] [PubMed] [Google Scholar]
- 14.K/DOQI clinical practice guidelines for chronic kidney disease: evaluation, classification, and stratification. Am J Kidney Dis. 2002;39(2 suppl 1):S1–S266. [PubMed] [Google Scholar]
- 15.Punjabi NM, Shahar E, Redline S, et al.Sleep‐disordered breathing, glucose intolerance, and insulin resistance: the Sleep Heart Health Study. Am J Epidemiol. 2004;160(6):521–530. [DOI] [PubMed] [Google Scholar]
- 16.Sateia MJ. Neuropsychological impairment and quality of life in obstructive sleep apnea. Clin Chest Med. 2003;24(2):249–259. [DOI] [PubMed] [Google Scholar]
- 17.Chin K, Nakamura T, Takahashi K, et al.Falls in blood pressure in patients with obstructive sleep apnoea after long‐term nasal continuous positive airway pressure treatment. J Hypertens. 2006;24(10):2091–2099. [DOI] [PubMed] [Google Scholar]
- 18.Bardwell WA, Ancoli‐Israel S, Berry CC, et al.Neuropsychological effects of one‐week continuous positive airway pressure treatment in patients with obstructive sleep apnea: a placebo‐controlled study. Psychosom Med. 2001;63(4):579–584. [DOI] [PubMed] [Google Scholar]
- 19.Go AS, Chertow GM, Fan D, et al.Chronic kidney disease and the risks of death, cardiovascular events, and hospitalization. N Engl J Med. 2004;351(13):1296–1305. [DOI] [PubMed] [Google Scholar]
- 20.Chaudhary BA, Sklar AH, Chaudhary TK, et al.Sleep apnea, proteinuria, and nephrotic syndrome. Sleep. 1988;11(1):69–74. [DOI] [PubMed] [Google Scholar]
- 21.Chaudhary BA, Rehman OU, Brown TM. Proteinuria in patients with sleep apnea. J Fam Pract. 1995;40(2):139–141. [PubMed] [Google Scholar]
- 22.Sklar AH, Chaudhary BA. Reversible proteinuria in obstructive sleep apnea syndrome. Arch Intern Med. 1988;148(1):87–89. [PubMed] [Google Scholar]
- 23.Casserly LF, Chow N, Ali S, et al.Proteinuria in obstructive sleep apnea. Kidney Int. 2001;60(4):1484–1489. [DOI] [PubMed] [Google Scholar]
- 24.Iliescu EA, Lam M, Pater J, et al.Do patients with obstructive sleep apnea have clinically significant proteinuria? Clin Nephrol. 2001;55(3):196–204. [PubMed] [Google Scholar]


