

Abstract
Dermatomyositis (DM) is a systemic idiopathic inflammatory disease affecting skeletal muscle and skin, clinically characterized by symmetrical proximal muscle weakness and typical skin lesions. Recently, myositis‐specific autoantibodies (MSA) became of utmost importance because they strongly correlate with distinct clinical manifestations and prognosis. Antibodies against transcription intermediary factor 1γ (TIF‐1γ) are frequently associated with increased risk of malignancy, a specific cutaneous phenotype and limited response to therapy in adult DM patients. Anti‐Mi‐2 autoantibodies, in contrast, are typically associated with classic DM rashes, prominent skeletal muscle weakness, better therapeutic response and prognosis, and less frequently with cancer. Nevertheless, the sensitivity of autoantibody testing is only moderate, and alternative reliable methods for DM patient stratification and prediction of cancer risk are needed. To further investigate these clinically distinct DM subgroups, we herein analyzed 30 DM patients (n = 15 Mi‐2+ and n = 15 TIF‐1 γ+) and n = 8 non‐disease controls (NDC). We demonstrate that the NanoString technology can be used as a very sensitive method to clearly differentiate these two clinically distinct DM subgroups. Using the nCounter PanCancer Immune Profiling Panel™, we identified a set of significantly dysregulated genes in anti‐TIF‐1γ+ patient muscle biopsies including VEGFA, DDX58, IFNB1, CCL5, IL12RB2, and CD84. Investigation of type I IFN‐regulated transcripts revealed a striking type I interferon signature in anti‐Mi‐2+ patient biopsies. Our results help to stratify both subgroups and predict, which DM patients require an intensified diagnostic procedure and might have a poorer outcome. Potentially, this could also have implications for the therapeutic approach.
Keywords: dermatomyositis, Mi‐2, myositis‐specific antibody, NanoString, skeletal muscle, TIF‐1γ
Dermatomyositis (DM) is a systemic idiopathic inflammatory disease affecting skeletal muscle and skin, clinically characterized by symmetrical proximal muscle weakness and typical skin lesions. Genetic profiling of anti‐TIF‐1γ+ and ‐Mi‐2+ dermatomyositis patients’ skeletal muscle biopsies revealed subgroup‐specific signatures, which helps to stratify both subgroups and predict, which DM patients require an intensified diagnostic procedure and might have a poorer outcome.

1. INTRODUCTION
Dermatomyositis (DM) is a rare idiopathic inflammatory disease of the skeletal muscle and skin with heterogeneous clinical and morphological presentation. Histomorphologically, inflammatory infiltrates of various immune cells, perifascicular atrophy, specific injury to capillaries and perifascicular myofibers, and MHC‐I upregulation are common in DM (1, 2). Clinically, the presence of muscle weakness is mostly associated with skin symptoms like Gottron's papules, Gottron's sign, and/or the heliotrope eruption (2, 3). New biomarkers, such as DM‐specific autoantibodies (anti‐Mi‐2, anti‐MDA5, anti‐TIF‐1γ, anti‐NXP2, and anti‐SAE) correlate with distinct clinical phenotypes with respect to organ involvement and malignancy in cancer‐associated myositis (CAM, (4)). The association of anti‐TIF‐1γ antibody and increased risk of cancer in adult DM has recently been highlighted (4, 5) and characteristic cutaneous findings, such as palmar hyperkeratotic papules, psoriasis‐like lesions, and hypopigmented and telangiectatic "red‐on‐white" patches have been described (6). TIF‐1γ (TRIM33) plays an important role in carcinogenesis and cell differentiation (7, 8). Cancer development, including various entities e.g. breast, colorectal and ovarian cancer, as well as Hodgkin's lymphoma (9, 10, 11, 12) may be recognized years before or after diagnosis of DM (13). Anti‐TIF‐1γ‐associated DM typically presents with proximal limb weakness accompanied by severe skin changes, moderately elevated CK levels, and absence of interstitial lung disease (ILD) (7). In muscle biopsies, complement (C5b‐9) deposition on intramuscular capillaries has been shown to be associated with malignancy (1, 5). Proximal muscle weakness may also be seen in anti‐Mi‐2+ DM patients in which classical Gottron's papules or heliotrope rash are more common and CK levels are usually high, whereas other organ involvement is generally absent. Histomorphologically, anti‐Mi‐2‐associated DM typically demonstrates characteristic perifascicular atrophy, necrotic myofibers, prominent inflammatory infiltrates, and MHC‐I expression on perifascicular fibers. Anti‐Mi‐2+ DM patients respond well to standard treatment, including corticosteroids and rituximab and show a better overall prognosis (14, 15, 16).
An autoantibody‐based distinction of these two clinically distinct subsets of adult DM is important for further patient stratification and follow‐up. Nevertheless, the detection of autoantibodies in DM is not well‐standardized (2, 4, 17). There are no international reference samples available so far, whereas different therapeutic regimen such as administration of B‐cell directed therapy (rituximab), plasmapheresis, or administration of intravenous immunoglobulins may influence the concentration of autoantibodies and subsequently decreased disease activity (2). Therefore, additional robust and reliable methods are needed. Here, we utilize the NanoString‐based nCounter PanCancer Immune Profiling Panel™ (18), quantifying the expression levels of 770 genes related to immune‐oncological signaling pathways and cell types to characterize muscle biopsies from DM patients harboring anti‐TIF‐1γ and anti‐Mi‐2 autoantibodies, to see if any DM‐specific subgroups may be differentiated using an alternative molecular technique. Special interest was given to these two DM subgroups as prognosis, association with cancer and treatment response differ substantially. In addition, we wanted to i) investigate if cancer association in DM may be detected by this technique and ii) further analyze subgroup‐specific expression profiles to better understand the pathogenesis and potential risk factors for cancer development.
2. METHODS
2.1. Patient cohort
The study cohort and sample size as well as the experimental design, analysis workflow, diagnosis, and autoantibody status are displayed in Figure 1A and Table S1. The available clinical and demographic information of all (n = 38) patients enrolled in this study are listed in Table S1. Skeletal muscle biopsies were analyzed from patients diagnosed (according to EULAR classification criteria) with DM and positive autoantibodies, against Mi‐2 (n = 15, using n = 6 for NanoString, n = 11 for qPCR, and n = 7 for histology) or TIF‐1γ (n = 15, using n = 6 for NanoString, n = 9 for qPCR, and n = 7 for histology). Cancer‐associated myositis (CAM) was present in n = 9 (60%) anti‐TIF‐1γ+ and n = 3 (20%) anti‐Mi‐2+ patients. CAM was defined as neoplasms occurring within 2 years before or no more than 3 years after myositis onset as previously described (2, 5). Patients that suffered from cancer more than 2 years before or more than 3 years after DM diagnosis were defined as CAM‐. Patients labeled “no cancer” never suffered from cancer at all.
FIGURE 1.
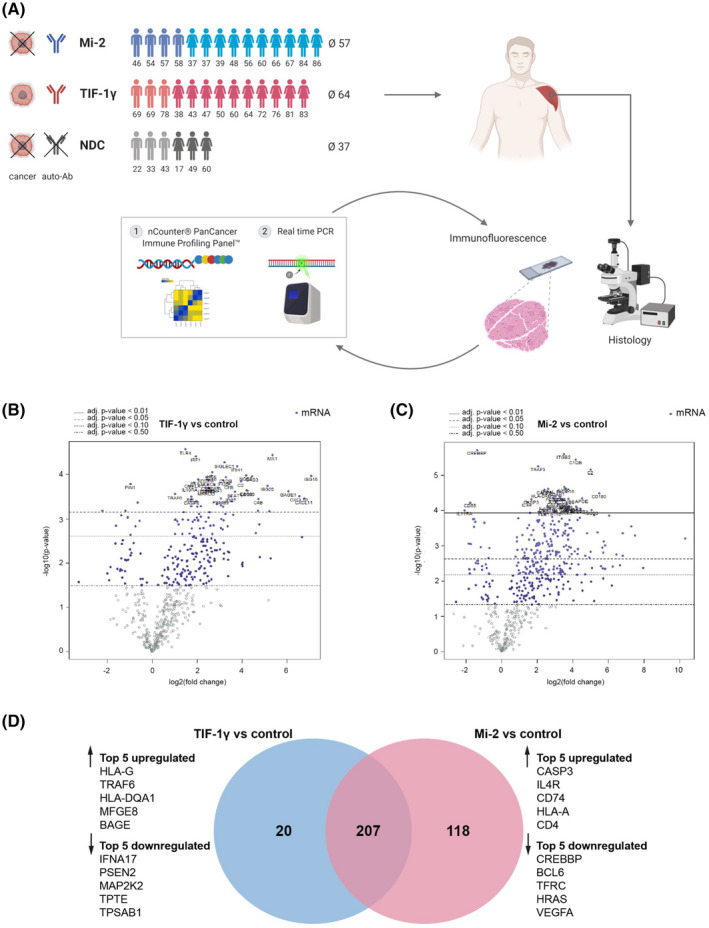
Genetic profiling of anti‐TIF‐1γ+ and ‐Mi‐2+ dermatomyositis patients’ skeletal muscle biopsies revealed subgroup‐specific signatures. (A) Experimental design and analysis workflow of the project. (B) Differential gene expression analysis from anti‐TIF‐1γ+ patients (n = 6) and non‐diseased controls (n = 2). (C) Differential gene expression analysis from anti‐Mi‐2+ patients (n = 6) and non‐diseased controls (n = 2). (D) Venn diagram comparing the differentially expressed genes (in skeletal muscle tissues) of anti‐TIF‐1γ+ patients vs. non‐diseased controls and anti‐Mi‐2+ patients vs. non‐diseased controls, identifying 207 commonly dysregulated genes, 20 TIF‐1γ subgroup‐specific genes and 118 Mi‐2 subgroup‐specific genes. The top 5 up‐ and downregulated genes specific for each subgroup are highlighted
Additionally, we investigated skeletal muscle biopsies (n = 8, using n = 2 for NanoString, n = 3 for qPCR and n = 6 for histology) from patients with nonspecific complaints in the context of “fatigue‐like” symptoms, without clinical muscle weakness, with the absence of any morphologic abnormalities on skeletal muscle biopsies, of elevated creatine kinase (CK) levels, or laboratory evidence of any systemic inflammation serving as non‐diseased controls (NDC).
2.2. Standard protocol approvals and patient consents
Informed consent was obtained from all patients at each institution involved. Procedures were approved by the official ethical standards committee (EA2/163/17) at the Charité‐Universitätsmedizin Berlin.
2.3. Histologic, immunohistochemical, and immunofluorescence procedures
Histological stains were performed on 7‐μm cryostat muscle sections according to standard procedures. Immunohistochemical and double immunofluorescence stains with antibodies against laminin‐α5 and VEGF, nMyHc and VEGF, DDX58/RIG‐1 and CD68, MSTR1R/RON and CD31 as well as pRON and nMyHc, PDGFRβ, MHC class II, CD8, CD206, and CD4 were performed as previously described (19, 20). Primary antibodies are listed in Table S2.
2.4. RNA isolation and cDNA transcription
Total RNA was isolated from muscle specimens using TRIzol™ Reagent (Thermo Fisher Scientific, Germany) as previously described (20). Complementary DNA (cDNA) was synthesized using the High‐Capacity cDNA Archive Kit (Applied Biosystems, Foster City, CA, USA) according to the manufacturer's protocol.
2.5. Quantitative real‐time PCR (qPCR)
We performed quantitative real‐time PCR (qPCR) measuring the gene expression profile of VEGF, DDX58, and MSTR1 using the following TaqMan probes (ThermoFisher Scientific): Hs00900055_m1 (VEGFA), Hs00204833_m1 (RIG1/DDX58), Hs00899920_m1 (MST1R), and Hs99999905_m1 (GAPDH). Glyceraldehyde 3‐phosphate dehydrogenase (GAPDH) was included as an internal control to normalize the expression of the target genes. qPCR analysis was performed using an Applied Biosystems™ QuantStudio™ 6 Flex Real‐Time PCR System (ThermoFischer, Waltham, MA; USA) with the following thermal profile: 20 s at 95°C, followed by 40 cycles of 1 s at 95°C and 20 s at 60°C.
2.6. NanoString analysis
We analyzed the expression of 770 genes (including 40 reference genes) related to the immune response in cancer using the nCounter PanCancer Immune Profiling Panel™ (human) (Nanostring, XT‐CSO‐HIP1‐12). 200–500 ng of total RNA was used as input and sample hybridization was performed according to the manufacturer's instructions. Sample detection and analysis were completed on a nCounter® Digital Analyzer. Raw data processing, quality control, and normalization were performed using the nSolver™ 4.0 analysis software. Quality control (QC) and normalization were performed with an imaging QC of >75% field of view registration, binding density QC within 0.1‐2.25 range, positive control linearity QC of R2 above 0.95, and positive control limit of detection set as 0.5 fM positive control above 2 standard deviations above the mean of the negative controls. Normalization to housekeeping genes, of which genes below 100 were excluded, and differential expression analysis were completed using the Advanced Analysis software plugin (version 2.0.115). For differential expression analysis, a log2 fold change of ≤−1 or ≥1 as well as a p‐value of ≤0.05 were applied as cutoffs. For the first analysis, gene expression measurements from anti‐Mi‐2+ patient muscle biopsies (n = 6) and anti‐TIF‐1γ+ patients’ muscle biopsies (n = 6) were normalized to healthy non‐diseased control samples (NDC, n = 2) before being compared to each other. For the second analysis, anti‐Mi‐2+ patients’ muscle biopsies (n = 6) were directly compared to anti‐TIF‐1γ+ patients’ biopsies (n = 6).
2.7. Evaluation of NanoString results
To further analyze the associated pathways of the differentially expressed genes, functional enrichment analysis was performed using Enrichr (21, 22) for Gene Ontology (GO) to identify the annotated sets of genes based on the biological processes in which they participate.
2.8. Statistical analysis
Non‐parametric Kruskal‐Wallis one‐way analysis of variance followed by multiple comparison was used for gene transcript analysis. Data are presented as mean ± SD. The level of significance was set at p < 0.05. GraphPad Prism 9.0.0 software (GraphPad Software, Inc., La Jolla, CA) was used for statistical analysis.
3. RESULTS
3.1. Genetic profiling of dermatomyositis patients revealed subgroup‐specific signatures
In order to identify disease‐specific gene signatures in DM subgroups, we performed NanoString gene expression analysis with RNA isolated from muscle biopsies obtained from patients with anti‐TIF‐1γ+ and anti‐Mi‐2+ antibodies as well as non‐diseased controls (NDCs). Compared to NDC biopsies from both anti‐TIF‐1γ+ and anti‐Mi‐2+ patients revealed strong dysregulation of immune response‐related genes. We detected 207 deregulated genes that were shared among both subgroups (Table S3). Gene Ontology (GO) term enrichment using Enrichr (21, 22) involved processes related to cytokine‐mediated signaling, T‐cell chemotaxis, type I interferon signaling, and inflammatory response. In fact, among these genes were many well‐known type 1 IFN‐inducible genes identified‐using INTERFEROME v2.01 (23)‐such as ISG15, ISG20, MX1, STAT1, SIGLEC1, CXCR4, CCL19, CARD16, and IRF7 (Figure 1B,C, Table S3).
Additionally, we identified genes that were specifically deregulated in one of the two distinct subgroups in comparison to NDCs (Figure 1D, Table S3). Among the 20 specifically deregulated genes in anti‐TIF‐1γ+ patients’ skeletal muscles, the top five upregulated genes were HLA‐G, TRAF6, HLA‐DQA1, MFGE8, and BAGE, among the top 5 downregulated genes was TPTE (PTEN2), which shows homology to the tumor suppressor PTEN/MMAC1 (Figure 1D). In anti‐Mi‐2+ skeletal muscles, 118 genes were specifically deregulated. The top five upregulated genes included CASP3, IL4R, CD74, HLA‐A, and CD4 (Figure 1D), which were all classified as type 1 IFN‐inducible genes (INTERFEROME v2.01). Among the top 5 downregulated genes were SH2D1B (EAT‐2), RORA, TFRC (CD71), and BCL6, which are involved in differentiation and activation of regulatory T‐cells (24, 25, 26, 27) leading to suppression of inflammation (28).
3.2. NanoString analysis clearly distinguishes anti‐TIF‐1γ+ from anti‐Mi‐2+ dermatomyositis patients
To further assess whether NanoString‐based gene profiling can readily differentiate between anti‐TIF‐1γ+‐ and anti‐Mi‐2+‐associated DM, we performed a pathway score analysis, which functionally annotated groups of genes followed by unsupervised clustering of samples. Here, we found a clear separation of both DM groups into two distinct clusters (Figure 2A). Interestingly, the one Mi‐2+/CAM+ case clustered closer with the TIF‐1γ+ cases than the other cancer‐free patients. Within the group of TIF‐1γ+ patient samples, CAM+ cases clustered together (Figure 2A, asterisks) indicating an additional, CAM‐associated expression profile. A comparison of the differentially expressed genes in anti‐TIF‐1γ+ versus anti‐Mi‐2+ patients’ biopsies revealed a distinct subgroup‐specific gene signature (Figure 2B, Table S2). The top 5 upregulated genes in anti‐TIF‐1γ+ patients’ muscle compared to anti‐Mi‐2+ patients’ skeletal muscles were: VEGFA, IFNB1, DDX58, ARG2, and IL12RB2. The top 5 downregulated genes in TIF‐1γ+ patients' muscle compared to Mi‐2+ patients' muscle were: CD74, CD84, CCL5, ITGB2, and ITGAL (Figure 2B). To further elucidate the molecular mechanisms of anti‐TIF‐1γ autoantibody and association to cancer in adult DM patients‐since an association with cancer was described in the literature, we focused on specifically dysregulated genes in anti‐TIF‐1γ+ patients compared to NDCs or anti‐Mi‐2+ individuals. We could identify VEGFA (29, 30), BAGE (31, 32), DDX58 (RIG‐I, (33)), and MST1R (RON, (34)) as upregulated and TPTE (35) as downregulated. As shown in Figure 2C, the expression levels of VEGF, DDX58/RIG‐1, and MST1R/RON were increased in comparison to NDCs, in line with the NanoString results. The expression reached significance for DDX58 and MSTR1 in both subgroups.
FIGURE 2.
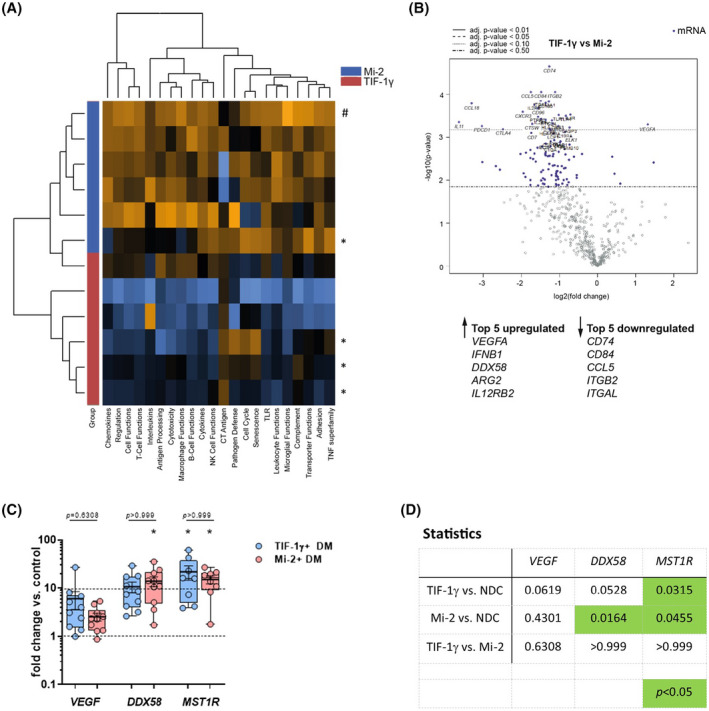
NanoString® analysis clearly distinguishes anti‐TIF‐1γ+ from ‐Mi‐2+ dermatomyositis patients. (A) Unsupervised clustering of patient samples using the NanoString® pathway score analysis tool. Asterisk (*) indicate CAM+ patients. Hashtag (#) indicates CAM‐ patient. (B) Differential gene expression analysis of anti‐TIF‐1γ+ patients vs. ‐Mi‐2+ patients. The top 5 up‐ and downregulated genes are highlighted. (C) Gene expression levels detected by qPCR of DM patients (each subgroup n = 10) displayed as fold‐change vs. NDC (n = 3), upregulation is significant for DDX58, MST1R in anti‐Mi‐2+ patients as well as for MST1R in anti‐TIF‐1γ+ patients, no significance between both subgroups was detected (C, D)
For validation of our findings, with qPCR we analyzed expression levels in additional muscle samples of anti‐TIF‐1γ+ and anti‐Mi‐2+ patients. However, VEGF, DDX58, and MST1R expression showed no significant differences between the two subgroups (Figure 2D), which is in line with previous reports demonstrating that NanoString showed superior sensitivity compared to that of qPCR (36, 37). NanoString is, therefore, better suited to identify subtle differences in the gene expression levels.
3.3. Protein expression of VEGF and DDX58/RIG‐1 is enhanced in perifascicular areas
To investigate protein localization of VEGF in the skeletal muscle specimens, we performed immunohistochemistry and immunofluorescence stainings. In anti‐TIF‐1γ+ DM patients’ muscles, VEGF expression was clearly enhanced in perifascicular areas, most evident on atrophic muscle fibers with a decreasing gradient towards the center of the fascicle (Figure 3). In contrast, anti‐Mi‐2+ DM patients showed‐in line with the RNA expression data‐less positive myofibers with a more diffuse distribution pattern (Figure 3). Double labeling of VEGF and laminin‐α5‐expressed around blood vessels‐identified severe loss of capillaries in the perifascicular area between the VEGF+ myofibers in anti‐TIF‐1γ+ patients’ skeletal muscles (Figure 3). These VEGF+ myofibers were identified as regenerating fibers by the co‐expression of the neonatal myosin heavy chain (nMyHc, Figure 3). Regular laminin‐α5‐positive capillaries were not severely diminished in anti‐Mi‐2+ DM patients’ muscles. Here, many perifascicular fibers showed sarcolemmal laminin‐α5 expression (Figure 3).
FIGURE 3.
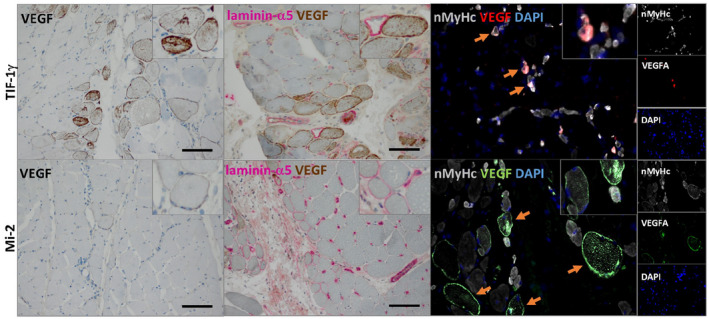
Histological and immunofluorescent staining of VEGF in DM patients’ skeletal muscle samples. Anti‐TIF‐1γ+ DM patients show clearly enhanced expression of sarcolemmal VEGF in the perifascicular areas while anti‐Mi‐2+ DM patients show only single positive fibres (left panel). Double immune histochemistry identified multiple VEGF+ myofibres and a severe depletion of laminin‐α5+ capillaries in anti‐TIF‐1γ+, while laminin‐α5+ capillaries were less depleted in anti‐Mi‐2+ DM patients’ biopsies (middle panel). Double immunofluorescence showed that atrophic muscle fibres co‐stained with neonatal myosin heavy chain (nMyHc) and VEGF (orange arrow) both in TIF‐1γ+ and in Mi‐2+ cases, however, not all regenerating myofibres were also VEGF+ (right panel)
DDX58/RIG‐1 was found in the perifascicular area, weakly expressed on the sarcolemma of muscle fibers and on single immune cells in both subgroups without major differences (Figure S1). DDX58/RIG‐1 expression was not detected on CD68+ macrophages or CD8+ T‐cells (Figure S1).
3.4. RON/MSTR1 is mainly expressed on endothelial cells of intramuscular capillaries
Next, we investigated, which cells expressed RON/MST1R in our cohort. We identified CD31+/RON+ endothelial cells in intramuscular capillaries in both subgroups (Figure S2), whereas there was no co‐labeling of RON and PDGFRB+ pericytes (Figure S2). To further elucidate the expression of the phosphorylated form (Phospho‐RON, p‐RON), we performed various double immunofluorescence staining which revealed no co‐labeling of pRON and nMyHc+ regenerating fibers, MHC class II+ M1 or CD206+ M2 macrophages nor CD8+ T‐cells. We identified single CD4+/pRON+ cells in both subgroups (Figure S2).
4. DISCUSSION
Dermatomyositis‐specific autoantibodies such as anti‐TIF‐1γ have been shown to tightly correlate with organ involvement and malignancy in cancer‐associated myositis (2, 4, 5, 10). Thus, these autoantibodies are now recognized as useful biomarkers to stratify DM patients into clinical subgroups, and assessing the correct TIF‐1γ antibody status is of high importance to determine diagnostic procedures and prognosis.
The correlation of cancer and Mi‐2 autoantibodies, however, remains debated. While some groups reported no increased risk of cancer development in anti‐Mi‐2+ patients (38, 39, 40), other more recent studies on larger patients cohorts demonstrated a correlation of Mi‐2 antibody and CAM (41, 42). In our cohort, CAM was detected in 60% of anti‐TIF‐1γ‐ and 20% of anti‐Mi‐2‐associated DM patients, which (i) basically reflects results from other larger patient series (43, 44) and (ii) emphasized the need for personalized risk‐stratified cancer follow‐up for both DM subgroups.
We demonstrate that determining the NanoString nCounter PanCancer Immune Profiling Panel™ from skeletal muscle tissue may be alternatively used or in addition to distinguish both subgroups based on their distinct immune gene expression profiles. Moreover, our results suggest a specific expression profile of TIF‐1γ+/CAM+ cases. As a limitation of our study is the small sample size, this needs to be followed up in larger, prospective studies to further elucidate signaling pathways associated with cancer development and manifestation in these patients.
Both anti‐TIF‐1γ+ and anti‐Mi‐2+ patients’ skeletal muscle biopsies revealed strong dysregulation of immune response‐related genes compared to NDCs. In line with previous reports, these included well‐known type 1 IFN‐inducible genes such as ISG15, ISG20, SIGLEC1, IRF7, and MX1 (45, 46, 47, 48, 49, 50). We also identified subgroup‐specific differences: TIF‐1γ+ patients showed upregulation of HLA‐G, HLA‐DQA1, and BAGE, the latter being a well‐known tumor antigen (51, 52, 53) present in many cancers (54). Dysregulation of HLA genes including HLA‐DQA1, HLA‐A, and HLA‐G are described in DM patients and HLA gene polymorphisms were shown to be susceptibility factors in myositis (55, 56).
In direct comparison to anti‐Mi‐2+ DM patients’ biopsies, anti‐TIF‐1γ+ patients’ biopsies showed an increased number of VEGF+ atrophic, nMyHc+ regenerating muscle fibers and a marked loss of perifascicular capillaries. The capillary drop out, a feature previously noticed in DM (45) may be caused by C5b‐9‐driven angiodestruction in TIF‐1γ+ patients (5, 57) and may well explain the significant upregulation of VEGF mRNA in the muscle tissue of TIF‐1γ+ patients in contrast to that in anti‐Mi‐2+ patients, which is most likely the result of increased levels of hypoxia in the perifascicular region (58, 59, 60, 61). Nevertheless, the function of VEGF is not limited to angiogenesis and vascular permeability (62), but also affects the function of immune cells and contributes to key aspects of tumor initiation and tumorigenesis (63). In fact, VEGF induces the expression of programmed cell death 1 ligand 1 (PD‐L1), an inhibitory ligand, which may lead to decrease the ability of the immune system to detect and eliminate tumor‐associated antigens (64). However, whether VEGF overexpression in the muscle tissue of TIF‐1γ+ patients contributes to tumor initiation or progression needs further investigation.
Retinoic acid‐inducible gene I (DDX58/RIG‐1) a cytosolic pattern recognition receptor, which is responsible for the type‐1 interferon (IFN1) response, was also found to be significantly upregulated in anti‐TIF‐1γ+ muscle biopsies in contrast to anti‐Mi‐2+. Immunohistochemically, the expression of RIG‐1 was found on the sarcolemma of muscle fibers in the perifascicular area and on single immune cells in both subgroups (anti‐Mi‐2+, anti‐TIF‐1γ+). DDX58/RIG‐1 was shown to be directly involved in virus recognition and interferon production (47, 65, 66, 67). Nevertheless, it has been shown that increased RIG‐1 expression may be involved in limiting innate immune response and supporting tumor growth (67).
RON expression has recently been shown in a wide variety of human cancers (68) and is associated with malignant progression (69, 70), whereas in inflammation, it is described to suppress the inflammatory response (69). Analyzing the expression of MST1R/RON, showed a specifically upregulation in the muscle tissues of TIF‐1γ+ patients in contrast to those of NDCs.
We identified CD31+ endothelial cells as the major source of RON in both, anti‐TIF‐1γ+ and anti‐Mi‐2+ muscle biopsies. MST1R/RON induces molecular and cellular alterations (70), which may contribute to endothelial dysfunction and damage in DM, but this needs further investigation. Regulation of genes that are known to be associated with cancer (VEGFA, DDX58/RIG1, MST1R/RON, BAGE, and TPTE) in anti‐TIF‐1γ+ patients, and their expression on protein level, however, need further investigation as these genes are also involved in other biological processes apart from tumorigenesis.
Anti‐TIF‐1γ+ skeletal muscles showed compared to anti‐Mi‐2+, only scarce inflammatory infiltrates (1), which goes in line with the downregulation of different genes involved in immune response, such as CD74 (HLA class II histocompatibility antigen gamma chain) (71), leucocyte differentiation antigen CD84 (72, 73) as well as Chemokine (C‐C motif) ligand 5 (CCL5), which plays an active role recruiting leukocytes to inflammatory sites and which is also relevant to induce immune responses against tumors (74). Further downregulated genes were Integrin beta chain‐2 (ITGB2, CD18), which together with Integrin alpha L (ITGAL, CD11A, lymphocyte function‐associated antigen 1) form the lymphocyte function‐associated antigen‐1 (LFA‐1) playing a major role in neutrophil and T‐cell trafficking, extravasation, and emigration (75, 76).
Anti‐Mi‐2‐associated DM, in contrast, reflects a pathogenetically distinct subgroup, for which the specific type I interferon and inflammatory response was most prominent. From 109 upregulated genes in anti‐Mi‐2+ muscles compared to NDC muscles, 72 were identified to be IFN1‐inducible, which is histologically reflected by dense, mixed inflammatory infiltrates in the muscle biopsies. Therefore, the IFN signature in DM seems to be very prominent and pathogenically relevant especially in anti‐Mi‐2+ patients’ biopsies. Our results subsequently enlarge the current knowledge on DM subgroup‐specific deregulation of IFN1 pathways, which was previously investigated by Pinal‐Fernandez et al., but for only a very limited number of IFN1‐inducible genes (48).
Furthermore, our observation paves the way for JAK inhibitors as a treatment strategy to block type I interferon pathway activation in DM (47), which‐in light of our results‐may be more effective in anti‐Mi‐2+‐ than in anti‐TIF‐1γ+‐ associated DM.
We show that NanoString analysis is a very sensitive method (77, 78) to identify a distinct gene signature in skeletal muscle tissues of DM patients with anti‐TIF‐1γ or with anti‐Mi‐2 autoantibodies for diagnostic evaluation, cancer surveillance, and clinical follow‐up. In comparison, immunofluorescence or qPCR studies did not identify a distinct anti‐TIF‐1γ+‐specific biomarker that is associated with an increased risk of CAM showing that NanoString analysis is useful for better understanding of the DM etiology, prognosis, and identifying better treatment strategies.
CONFLICT OF INTEREST
The authors report no disclosures relevant to the manuscript.
AUTHOR CONTRIBUTIONS
Corinna Preusse, Werner Stenzel, and Josefine Radke designed the study concept. Pascale Eede, Kiara Freitag, Randi Koll, Waltraud Froehlich, Corinna Preusse, Udo Schneider, and Josefine Radke performed data analysis. Corinna Preusse and Josefine Radke wrote the manuscript. Anne Schänzer provided muscle biopsy samples and revised the manuscript. Lucie Heinzeling, Yves Allenbach, Olivier Benveniste, Hans‐Hilmar Goebel, and Werner Stenzel revised the manuscript and contributed to data analysis.
Supporting information
Fig S1‐S2
FIGURE S1 Histological and immunofluorescent staining of DDX58/RIG‐1 in DM patients’ skeletal muscle samples. DDX58/RIG‐1 was found in perifascicular areas on the sarcolemma of muscle fibres and single immune cells (left panel). Expression was not detected on CD68+ macrophages (middle panel) nor on CD8+ T‐cells (right panel)
FIGURE S2 Immunofluorescent staining of RON/MST1R in DM patients’ skeletal muscle samples. (A) We identified single CD31+RON+ cells, while there was no co‐labelling between RON and PDGFRB+ pericytes or fibroblasts (left panel) or pRON and nMyHc+ regenerating fibres (middle planel) or MHC class II+ macrophages (right panel). (B) We revealed no co‐labelling of pRON and CD8+ T‐cells (left panel) or CD206+ M2 macrophages (middle panel). However, we identified single CD4+/pRON+ cells in both subgroups (right panel)
Table S1‐S2
TABLE S1 clinical information
TABLE S2 antibody information
Table S1‐S3
TABLE S3 NanoString results
ACKNOWLEDGMENT
This work was supported by the Deutsche Gesellschaft für Muskelkranke (DGM) e.V. and by the German Cancer Consortium (DKTK), Partner Site Charité Berlin.
Corinna Preusse and Pascale Eede are shared first authorship.
Funding information
This work was supported by the Deutsche Gesellschaft für Muskelkranke (DGM) e.V. and by the German Cancer Consortium (DKTK), Partner Site Charité Berlin
DATA AVAILABILITY STATEMENT
The authors of this manuscript state, that they have carefully documented data, methods, and materials used to conduct the research in the article. Data not provided in the article because of space limitations can be made available at the request of other investigators for purposes of replicating procedures and results. To our knowledge, there are no legal or ethical reasons or any embargoes on datasets, which may restrict this data availability policy.
REFERENCES
- 1.Benveniste O, Goebel HH, Stenzel W. Biomarkers in inflammatory myopathies—an expanded definition. Front Neurol. 2019;10:554. [DOI] [PMC free article] [PubMed] [Google Scholar]
- 2.Mammen AL, Allenbach Y, Stenzel W, Benveniste O, ENMC 239th Workshop Study Group . 239th ENMC International Workshop: Classification of dermatomyositis, Amsterdam, the Netherlands, 14–16 December 2018. Neuromuscul Disord. 2020;30:70–92. [DOI] [PubMed] [Google Scholar]
- 3.Sasaki H, Kohsaka H. Current diagnosis and treatment of polymyositis and dermatomyositis. Mod Rheumatol. 2018;28:913–21. [DOI] [PubMed] [Google Scholar]
- 4.Stuhlmuller B, Schneider U, Gonzalez‐Gonzalez JB, Feist E. Disease specific autoantibodies in idiopathic inflammatory myopathies. Front Neurol. 2019;10:438. [DOI] [PMC free article] [PubMed] [Google Scholar]
- 5.Hida A, Yamashita T, Hosono Y, Inoue M, Kaida K, Kadoya M, et al. Anti‐TIF1‐gamma antibody and cancer‐associated myositis: A clinicohistopathologic study. Neurology. 2016;87:299–308. [DOI] [PubMed] [Google Scholar]
- 6.Fiorentino DF, Kuo K, Chung L, Zaba L, Li S, Casciola‐Rosen L. Distinctive cutaneous and systemic features associated with antitranscriptional intermediary factor‐1gamma antibodies in adults with dermatomyositis. J Am Acad Dermatol. 2015;72:449–55. [DOI] [PMC free article] [PubMed] [Google Scholar]
- 7.Allenbach Y, Benveniste O, Goebel HH, Stenzel W. Integrated classification of inflammatory myopathies. Neuropathol Appl Neurobiol. 2017;43:62–81. [DOI] [PubMed] [Google Scholar]
- 8.Targoff IN, Mamyrova G, Trieu EP, Perurena O, Koneru B, O'Hanlon TP, et al. A novel autoantibody to a 155‐kd protein is associated with dermatomyositis. Arthritis Rheum. 2006;54:3682–9. [DOI] [PubMed] [Google Scholar]
- 9.de Souza FH, Shinjo SK. Newly diagnosed dermatomyositis in the elderly as predictor of malignancy. Rev Bras Reumatol. 2012;52:713–21. [PubMed] [Google Scholar]
- 10.Di Rollo D, Abeni D, Tracanna M, Capo A, Amerio P. Cancer risk in dermatomyositis: a systematic review of the literature. G Ital Dermatol Venereol. 2014;149:525–37. [PubMed] [Google Scholar]
- 11.Gkegkes ID, Minis EE, Iavazzo C. Dermatomyositis and colorectal cancer: a systematic review. Ir J Med Sci. 2018;187:615–20. [DOI] [PubMed] [Google Scholar]
- 12.Jakubaszek M, Kwiatkowska B, Maslinska M. Polymyositis and dermatomyositis as a risk of developing cancer. Reumatologia. 2015;53:101–5. [DOI] [PMC free article] [PubMed] [Google Scholar]
- 13.Qiang JK, Kim WB, Baibergenova A, Alhusayen R. Risk of malignancy in dermatomyositis and polymyositis. J Cutan Med Surg. 2017;21:131–6. [DOI] [PubMed] [Google Scholar]
- 14.Aggarwal R, Bandos A, Reed AM, Ascherman DP, Barohn RJ, Feldman BM, et al. Predictors of clinical improvement in rituximab‐treated refractory adult and juvenile dermatomyositis and adult polymyositis. Arthritis Rheumatol. 2014;66:740–9. [DOI] [PMC free article] [PubMed] [Google Scholar]
- 15.Benveniste O, Stenzel W, Allenbach Y. Advances in serological diagnostics of inflammatory myopathies. Curr Opin Neurol. 2016;29:662–73. [DOI] [PubMed] [Google Scholar]
- 16.Satoh M, Tanaka S, Ceribelli A, Calise SJ, Chan EK. A Comprehensive overview on myositis‐specific antibodies: new and old biomarkers in idiopathic inflammatory myopathy. Clin Rev Allergy Immunol. 2017;52:1–19. [DOI] [PMC free article] [PubMed] [Google Scholar]
- 17.Satoh M, Tanaka S, Chan EK. The uses and misuses of multiplex autoantibody assays in systemic autoimmune rheumatic diseases. Front Immunol. 2015;6:181. [DOI] [PMC free article] [PubMed] [Google Scholar]
- 18.Cesano A. nCounter((R)) PanCancer immune profiling panel (NanoString Technologies Inc, Seattle, WA). J Immunother Cancer. 2015;3:42. [DOI] [PMC free article] [PubMed] [Google Scholar]
- 19.Onken J, Vajkoczy P, Torka R, Hempt C, Patsouris V, Heppner FL, et al. Phospho‐AXL is widely expressed in glioblastoma and associated with significant shorter overall survival. Oncotarget. 2017;8:50403–14. [DOI] [PMC free article] [PubMed] [Google Scholar]
- 20.Preusse C, Allenbach Y, Hoffmann O, Goebel HH, Pehl D, Radke J, et al. Differential roles of hypoxia and innate immunity in juvenile and adult dermatomyositis. Acta Neuropathologica Communications. 2016;4:45. [DOI] [PMC free article] [PubMed] [Google Scholar]
- 21.Chen EY, Tan CM, Kou Y, Duan Q, Wang Z, Meirelles GV, et al. Enrichr: interactive and collaborative HTML5 gene list enrichment analysis tool. BMC Bioinformatics. 2013;14:128. [DOI] [PMC free article] [PubMed] [Google Scholar]
- 22.Kuleshov MV, Jones MR, Rouillard AD, Fernandez NF, Duan Q, Wang Z, et al. Enrichr: a comprehensive gene set enrichment analysis web server 2016 update. Nucleic Acids Res. 2016;44(W1):W90–7. [DOI] [PMC free article] [PubMed] [Google Scholar]
- 23.Zhang Z, Shao C, Li X, Sun Y, Zhang M, Mu J, et al. Hierarchical assembly of ultrathin hexagonal SnS2 nanosheets onto electrospun TiO2 nanofibers: enhanced photocatalytic activity based on photoinduced interfacial charge transfer. Nanoscale. 2013;5:606–18. [DOI] [PubMed] [Google Scholar]
- 24.Cronin SJF, Woolf CJ, Weiss G, Penninger JM. The role of iron regulation in immunometabolism and immune‐related disease. Front Mol Biosci. 2019;6:116. [DOI] [PMC free article] [PubMed] [Google Scholar]
- 25.Dempsey LA. RORalpha in treg cells. Nat Immunol. 2018;19:510. [DOI] [PubMed] [Google Scholar]
- 26.Hu J, Havenar‐Daughton C, Crotty S. Modulation of SAP dependent T: B cell interactions as a strategy to improve vaccination. Curr Opin Virol. 2013;3:363–70. [DOI] [PMC free article] [PubMed] [Google Scholar]
- 27.Xie MM, Dent AL. Unexpected help: follicular regulatory T cells in the germinal center. Front Immunol. 2018;9:1536. [DOI] [PMC free article] [PubMed] [Google Scholar]
- 28.Malhotra N, Leyva‐Castillo JM, Jadhav U, Barreiro O, Kam C, O'Neill NK, et al. RORalpha‐expressing T regulatory cells restrain allergic skin inflammation. Sci Immunol. 2018;3:eaao6923. [DOI] [PMC free article] [PubMed] [Google Scholar]
- 29.Choueiri TK, Kaelin WG Jr. Targeting the HIF2‐VEGF axis in renal cell carcinoma. Nat Med. 2020;26:1519–30. [DOI] [PubMed] [Google Scholar]
- 30.Cuzziol CI, Castanhole‐Nunes MMU, Pavarino EC, Goloni‐Bertollo EM. MicroRNAs as regulators of VEGFA and NFE2L2 in cancer. Gene. 2020;759:144994. [DOI] [PubMed] [Google Scholar]
- 31.Bodey B. Cancer‐testis antigens: promising targets for antigen directed antineoplastic immunotherapy. Expert Opin Biol Ther. 2002;2:577–84. [DOI] [PubMed] [Google Scholar]
- 32.Greiner J, Bullinger L, Guinn BA, Dohner H, Schmitt M. Leukemia‐associated antigens are critical for the proliferation of acute myeloid leukemia cells. Clin Cancer Res. 2008;14:7161–6. [DOI] [PubMed] [Google Scholar]
- 33.Xu XX, Wan H, Nie L, Shao T, Xiang LX, Shao JZ. RIG‐I: a multifunctional protein beyond a pattern recognition receptor. Protein Cell. 2018;9:246–53. [DOI] [PMC free article] [PubMed] [Google Scholar]
- 34.Vladimer GI, Snijder B, Krall N, Bigenzahn JW, Huber KVM, Lardeau CH, et al. Global survey of the immunomodulatory potential of common drugs. Nat Chem Biol. 2017;13:681–90. [DOI] [PMC free article] [PubMed] [Google Scholar]
- 35.Dong XY, Su YR, Qian XP, Yang XA, Pang XW, Wu HY, et al. Identification of two novel CT antigens and their capacity to elicit antibody response in hepatocellular carcinoma patients. Br J Cancer. 2003;89:291–7. [DOI] [PMC free article] [PubMed] [Google Scholar]
- 36.Hu D, Zhou W, Wang F, Shu SM, Fan LL, He J, et al. Development of a NanoString assay to detect leukemogenic fusion transcripts in acute myeloid leukemia. Int J Lab Hematol. 2016;38:663–73. [DOI] [PubMed] [Google Scholar]
- 37.Tsang HF, Xue VW, Koh SP, Chiu YM, Ng LP, Wong SC. NanoString, a novel digital color‐coded barcode technology: current and future applications in molecular diagnostics. Expert Rev Mol Diagn. 2017;17:95–103. [DOI] [PubMed] [Google Scholar]
- 38.Dos Passos Carvalho MIC, Shinjo SK. Frequency and clinical relevance of anti‐Mi‐2 autoantibody in adult Brazilian patients with dermatomyositis. Adv Rheumatol. 2019;59:27. [DOI] [PubMed] [Google Scholar]
- 39.Liang L, Zhang YM, Chen H, Ye LF, Li SS, Lu X, et al. Anti‐Mi‐2 antibodies characterize a distinct clinical subset of dermatomyositis with favourable prognosis. Eur J Dermatol. 2020;30(2):151–158. [DOI] [PubMed] [Google Scholar]
- 40.Muro Y, Ishikawa A, Sugiura K, Akiyama M. Clinical features of anti‐TIF1‐alpha antibody‐positive dermatomyositis patients are closely associated with coexistent dermatomyositis‐specific autoantibodies and anti‐TIF1‐gamma or anti‐Mi‐2 autoantibodies. Rheumatology. 2012;51:1508–13. [DOI] [PubMed] [Google Scholar]
- 41.Mariampillai K, Granger B, Amelin D, Guiguet M, Hachulla E, Maurier F, et al. Development of a new classification system for idiopathic inflammatory myopathies based on clinical manifestations and myositis‐specific autoantibodies. JAMA Neurol. 2018;75:1528–37. [DOI] [PMC free article] [PubMed] [Google Scholar]
- 42.Monseau G, Landon‐Cardinal O, Stenzel W, Schoindre Y, Mariampillai K, Barete S, et al. Systematic retrospective study of 64 patients with anti‐Mi2 dermatomyositis: a classic skin rash with a necrotizing myositis and high risk of malignancy. J Am Acad Dermatol. 2020;83:1759–63. [DOI] [PubMed] [Google Scholar]
- 43.Chinoy H, Fertig N, Oddis CV, Ollier WE, Cooper RG. The diagnostic utility of myositis autoantibody testing for predicting the risk of cancer‐associated myositis. Ann Rheum Dis. 2007;66:1345–9. [DOI] [PMC free article] [PubMed] [Google Scholar]
- 44.Oldroyd A, Sergeant JC, New P, McHugh NJ, Betteridge Z, Lamb JA, et al. The temporal relationship between cancer and adult onset anti‐transcriptional intermediary factor 1 antibody‐positive dermatomyositis. Rheumatology. 2019;58:650–5. [DOI] [PMC free article] [PubMed] [Google Scholar]
- 45.Allenbach Y, Leroux G, Suarez‐Calvet X, Preusse C, Gallardo E, Hervier B, et al. Dermatomyositis with or without anti‐melanoma differentiation‐associated gene 5 antibodies. Am J Pathol. 2016;186(3):691–700. [DOI] [PubMed] [Google Scholar]
- 46.Greenberg SA, Pinkus JL, Pinkus GS, Burleson T, Sanoudou D, Tawil R, et al. Interferon‐alpha/beta‐mediated innate immune mechanisms in dermatomyositis. Ann Neurol. 2005;57:664–78. [DOI] [PubMed] [Google Scholar]
- 47.Ladislau L, Suarez‐Calvet X, Toquet S, Landon‐Cardinal O, Amelin D, Depp M, et al. JAK inhibitor improves type I interferon induced damage: proof of concept in dermatomyositis. Brain. 2018;141:1609–21. [DOI] [PubMed] [Google Scholar]
- 48.Pinal‐Fernandez I, Casal‐Dominguez M, Derfoul A, Pak K, Plotz P, Miller FW, et al. Identification of distinctive interferon gene signatures in different types of myositis. Neurology. 2019;93:e1193–e1204. [DOI] [PMC free article] [PubMed] [Google Scholar]
- 49.Radke J, Koll R, Preusse C, Pehl D, Todorova K, Schonemann C, et al. Architectural B‐cell organization in skeletal muscle identifies subtypes of dermatomyositis. Neurol Neuroimmunol Neuroinflamm. 2018;5:e451. [DOI] [PMC free article] [PubMed] [Google Scholar]
- 50.Salajegheh M, Kong SW, Pinkus JL, Walsh RJ, Liao A, Nazareno R, et al. Interferon‐stimulated gene 15 (ISG15) conjugates proteins in dermatomyositis muscle with perifascicular atrophy. Ann Neurol. 2010;67:53–63. [DOI] [PMC free article] [PubMed] [Google Scholar]
- 51.Boel P, Wildmann C, Sensi ML, Brasseur R, Renauld JC, Coulie P, et al. BAGE: a new gene encoding an antigen recognized on human melanomas by cytolytic T lymphocytes. Immunity. 1995;2:167–75. [DOI] [PubMed] [Google Scholar]
- 52.Vodolazhsky DI, Kutilin DS, Mogushkova KA, Kit OI. Specific features of transcription activity of cancer‐testis antigens in patients with metastatic and non‐metastatic breast cancer. Bull Exp Biol Med. 2018;165:382–5. [DOI] [PubMed] [Google Scholar]
- 53.Wu F, Yin Z, Yang L, Fan J, Xu J, Jin Y, et al. Smoking induced extracellular vesicles release and their distinct properties in non‐small cell lung cancer. J Cancer. 2019;10:3435–43. [DOI] [PMC free article] [PubMed] [Google Scholar]
- 54.Pandey A, Kurup A, Shrivastava A, Radhi S, Nguyen DD, Arentz C, et al. Cancer testes antigens in breast cancer: biological role, regulation, and therapeutic applicability. Int Rev Immunol. 2012;31:302–20. [DOI] [PubMed] [Google Scholar]
- 55.Gao X, Han L, Yuan L, Yang Y, Gou G, Sun H, et al. HLA class II alleles may influence susceptibility to adult dermatomyositis and polymyositis in a Han Chinese population. BMC Dermatol. 2014;14:9. [DOI] [PMC free article] [PubMed] [Google Scholar]
- 56.O'Hanlon TP, Rider LG, Schiffenbauer A, Targoff IN, Malley K, Pandey JP, et al. Immunoglobulin gene polymorphisms are susceptibility factors in clinical and autoantibody subgroups of the idiopathic inflammatory myopathies. Arthritis Rheum. 2008;58:3239–46. [DOI] [PMC free article] [PubMed] [Google Scholar]
- 57.Braczynski AK, Harter PN, Zeiner PS, Drott U, Tews DS, Preusse C, et al. C5b–9 deposits on endomysial capillaries in non‐dermatomyositis cases. Neuromuscul Disord. 2016;26(4–5):283–91. [DOI] [PubMed] [Google Scholar]
- 58.Chai KX, Chen YQ, Fan PL, Yang J, Yuan X. STROBE: the correlation of Cyr61, CTGF, and VEGF with polymyositis/dermatomyositis. Medicine. 2018;97:e11775. [DOI] [PMC free article] [PubMed] [Google Scholar]
- 59.Cvetkovic D, Movsas B, Dicker AP, Hanlon AL, Greenberg RE, Chapman JD, et al. Increased hypoxia correlates with increased expression of the angiogenesis marker vascular endothelial growth factor in human prostate cancer. Urology. 2001;57:821–5. [DOI] [PubMed] [Google Scholar]
- 60.Ochoa O, Sun D, Reyes‐Reyna SM, Waite LL, Michalek JE, McManus LM, et al. Delayed angiogenesis and VEGF production in CCR2‐/‐ mice during impaired skeletal muscle regeneration. Am J Physiol Regul Integr Comp Physiol. 2007;293:R651–R661. [DOI] [PubMed] [Google Scholar]
- 61.Palmer BF, Clegg DJ. Oxygen sensing and metabolic homeostasis. Mol Cell Endocrinol. 2014;397(1–2):51–8. [DOI] [PubMed] [Google Scholar]
- 62.Senger DR. Vascular endothelial growth factor: much more than an angiogenesis factor. Mol Biol Cell. 2010;21:377–9. [DOI] [PMC free article] [PubMed] [Google Scholar]
- 63.Goel HL, Mercurio AM. VEGF targets the tumour cell. Nat Rev Cancer. 2013;13:871–82. [DOI] [PMC free article] [PubMed] [Google Scholar]
- 64.Elinav E, Nowarski R, Thaiss CA, Hu B, Jin C, Flavell RA. Inflammation‐induced cancer: crosstalk between tumours, immune cells and microorganisms. Nat Rev Cancer. 2013;13:759–71. [DOI] [PubMed] [Google Scholar]
- 65.Kell AM, Gale M Jr. RIG‐I in RNA virus recognition. Virology. 2015;479–480:110–21. [DOI] [PMC free article] [PubMed] [Google Scholar]
- 66.Suarez‐Calvet X, Gallardo E, Nogales‐Gadea G, Querol L, Navas M, Diaz‐Manera J, et al. Altered RIG‐I/DDX58‐mediated innate immunity in dermatomyositis. J Pathol. 2014;233(3):258–68. [DOI] [PubMed] [Google Scholar]
- 67.Wolf D, Fiegl H, Zeimet AG, Wieser V, Marth C, Sprung S, et al. High RIG‐I expression in ovarian cancer associates with an immune‐escape signature and poor clinical outcome. Int J Cancer. 2020;146:2007–18. [DOI] [PMC free article] [PubMed] [Google Scholar]
- 68.Thobe MN, Gurusamy D, Pathrose P, Waltz SE. The Ron receptor tyrosine kinase positively regulates angiogenic chemokine production in prostate cancer cells. Oncogene. 2010;29:214–26. [DOI] [PMC free article] [PubMed] [Google Scholar]
- 69.Benight NM, Waltz SE. Ron receptor tyrosine kinase signaling as a therapeutic target. Expert Opin Ther Targets. 2012;16:921–31. [DOI] [PMC free article] [PubMed] [Google Scholar]
- 70.Moser C, Lang SA, Hackl C, Zhang H, Lundgren K, Hong V, et al. Oncogenic MST1R activity in pancreatic and gastric cancer represents a valid target of HSP90 inhibitors. Anticancer Res. 2012;32:427–37. [PubMed] [Google Scholar]
- 71.Su H, Na N, Zhang X, Zhao Y. The biological function and significance of CD74 in immune diseases. Inflamm Res. 2017;66:209–16. [DOI] [PubMed] [Google Scholar]
- 72.Cuenca M, Sintes J, Lanyi A, Engel P. CD84 cell surface signaling molecule: An emerging biomarker and target for cancer and autoimmune disorders. Clin Immunol. 2019;204:43–9. [DOI] [PubMed] [Google Scholar]
- 73.Lewinsky H, Barak AF, Huber V, Kramer MP, Radomir L, Sever L, et al. CD84 regulates PD‐1/PD‐L1 expression and function in chronic lymphocytic leukemia. J Clin Investig. 2018;128:5465–78. [DOI] [PMC free article] [PubMed] [Google Scholar]
- 74.Hanahan D, Coussens LM. Accessories to the crime: functions of cells recruited to the tumor microenvironment. Cancer Cell. 2012;21:309–22. [DOI] [PubMed] [Google Scholar]
- 75.Thome S, Begandt D, Pick R, Salvermoser M, Walzog B. Intracellular beta2 integrin (CD11/CD18) interacting partners in neutrophil trafficking. Eur J Clin Invest. 2018;48(Suppl 2):e12966. [DOI] [PubMed] [Google Scholar]
- 76.Verma NK, Kelleher D. Not just an adhesion molecule: LFA‐1 contact tunes the T lymphocyte program. J Immunol. 2017;199:1213–21. [DOI] [PubMed] [Google Scholar]
- 77.Prokopec SD, Watson JD, Waggott DM, Smith AB, Wu AH, Okey AB, et al. Systematic evaluation of medium‐throughput mRNA abundance platforms. RNA. 2013;19:51–62. [DOI] [PMC free article] [PubMed] [Google Scholar]
- 78.Veldman‐Jones MH, Brant R, Rooney C, Geh C, Emery H, Harbron CG, et al. Evaluating robustness and sensitivity of the nanostring technologies ncounter platform to enable multiplexed gene expression analysis of clinical samples. Cancer Res. 2015;75:2587–93. [DOI] [PubMed] [Google Scholar]
Associated Data
This section collects any data citations, data availability statements, or supplementary materials included in this article.
Supplementary Materials
Fig S1‐S2
FIGURE S1 Histological and immunofluorescent staining of DDX58/RIG‐1 in DM patients’ skeletal muscle samples. DDX58/RIG‐1 was found in perifascicular areas on the sarcolemma of muscle fibres and single immune cells (left panel). Expression was not detected on CD68+ macrophages (middle panel) nor on CD8+ T‐cells (right panel)
FIGURE S2 Immunofluorescent staining of RON/MST1R in DM patients’ skeletal muscle samples. (A) We identified single CD31+RON+ cells, while there was no co‐labelling between RON and PDGFRB+ pericytes or fibroblasts (left panel) or pRON and nMyHc+ regenerating fibres (middle planel) or MHC class II+ macrophages (right panel). (B) We revealed no co‐labelling of pRON and CD8+ T‐cells (left panel) or CD206+ M2 macrophages (middle panel). However, we identified single CD4+/pRON+ cells in both subgroups (right panel)
Table S1‐S2
TABLE S1 clinical information
TABLE S2 antibody information
Table S1‐S3
TABLE S3 NanoString results
Data Availability Statement
The authors of this manuscript state, that they have carefully documented data, methods, and materials used to conduct the research in the article. Data not provided in the article because of space limitations can be made available at the request of other investigators for purposes of replicating procedures and results. To our knowledge, there are no legal or ethical reasons or any embargoes on datasets, which may restrict this data availability policy.