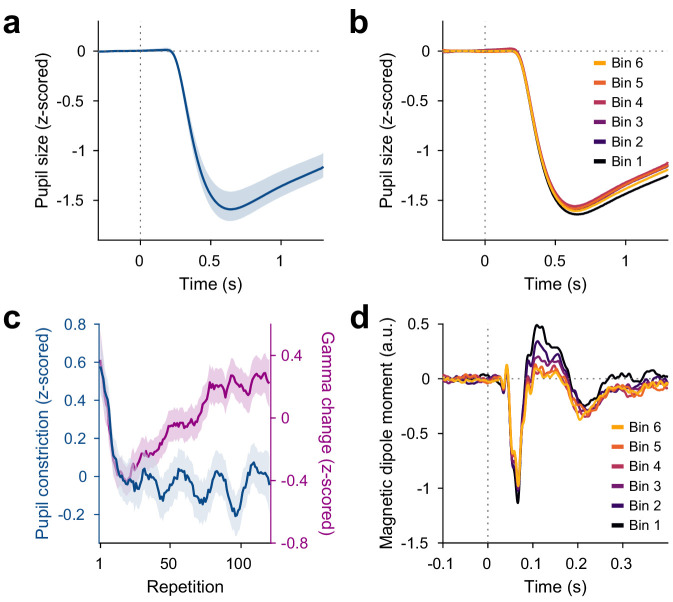
Figure 4. Repetition effects on pupil constriction and ERF.
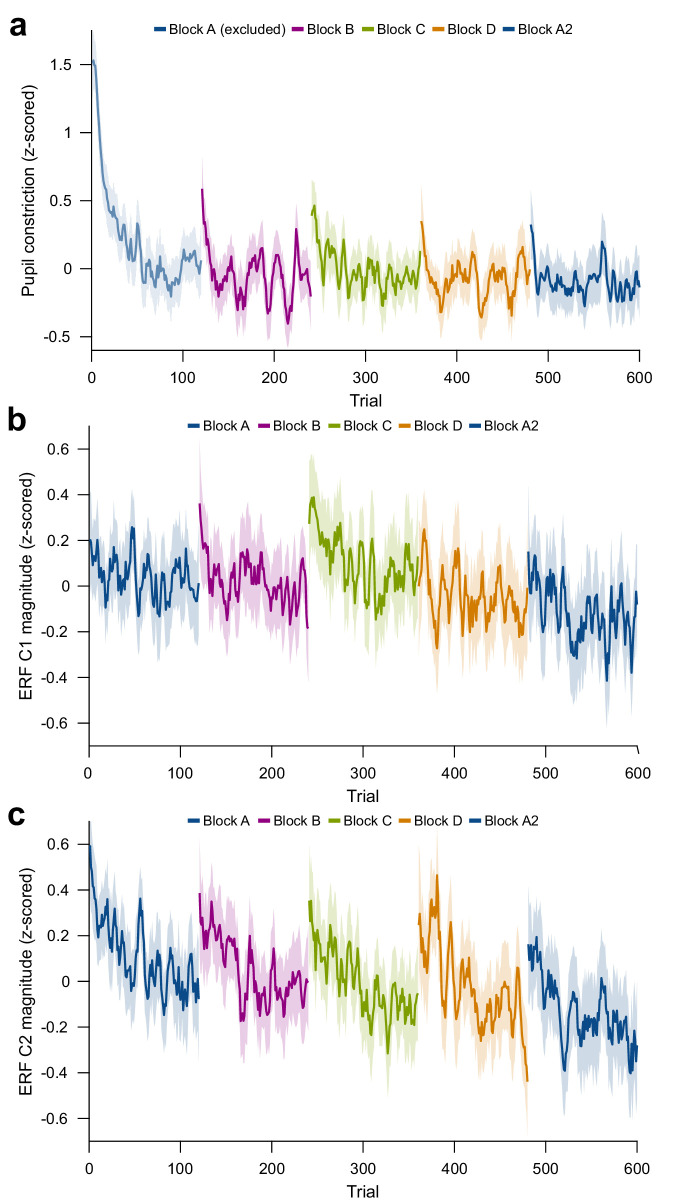
(a) Average pupil size as a function of time post-stimulus onset, z-scored relative to the baseline. A pupillary light reflex to the luminance increase at stimulus onset can be seen. All pupil plots exclude block A because pupil size at the beginning of the experiment was confounded by slow adaptation to the projector illumination (see Figure 4—figure supplement 1a). (b) Same as (a), but averaged for bins of 20 stimulus repetitions each. (c) Blue: Per-repetition average pupil constriction (defined as the per-trial difference between mean pupil size during the 300 ms baseline period and the 0.5–1.2 s post-stimulus period, z-scored within subjects). Violet: Per-repetition stimulus-induced gamma power change in V1/V2 (z-scored within subjects), for comparison. The average and the 95% bootstrap confidence intervals were computed using a five-trial-wide running window. (d) Magnetic dipole moment in V1/V2 in response to stimulus onset, averaged for bins of 20 stimulus repetitions each.


