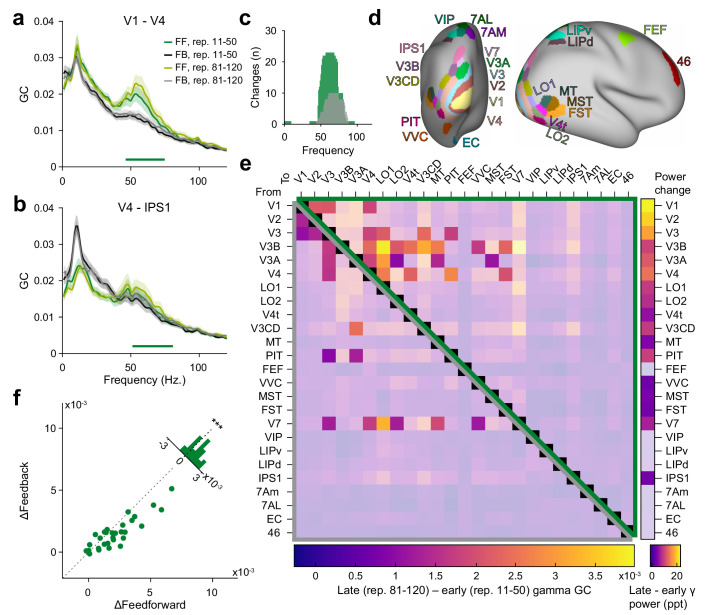
Figure 5. Repetition effects on GC are strongest for gamma in the feedforward direction.
(a) Bivariate GC spectra between areas V1 and V4 (FF = feedforward, i.e. V1-to-V4, FB = feedback, i.e. V4-to-V1). GC was separately computed for early repetitions (trials 11–50, i.e. after the early gamma decrease) and late repetitions (trials 81–120). Error regions reflect 95% CIs. Inferential statistics are based on a non-parametric permutation test cluster-corrected for multiple comparisons across frequencies (Maris and Oostenveld, 2007). Horizontal green bar indicates significant cluster for FF GC. (b) Same analysis as in (a), but for areas V4 and IPS1, with feedforward being V4-to-IPS1 and feedback being IPS1-to-V4. (c) Total number of per-frequency significant differences between late and early repetition GC spectra between all areas (green = feedforward, gray = feedback). (d) All areas used for the analysis, plotted onto a semi-inflated average cortical surface. Area and surface definitions were taken from the HCP MMP1.0 atlas (Glasser et al., 2016a). (e) Changes in gamma GC from early to late trials, separately for the feedforward direction (upper matrix half, enclosed by green triangle) and the feedback direction (lower matrix half, enclosed by gray triangle). Non-significant matrix entries are gray masked. To be considered significant, matrix entries had to pass a tmax-corrected paired permutation test including time-reversal testing (Vinck et al., 2015). Inset right: Changes in gamma power for each brain area from early to late repetitions (significance based on a tmax-corrected paired permutation test; non-significant areas are gray masked). (f) The analysis of (e) was repeated per subject, and for the individually significant matrix entries, GC changes were averaged, separately for the feedforward (x-axis) and feedback (y-axis) direction; each dot corresponds to one subject. Across subjects, repetition-related GC changes were larger in the feedforward than the feedback direction ().


