Abstract
Wet dedusting is the main coal dust suppression technique in coal mines, and coal wettability is the main factor affecting dust suppression efficiency. To investigate the main factors affecting the coal wettability and improve it, the coal–water contact angle was used as an index to characterize the coal wettability, and the wettability of six coal samples with different metamorphic degree was studied by analyzing the relationship between the physicochemical properties and the contact angle. To improve the coal wettability, the nonionic surfactant alkyl polyglycoside (APG), anionic surfactant sodium dodecyl benzene sulfonate (SDBS), and polymer surfactant polyacrylamide (PAM) were applied to the coal samples. The results show that SDBS is the most effective surfactant to improve the coal wettability, followed by APG, while the application of PAM would lead to more hydrophobic coal. It is also found that the coal wettability shows a high–low–high trend with the increase in the metamorphic degree. The wettability of long flame coal is the strongest and that of gas coal is the weakest. Moisture is the main hydrophilic factor of coal, while 1,4-dimethylbenzene is the main hydrophobic factor. The main factors affecting the treatment effect of APG, SDBS, and PAM on wettability are the aromatic methylbenzene, hydroxyl, and hydroxyl content of coal, respectively. Therefore, according to the content of hydroxyl in different coals, an SDBS solution can be prepared to improve the coal wettability. For coal with a low hydroxyl content, a higher concentration SDBS solution could be needed.
1. Introduction
Coal is one of the leading energy and an indispensable fuel for the development of the global industry. In China, from 2012 to 2019, the average annual production of raw coal accounts for more than 68% of the primary energy, and the total consumption of coal accounts for more than 57% of the total energy consumption. However, with the improvement of mechanization and automation in coal mining, the dust pollution in coal mines becomes more and more serious, which severely threatens the miners’ safety and health.1,2 Coal dust can not only cause explosions but also lead to pneumoconiosis in coal miners, which is the highest morbidity occupational disease in China.3,4 To reduce the coal dust disaster, it is necessary to take effective measures to control the dust concentration in coal mines.
Currently, wet dedusting methods such as spray dust suppression, water injection, and foam dust reduction are the main dust control measures in coal mines.5−9 However, due to the poor wettability of some coal dust, the wet dedusting efficiency is not ideal. Generally, coal wettability is characterized by the coal–water contact angle.10−14 The smaller the contact angle, the better the coal wettability, and the more hydrophilic the coal.15 Recently, the addition of surfactants or ionic liquids to water was reported by some scholars as an effective way to reduce the interfacial tension between coal and water, thus improving the coal wettability.16,17 To reduce the coal–water contact angle, Ni et al.18 added a certain concentration of imidazoline ionic liquids into distilled water and it was found that the coal wettability was improved. Wang et al.19 investigated the influence of anionic and nonionic surfactants on coal wettability and concluded that the anionic surfactants can better improve the wettability of coal in water. Jiang et al.20 and Ni et al.21 found that adding sodium chloride (NaCl) to a sodium dodecyl sulfonate solution (SDS) can improve the wettability of coal in a surfactant solution, and the higher the NaCl concentration, the better the coal wettability. Zhou et al.22 mixed an anionic surfactant with a cationic surfactant and then magnetized the mixed solution, which significantly improved the wettability of coal dust in water. Sang et al.23 mixed SDS, kerosene, ethanol, and distilled water and developed a microemulsion that can wet coal dust more easily than traditional wetting agents such as SDS and water. To improve the coal wetting effect of coal seam water injection, Ma et al.24 synthesized a new water injection additive with β–cyclodextrin as a raw material, which could effectively reduce the coal–water contact angle and improve the dust reduction efficiency. Yang et al.25 and Wang et al.26 added a cationic surfactant to the viscoelastic surfactant fracturing fluid, causing a decrease in interfacial tension between coal and liquid in the process of coal seam water injection, thus improving the coal wettability. However, since both the chemical structure and the concentration of the surfactant and the physicochemical properties of coal can affect the coal wettability, the most suitable surfactant for different coals also varies.27
Based on the nuclear magnetic resonance experiments, Zheng et al.28 investigated the microscopic mechanism of nine different types of surfactants affecting coal wettability and concluded that phenol, aryl ether carbon, aliphatic, and aromatic methyl groups are the key parameters affecting coal wettability. Zhou et al.29 established the evaluation index system of wetting parameters by an analytic hierarchy process and proposed a method to obtain the optimum surfactant concentration for spray dust suppression. According to Fourier transform infrared spectroscopy (FTIR), Ma et al.30 and Xu et al.31 investigated the effect of the chemical structure of a surfactant and concluded that hydroxyl is the hydrophilic factor and the aliphatic group is the hydrophobic factor of coal. To better improve the effect of the surfactant on coal wettability, some scholars further studied the internal factors affecting coal wettability. Arif32,33 reported that coal wettability increases with the decrease in the metamorphic degree and the ζ potential of coal. Hongchao et al.34 reported that the moisture, ash, oxygen-containing functional groups, and hydroxyl groups of coal can improve the coal wettability, while the aromatic hydrocarbons can weaken the coal wettability and affect the synergistic acidification of SDS and coal. However, Xu et al.35 concluded that moisture can improve coal wettability, while ash, volatile matter, and fixed carbon do not affect the coal wettability. Wang et al.36 analyzed the relationship between functional groups obtained by FTIR and the contact angle of respirable coal dust, and concluded that oxygen-containing functional groups are hydrophilic factors and aromatic hydrocarbons and aliphatic hydrocarbons are hydrophobic factors. Semenova37 studied the chemical structure of coal with different metamorphic degrees and concluded that the higher the content of hydroxyl and carboxyl, the better the coal wettability. Shi et al.38 indicated that the pore structure, ash, and minerals are the main factors to improve the wettability of magmatic intrusive coal. In summary, all of the concentrations and structures of surfactants and the physicochemical properties of coal are influencing factors of the coal wettability. Adding suitable surfactants into the water and injecting the solution into the coal seam can improve the coal wettability, and then the floating coal dust with modified wettability and produced during coal mining process can be more efficiently captured by the water spray. To improve the coal wettability, it is necessary to investigate its main affecting factors so as to provide guidance for the preparation and selection of wetting agents.
Therefore, we collected coal samples with different metamorphic degrees from six coal mines in China. The coal wettability was characterized by the coal–water contact angle. The physical properties and the chemical functional group structure of coal were tested, and the main factors affecting the coal wettability were calculated by the grey system theory model. Then, different surfactants were applied to treat the coal samples to improve the coal wettability, and the main factors affecting the treatment effect of surfactants on coal wettability were analyzed.
2. Experiments and Methods
2.1. Coal Samples and Surfactants
According to the Chinese National Standard GB/T 482–2008, six coal samples with different metamorphic degrees were collected from Guizhou, Shandong, and Liaoning provinces of China. The detailed sampling locations are shown in Figure 1. To improve the coal wettability, alkyl polyglycoside (APG), sodium dodecyl benzene sulfonate (SDBS), and polyacrylamide (PAM) were applied to improve the wettability of coal samples. APG is an environmentally friendly and safe nonionic surfactant, SDBS is an anionic surfactant, and PAM is a polymer surfactant. Figure 2 shows the molecular structure formulae of these three surfactants.
Figure 1.
Information of six sampling locations. (a) Guizhou province. (b) Liaoning province. (c) Shandong province.
Figure 2.
Molecular structure formula of selected surfactants. (a) APG. (b) SDBS. (c) PAM.
2.2. Experimental and Analytical Methods
2.2.1. Experiments
The coal samples were crushed and sieved into different required particle sizes for different testing objectives, and then dried in a constant temperature drying oven at 50 °C for 24 h to remove the external moisture of coal. The relevant testing information is listed in Table 1. The average maximum reflectance of vitrinite, the proximate analysis indexes (internal moisture, ash, volatile, and fixed carbon percentage content), and the Fourier transform infrared spectroscopy (FTIR) were tested according to the Chinese national standard GB/T 6948–2008, GB/T 212–2008, and GB/T 6040–2019, respectively. The infrared spectrum test range is 4000–400 cm–1, the resolution is 4 cm–1, and the scanning times are 32. The functional group information of coal was obtained by the potassium bromide tablet pressing method.39
Table 1. Information on the Required Particle Sizes and Instruments for Different Testing Objectives.
| objective | test | particle size (mm) | instrument |
|---|---|---|---|
| proximate analysis indexes | proximate analysis | 0.074–0.2 | 5E-MVC6700 automatic proximate analyzer (Changsha Kaiyuan Instruments, China) |
| metamorphic degree | average maximum reflectance of vitrinite test | 0.2–0.25 | Microscope photometer (Zeiss, Germany) |
| functional group | infrared spectrum test | <0.074 | FTIR-650 Fourier transform infrared spectrometer (Beijing Global Hengda Technology Co., Ltd.) |
| wettability | contact angle test | <0.074 | SCI4000B automatic dynamic contact angle measuring instrument (Beijing Global Hengda Technology Co., Ltd.) |
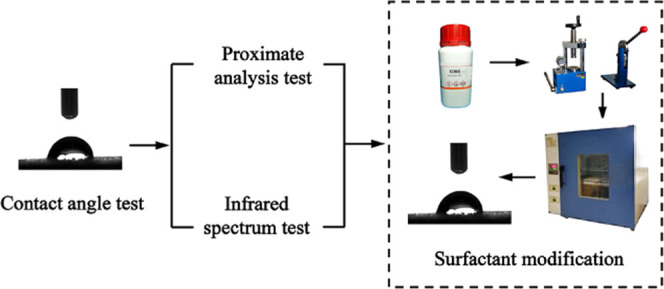
Referring to the literature,38 the contact angle was measured by the sessile drop method at ambient pressure and temperature, with the distilled water and the coal sample as a liquid phase and a solid phase, respectively. The specific testing procedure was as follows: First, 0.2 g of the coal powder was weighed and poured into a mold. Then, it was pressed for 1 min with a DF-4B tablet machine at 15 MPa to obtain a coal slice with a diameter of 13 mm and thickness of 2 mm. Second, distilled water was injected into the syringe, and one drop of water (about 4 μL) was titrated onto the surface of the coal slice, thus the coal–water contact angle was formed on the surface. Then, the value of the contact angle could be automatically reported by the instrument. Three surfactants were dissolved in the distilled water with a concentration of 0.1 wt %, and the coal powder was soaked into the prepared solution for 24 h for treatment, and then pressed into a slice by the abovementioned method and dried for 72 h at 50 °C. Finally, the contact angle between the dry coal slice and distilled water was measured. The schematic diagram of the testing instruments and process is presented in Figure 3.
Figure 3.
Schematic diagram of testing instruments and the process. (a) Dry at 50 °C. (b) Proximate analysis test. (c) Average maximum reflectance of the vitrinite test. (d) FTIR test. (e) Contact angle test. (f) Contact angle test for treatment coal.
2.2.2. Infrared Spectrum Analysis Method
The molecular structure information of coal can be obtained from the infrared spectrum of the sample. Each functional group has the corresponding characteristic absorption peak, which reflects the vibration form of each group in the molecule. Because the coal structure is a heterogeneous mixture composed of multiple functional groups, the phenomenon of multipeak superposition may appear in the infrared spectrum curve. Thus, PeakFit software can be used to fit the absorption peaks of functional groups in the original infrared spectrum curve. For the absorption peaks in the same spectrum and the wavenumber range, the content of functional groups can be represented by the percentage of the peak area.21,39
2.2.3. Analysis Methods for Main Influencing Factors of Coal Wettability and the Treatment Effect
Since many factors affect coal wettability, different factors may correlate with each other, and the dimensions of each factor are different. Therefore, the relationship between the influencing factors and contact angle cannot be directly obtained. In this study, the grey system theory was applied to establish a model to eliminate the original data dimension, and then MATLAB software was used to run the model to investigate the main factors affecting the coal wettability and the main factors affecting the treatment effect of surfactants on coal wettability. The model establishment and calculation process are attached in the Appendix 1.
3. Results
3.1. Basic Physical Parameters of Coal Samples
Table 2 shows the results of proximate analysis and the contact angle of coal samples. As can be seen, the average maximum reflectance of vitrinite (Ro) ranges from 0.63 to 2.69%. With the increase in Ro, the metamorphic degree of coal increases. The metamorphic degree of LJB, YG, PN, ZL, FC, and XK decreases successively. According to the Chinese national standard GB/T 5751–2009, the category of coal samples was classified. The content of moisture (Mad), ash (Aad), volatile matter (Vdaf), and fixed carbon (FCad) are in the ranges of 0.89–10.62, 4.42–34.52, 8.44–44.47, and 41.09–76.22%, respectively. The range of coal–water contact angle of the original coal samples is 16.25–85.31°. After the coal was treated by APG and SDBS, the ranges of contact angle are 8.66–34.55 and 8.25–26.34° respectively, and the contact angle of all coal samples decreases significantly, indicating that the coal wettability was improved. Moreover, the contact angles of the coal samples treated with SDBS are smaller than those treated by APG, suggesting a better effect of SDBS than APG. However, after the treatment of PAM, the contact angles of coal samples ranged from 44.24 to 100.32°, and except for that of ZL and FC, which only decreased by 0.01 and 5.78°, respectively, the contact angles of all other coal samples increased, indicating that the PAM can weaken the coal wettability. Table 3 shows the contact angle of the coal samples. Figure 4 shows that with the increase in the metamorphic degree, the contact angle first increases and then decreases, which indicates that the coal wettability shows a high–low–high trend with the increase in the metamorphic degree and is similar to Wang’s19 conclusion. As the coal rank increased from long flame coal to gas coal, the contact angle increased sharply, thus the coal wettability heavily deteriorated; when the coal rank increased from gas coal to anthracite, the contact angle showed an obvious downward reduction, correspondingly the coal wettability significantly improved. The wettability of long flame coal is the best and that of gas coal is the weakest.
Table 2. Basic Physical Parameters and Contact Angle Testing Results.
| proximate analysis index (wt %) |
contact angle (deg) |
|||||||||
|---|---|---|---|---|---|---|---|---|---|---|
| coal sample | coal category | Ro (%) | Mad | Aad | Vdaf | FCad | distilled water | APG | SDBS | PAM |
| LJB | anthracite | 2.69 | 2.66 | 15.58 | 8.44 | 75.95 | 16.26 | 13.79 | 10.12 | 57.07 |
| PN | coking coal | 1.67 | 0.94 | 13.66 | 16.25 | 73.59 | 82.31 | 19.11 | 16.63 | 100.32 |
| ZL | fat coal | 1.13 | 0.89 | 4.24 | 20.38 | 76.22 | 80.26 | 24.59 | 8.29 | 80.25 |
| XK | long flame coal | 0.63 | 10.62 | 34.52 | 44.47 | 41.09 | 16.25 | 8.66 | 8.25 | 44.24 |
| YG | meager coal | 1.83 | 1.34 | 20.54 | 11.98 | 71.06 | 50.37 | 34.55 | 26.34 | 81.56 |
| FC | gas coal | 0.98 | 1.84 | 11.4 | 35.36 | 59.46 | 85.31 | 30.58 | 11.65 | 79.53 |
Table 3. Contact Angle of Coal Samples.
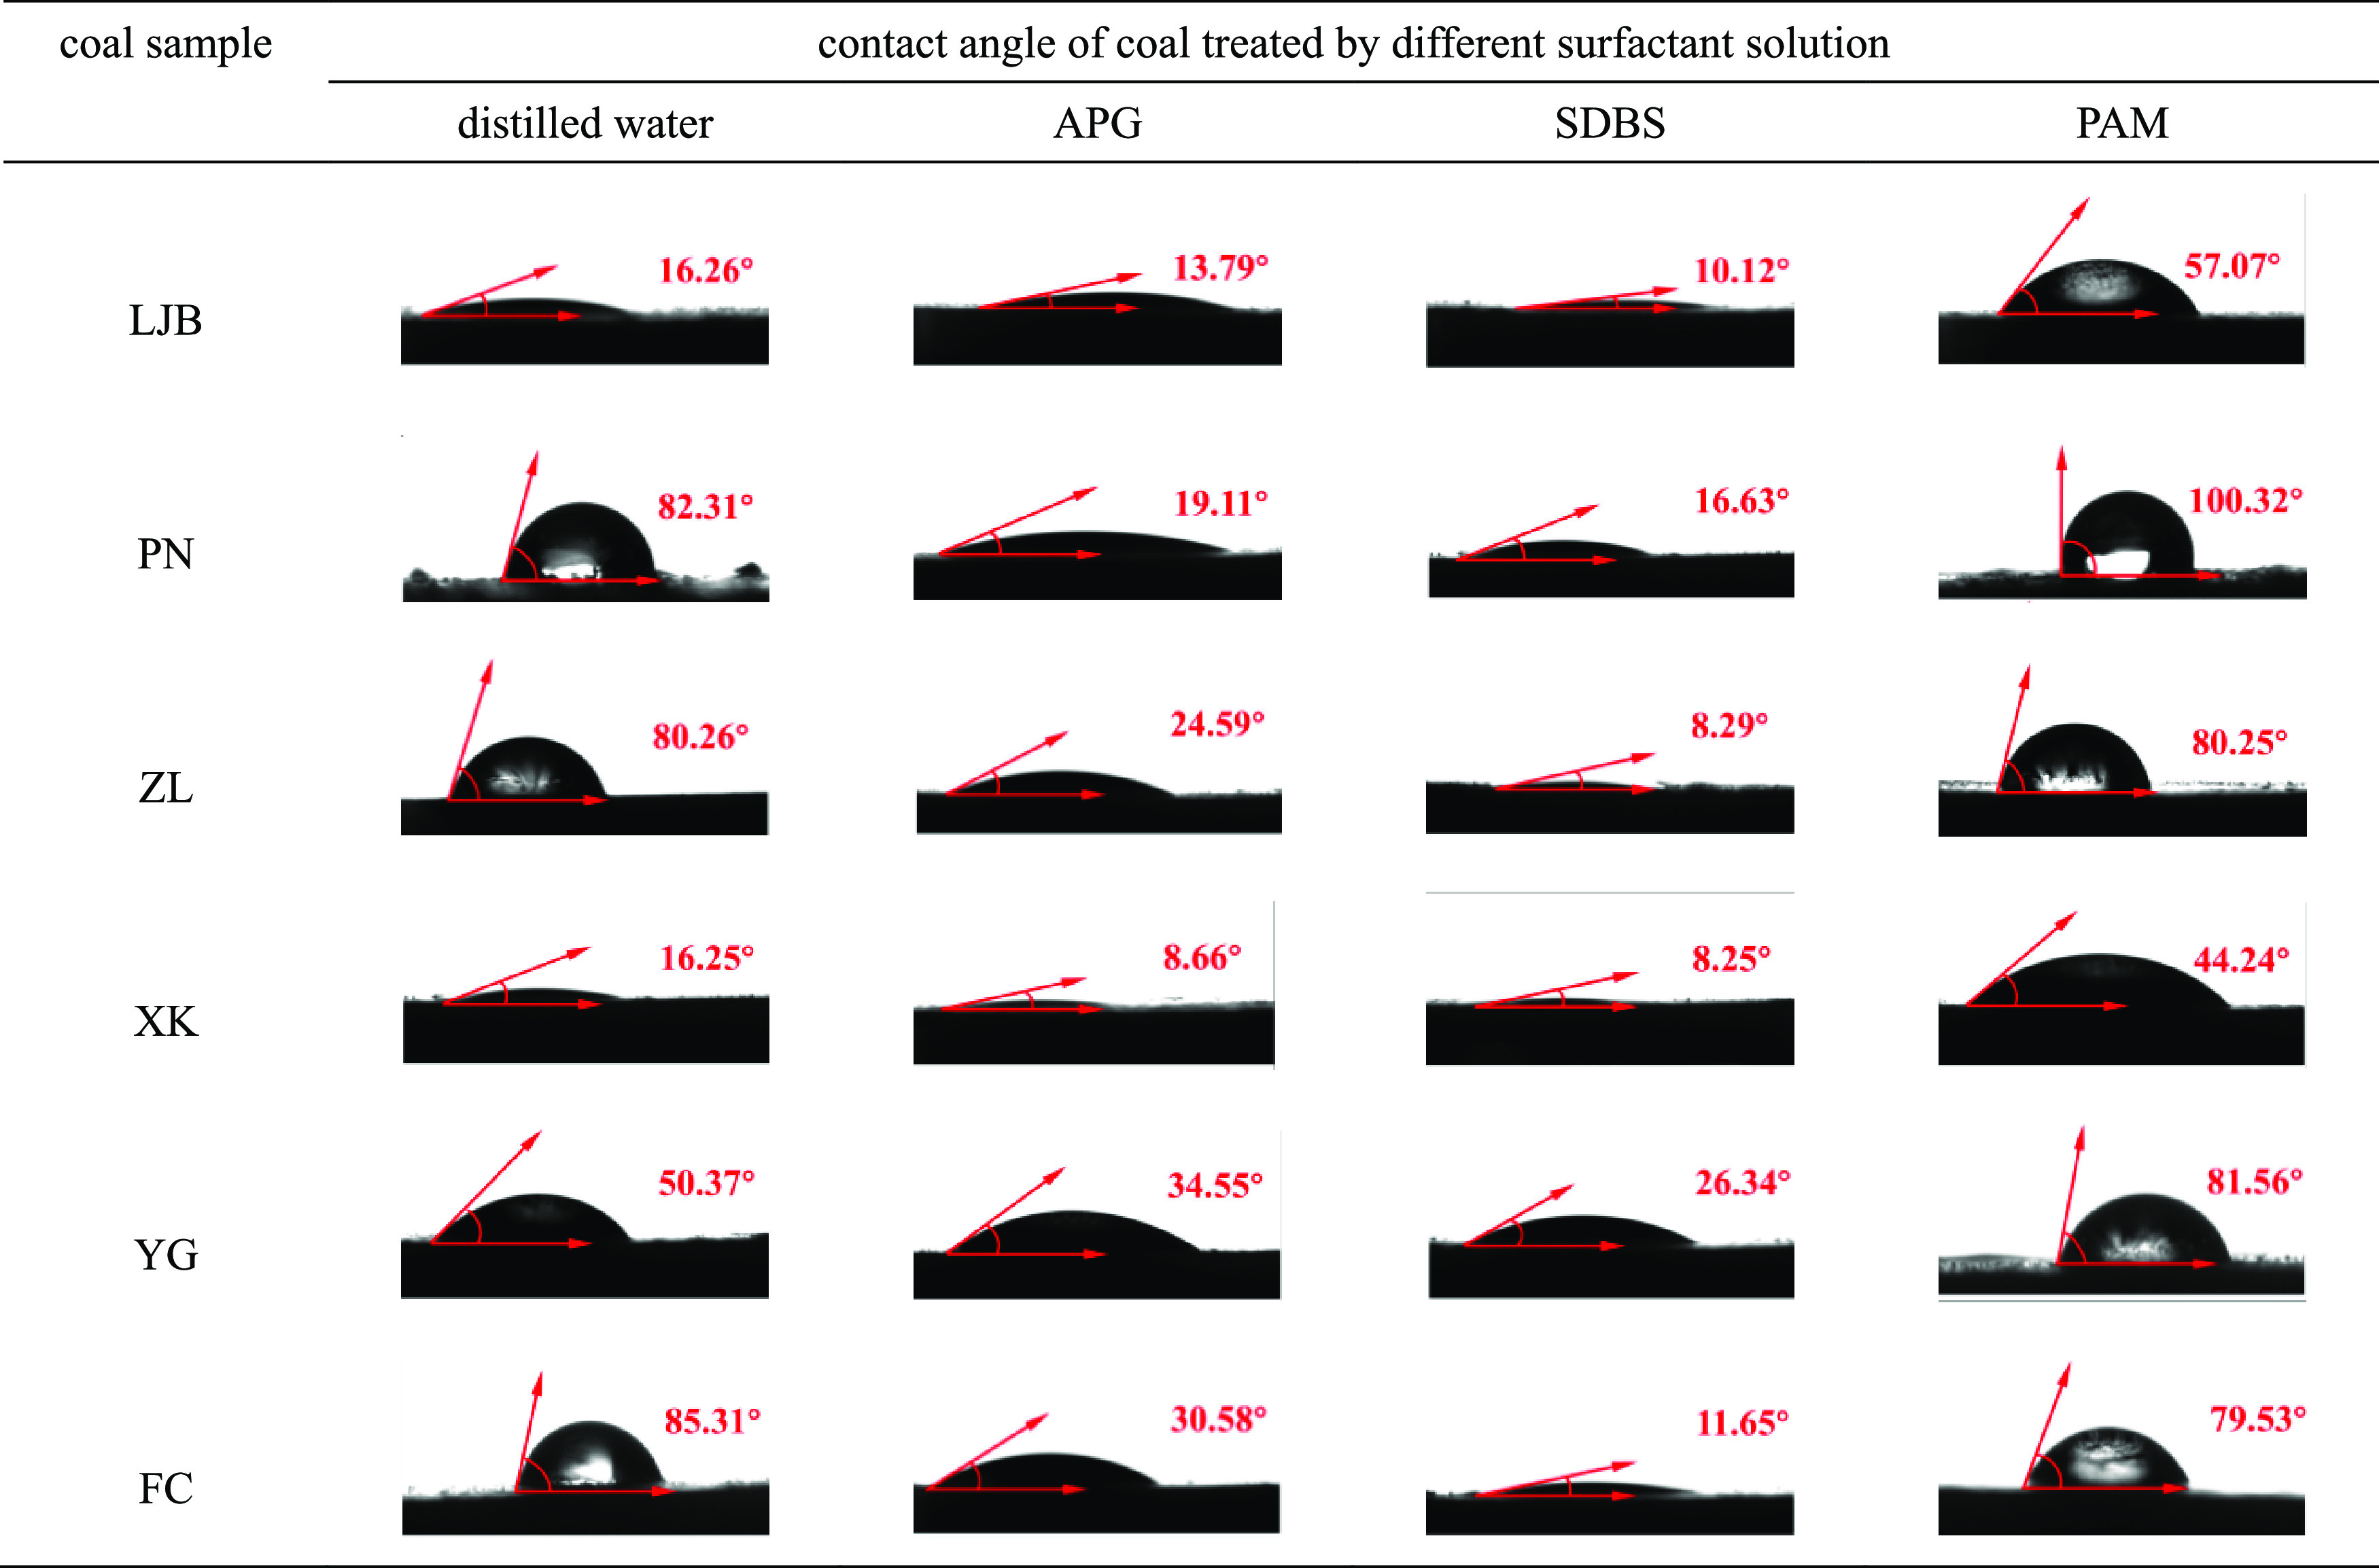
Figure 4.
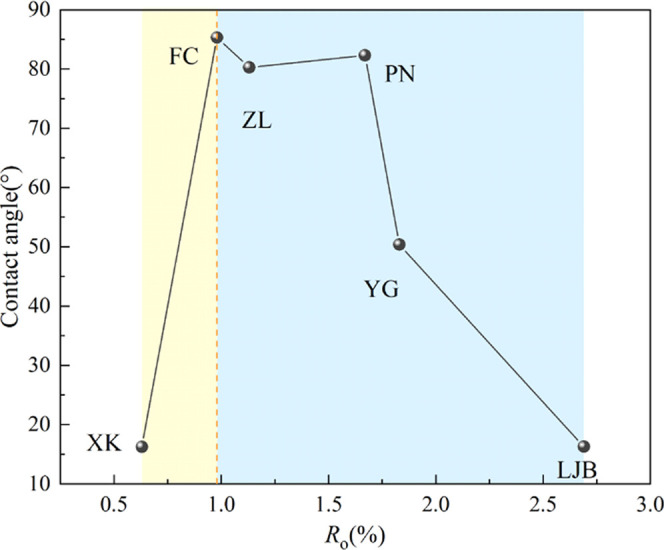
Relationship between the contact angle and metamorphic degree.
3.2. Results of Infrared Spectrum Analysis
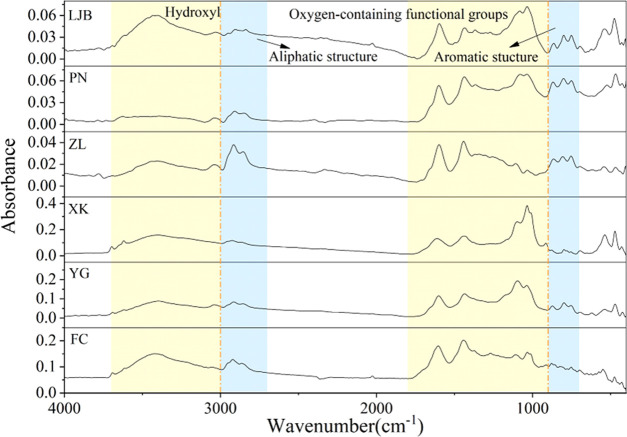
To compare the infrared spectra of each coal sample, the original infrared spectrum data was inputted into OMNIC software, and the infrared spectrum of coal was obtained, as shown in Figure 5. The range and distribution of peaks of each coal sample are almost the same, while the intensity of absorption peaks is different, indicating the different content of functional groups. According to previous studies, the vibration ranges of hydroxyl, aliphatic, oxygen-containing functional groups, and aromatic structures are 3000–3700, 2800–3000, 1000–1800, and 700–900 cm–1, respectively.21,40−46 To obtain the content of functional groups, PeakFit software was used to fit the original spectral curves in these four ranges (the shadow area in Figure 5). It should be noted that due to the interaction between functional groups, the wavenumber position of functional groups may have deviated.
Figure 5.
Original infrared spectrum of coal samples.
3.2.1. Fitting Results of the Hydroxyl Group
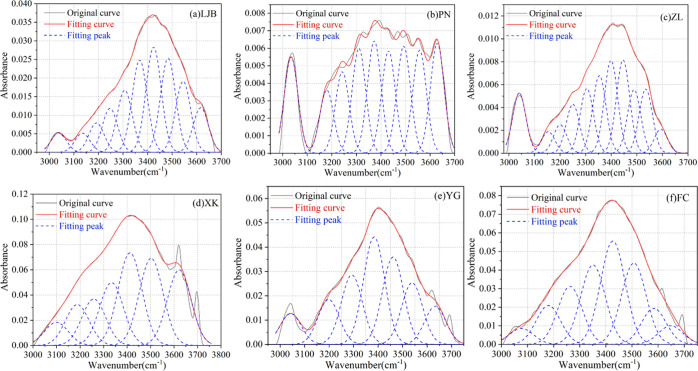
Figure 6 shows the fitting results in the range of 3000–3700 cm–1, and the position and the area of the hydroxyl absorption peak are given in Table 4. After the fitting of the original infrared spectrum, six kinds of hydroxyl functional groups were found: OH···N, ring hydroxyl, OH···O, OH···OH, OH···π, and free hydroxyl, and their characteristic peaks appear near the wavenumbers of 3048, 3226, 3387, 3467, 3526, and 3600 cm–1, respectively.21 Among them, the absorption peak of free hydroxyl is caused by the absorption of moisture in the air by coal samples during the test, and the percentage of the peak area is the percentage of the area of a functional group in areas of all functional groups in the same wavenumber range. As presented in Table 4, all coal samples contain OH···N, ring hydroxyl, OH···O, OH···π, and OH···OH, except that OH···OH was not detected in the XK coal sample.
Figure 6.
Fitting results of the infrared spectrum for 3000–3700 cm–1. (a) LJB. (b) PN. (c) ZL. (d) XK. (e) YG. (f) FC.
Table 4. Fitting Results of the Hydroxyl Group.
| sample | area | wavenumber (cm–1) | percentage of peak area (%) | functional groupa |
|---|---|---|---|---|
| LJB | 0.407 | 3038 | 3.36 | OH···N |
| LJB | 0.917 | 3246 | 7.58 | ring hydroxyl |
| LJB | 1.92 | 3367 | 15.87 | OH···O |
| LJB | 1.96 | 3483 | 16.20 | OH···OH |
| LJB | 1.477 | 3544 | 12.20 | OH···π |
| LJB | 0.931 | 3616 | 7.69 | free hydroxyl |
| PN | 0.384 | 3034 | 10.94 | OH···N |
| PN | 0.325 | 3242 | 9.27 | ring hydroxyl |
| PN | 0.448 | 3372 | 12.75 | OH···O |
| PN | 0.427 | 3492 | 12.16 | OH···OH |
| PN | 0.411 | 3557 | 11.71 | OH···π |
| PN | 0.439 | 3629 | 12.49 | free hydroxyl |
| ZL | 0.342 | 3040 | 9.38 | OH···N |
| ZL | 0.28 | 3249 | 7.68 | ring hydroxyl |
| ZL | 0.443 | 3353 | 12.15 | OH···O |
| ZL | 0.531 | 3446 | 14.56 | OH···OH |
| ZL | 0.366 | 3534 | 10.04 | OH···π |
| ZL | 0.137 | 3593 | 3.76 | free hydroxyl |
| XK | 2.336 | 3099 | 5.41 | OH···N |
| XK | 4.680 | 3258 | 10.84 | ring hydroxyl |
| XK | 9.335 | 3412 | 21.62 | OH···O |
| XK | 8.777 | 3502 | 20.33 | OH···π |
| XK | 7.597 | 3621 | 17.59 | free hydroxyl |
| YG | 1.375 | 3042 | 7.02 | OH···N |
| YG | 2.004 | 3197 | 10.23 | ring hydroxyl |
| YG | 4.787 | 3383 | 24.43 | OH···O |
| YG | 3.889 | 3460 | 19.85 | OH···OH |
| YG | 2.742 | 3538 | 14.00 | OH···π |
| YG | 1.703 | 3633 | 8.69 | free hydroxyl |
| FC | 1.014 | 3076 | 3.70 | OH···N |
| FC | 3.680 | 3262 | 13.44 | ring hydroxyl |
| FC | 5.037 | 3350 | 18.40 | OH···O |
| FC | 6.553 | 3426 | 23.94 | OH···OH |
| FC | 5.151 | 3507 | 18.82 | OH···π |
| FC | 1.186 | 3648 | 4.33 | free hydroxyl |
3.2.2. Fitting Results of the Aliphatic Functional Groups
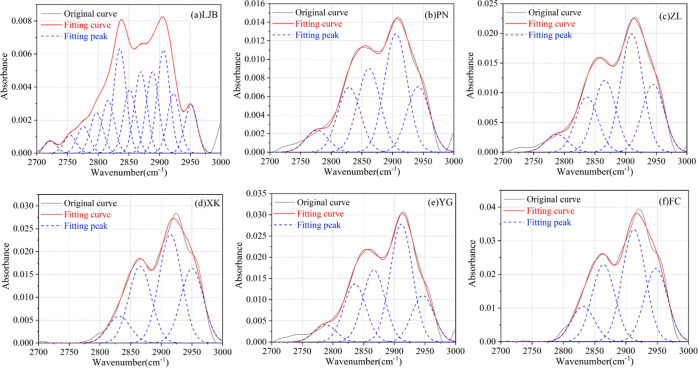
Aliphatic functional groups are the functional groups that generate methane during coal pyrolysis. The fitting results in the range of 2700–3000 cm–1 are shown in Figure 7 and Table 5, which indicated that there are five kinds of absorption peaks formed by aliphatic functional groups: the absorption peak near 2832 cm–1 is caused by −CH stretching vibration, the absorption peaks near 2856 and 2895 cm–1 are caused by −CH2 and −CH3 symmetric stretching vibrations, respectively, and the absorption peaks near 2921 and 2953 cm–1 are caused by the asymmetric stretching vibrations of −CH2 and −CH3, respectively.21,47 The fitting results indicate that all coal samples contain −CH, −CH2, and −CH3 aliphatic functional groups.
Figure 7.
Fitting results of the infrared spectrum for 2700–3000 cm–1. (a) LJB. (b) PN. (c) ZL. (d) XK. (e) YG. (f) FC.
Table 5. Fitting Results of the Aliphatic Functional Group.
| sample | area | wavenumber (cm–1) | percentage of peak area (%) | functional groupa |
|---|---|---|---|---|
| LJB | 0.161 | 2835 | 15.08 | –CH stretching vibration |
| LJB | 0.098 | 2851 | 9.16 | –CH2 symmetric stretching vibration |
| LJB | 0.126 | 2888 | 11.77 | –CH3 symmetric stretching vibration |
| LJB | 0.092 | 2922 | 8.63 | –CH2 asymmetric stretching vibration |
| LJB | 0.074 | 2951 | 6.93 | –CH3 asymmetric stretching vibration |
| PN | 0.326 | 2829 | 18.29 | –CH stretching vibration |
| PN | 0.421 | 2861 | 23.62 | –CH2 symmetric stretching vibration |
| PN | 0.595 | 2905 | 33.42 | –CH3 symmetric stretching vibration |
| PN | 0.329 | 2941 | 18.49 | –CH3 asymmetric stretching vibration |
| ZL | 0.422 | 2836 | 16.73 | –CH stretching vibration |
| ZL | 0.547 | 2866 | 21.69 | –CH2 symmetric stretching vibration |
| ZL | 0.901 | 2910 | 35.73 | –CH2 asymmetric stretching vibration |
| ZL | 0.517 | 2944 | 20.50 | –CH3 asymmetric stretching vibration |
| XK | 0.272 | 2831 | 9.40 | –CH stretching vibration |
| XK | 0.775 | 2865 | 26.79 | –CH2 symmetric stretching vibration |
| XK | 1.094 | 2914 | 37.82 | –CH2 asymmetric stretching vibration |
| XK | 0.752 | 2950 | 25.99 | –CH3 asymmetric stretching vibration |
| YG | 0.620 | 2835 | 18.64 | –CH stretching vibration |
| YG | 0.767 | 2866 | 23.06 | –CH2 symmetric stretching vibration |
| YG | 1.256 | 2911 | 37.79 | –CH2 asymmetric stretching vibration |
| YG | 0.495 | 2946 | 14.88 | –CH3 asymmetric stretching vibration |
| FC | 0.486 | 2831 | 11.88 | –CH stretching vibration |
| FC | 1.058 | 2864 | 25.88 | –CH2 symmetric stretching vibration |
| FC | 1.539 | 2912 | 37.65 | –CH2 asymmetric stretching vibration |
| FC | 1.005 | 2947 | 24.58 | –CH3 asymmetric stretching vibration |
3.2.3. Fitting Results of the Oxygen-Containing Functional Groups
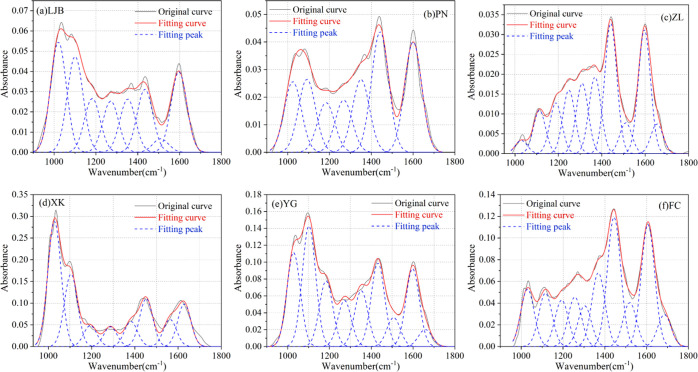
The fitting results in the range of 900–1800 cm–1 are shown in Figure 8 and Table 6, and there are five kinds of absorption peaks formed by oxygen-containing functional groups: the absorption peaks near 1010 and 1032 cm–1 are induced by the Si–O–Si antisymmetric stretching vibration, the absorption peaks near 1095 cm–1 are induced by the C–O–C stretching vibration, the absorption peaks near 1228, 1171, and 1115 cm–1 are induced by the C–O tensile vibration, the absorption peaks near 1299 cm–1 are induced by the N=O symmetric stretching vibration, and the absorption peaks near 1678 cm–1 are induced by the C=O tensile vibration.21,47
Figure 8.
Fitting results of the infrared spectrum for 900–1800 cm–1. (a) LJB. (b) PN. (c) ZL. (d) XK. (e) YG. (f) FC.
Table 6. Fitting Results of the Oxygen-Containing Functional Group.
| sample | area | wavenumber (cm–1) | percentage of peak area (%) | functional groupa |
|---|---|---|---|---|
| LJB | 5.143 | 1020 | 21.12 | Si–O–Si antisymmetric stretching vibration |
| LJB | 4.471 | 1100 | 18.36 | C–O–C stretching vibration |
| LJB | 2.519 | 1182 | 10.35 | C–O tensile vibration |
| LJB | 2.393 | 1270 | 9.83 | N=O symmetric stretching vibration |
| PN | 2.632 | 1024 | 12.87 | Si–O–Si antisymmetric stretching vibration |
| PN | 2.723 | 1092 | 13.32 | C–O–C stretching vibration |
| PN | 1.851 | 1183 | 9.05 | C–O tensile vibration |
| PN | 1.943 | 1268 | 9.50 | N=O symmetric stretching vibration |
| ZL | 0.233 | 1028 | 2.10 | Si–O–Si antisymmetric stretching vibration |
| ZL | 0.761 | 1112 | 16.9 | C–O tensile vibration |
| ZL | 1.117 | 1248 | ||
| ZL | 1.232 | 1309 | 11.08 | N=O symmetric stretching vibration |
| XK | 22.004 | 1028 | 32.80 | Si–O–Si antisymmetric stretching vibration |
| XK | 12.751 | 1104 | 19.01 | C–O–C stretching vibration |
| XK | 3.714 | 1193 | 5.54 | C–O tensile vibration |
| XK | 3.506 | 1287 | 5.23 | N=O symmetric stretching vibration |
| YG | 8.967 | 1028 | 15.92 | Si–O–Si antisymmetric stretching vibration |
| YG | 11.507 | 1101 | 20.43 | C–O–C stretching vibration |
| YG | 6.282 | 1183 | 11.15 | C–O tensile vibration |
| YG | 4.409 | 1272 | 7.83 | N=O symmetric stretching vibration |
| YG | 1.640 | 1658 | 2.91 | C=O tensile vibration |
| FC | 4.252 | 1029 | 8.81 | Si–O–Si antisymmetric stretching vibration |
| FC | 3.944 | 1115 | 15.28 | C–O tensile vibration |
| FC | 3.436 | 1193 | ||
| FC | 3.025 | 1303 | 6.26 | N=O symmetric stretching vibration |
| FC | 2.370 | 1685 | 4.91 | C=O tensile vibration |
3.2.4. Fitting Results of the Aromatic Functional Groups
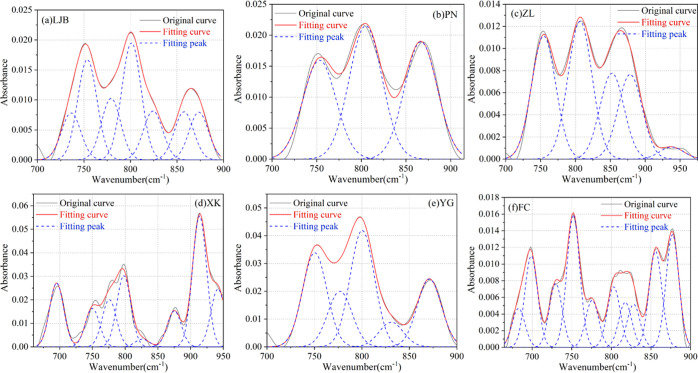
The fitting results in the range of 700–900 cm–1 are shown in Figure 9 and Table 7, which shows that there are four kinds of absorption peaks formed by aromatic functional groups: the absorption peaks near 754, 792, 823, and 860 cm–1 are formed by methylbenzene, 1,2-dimethylbenzene, 1,3-dimethylbenzene, and 1,4-dimethylbenzene, respectively.21,47
Figure 9.
Fitting results of the infrared spectrum for 700–900 cm–1. (a) LJB. (b) PN. (c) ZL. (d) XK. (e) YG. (f) FC.
Table 7. Fitting Results of the Aromatic Functional Group.
| sample | area | wavenumber (cm–1) | percentage of peak area (%) | functional groupa |
|---|---|---|---|---|
| LJB | 0.434 | 753 | 21.29 | methylbenzene |
| LJB | 0.507 | 801 | 24.88 | 1,2-dimethylbenzene |
| LJB | 0.212 | 824 | 10.41 | 1,3-dimethylbenzene |
| LJB | 0.208 | 857 | 10.23 | 1,4-dimethylbenzene |
| PN | 0.74 | 753 | 28.32 | methylbenzene |
| PN | 0.996 | 804 | 38.12 | 1,2-dimethylbenzene |
| PN | 0.877 | 866 | 33.56 | 1,4-dimethylbenzene |
| ZL | 0.482 | 754 | 27.70 | methylbenzene |
| ZL | 0.54 | 806 | 31.03 | 1,2-dimethylbenzene |
| ZL | 0.34 | 852 | 19.54 | 1,4-dimethylbenzene |
| XK | 0.432 | 750 | 8.51 | methylbenzene |
| XK | 0.798 | 798 | 15.73 | 1,2-dimethylbenzene |
| XK | 0.087 | 826 | 1.71 | 1,3-dimethylbenzene |
| XK | 0.404 | 875 | 7.96 | 1,4-dimethylbenzene |
| YG | 1.085 | 750 | 26.23 | methylbenzene |
| YG | 1.342 | 800 | 32.44 | 1,2-dimethylbenzene |
| YG | 0.285 | 830 | 6.89 | 1,3-dimethylbenzene |
| YG | 0.782 | 870 | 18.91 | 1,4-dimethylbenzene |
| FC | 0.323 | 751 | 18.07 | methylbenzene |
| FC | 0.148 | 802 | 8.29 | 1,2-dimethylbenzene |
| FC | 0.105 | 828 | 5.90 | 1,3-dimethylbenzene |
| FC | 0.235 | 855 | 13.14 | 1,4-dimethylbenzene |
4. Discussion
4.1. Effect of Surfactants on Coal Wettability
As can be seen in Table 1, after the samples were treated by APG and SDBS, the contact angles of all six coal samples decreased by 15–77 and 38–90%, respectively; while after being treated by PAM, the contact angles of coal samples increased by 18–72%, except for that of ZL and FC, which only decreased by 0.01 and 7%, respectively. Therefore, APG and SDBS can be used to improve the coal wettability, while PAM can weaken the coal wettability. As can be seen from Figure 10, SDBS is the most effective surfactant to decrease the contact angle and improve the coal wettability.
Figure 10.
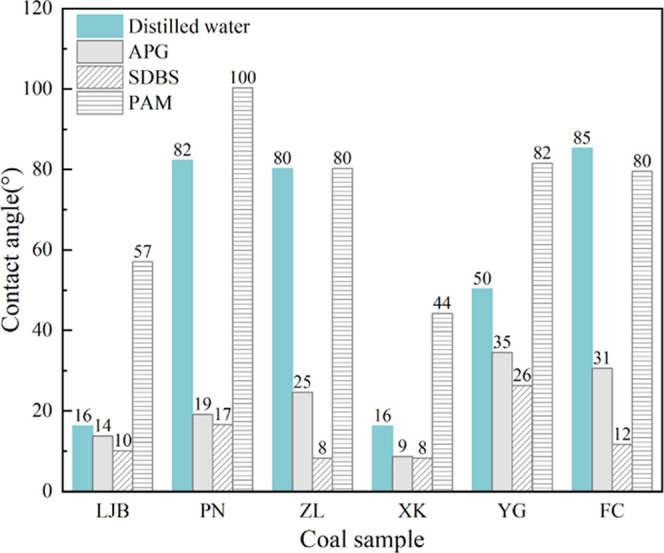
Contact angle of coal samples before and after treatment.
4.2. Main Influencing Factors of Coal Wettability
According to previous studies, coal wettability can be affected by the composition and chemical functional groups such as oxygen-containing functional groups, aliphatic chains, and aromatic hydrocarbon.35,48 Some scholars reported that hydroxyl, quartz, moisture, and ash in coal are hydrophilic factors, while aliphatic chain, aromatic hydrocarbon, volatile, and fixed carbon are hydrophobic factors.34,36,49 In this study, the main factors influencing coal wettability were calculated based on the grey relational analysis model. The content of moisture, ash, volatile, fixed carbon, functional groups, and the contact angle was input into MATLAB and the influence degree of these factors on coal wettability was obtained. The content of hydroxyl is the total content of OH···N, ring hydroxyl, OH···O, OH···π, and OH···OH, while the contact angle refers to the value before coal samples’ treatment. The calculation process is attached in Appendixes 1.1 and 2.1.
Table 8 shows the relational degree (ri) of each influencing factor and the contact angle obtained by MATLAB, where r1, r2, r3, r2, r4, r5, r6, r7, r8, r9, r10, r11, r12, and r13 are the relational degrees of −CH, −CH2, −CH3, methylbenzene, 1,2-dimethylbenzene, 1,3-dimethylbenzene, 1,4-dimethylbenzene, Vdaf, FCad, Mad, Aad, hydroxyl, and Si–O–Si with the contact angle, respectively. As presented in Table 7, r7, r2, r10, r11, r3, r13, r12, r8, r5, r1, r4, r9, and r6 decrease successively, which indicates that the influence of 1,4-dimethylbenzene, −CH2, Mad, Aad, −CH3, Si–O–Si, hydroxyl, Vdaf, 1,2-dimethylbenzene, −CH, methylbenzene, FCad, and 1,3-dimethylbenzene on coal wettability decreases in order. Among which, Mad, Aad, hydroxyl, and Si–O–Si are the hydrophilic factors and −CH2, 1,4-dimethylbenzene, −CH3, Vdaf, 1,2-dimethylbenzene, methylbenzene, −CH, FCad, and 1,3-dimethylbenzene are the hydrophobic factors. Therefore, it is concluded that Mad is the main hydrophilic factor of coal, and 1,4-dimethylbenzene is the main hydrophobic factor of coal.
Table 8. Relational Degree (ri) of Each Influencing Factor and the Contact Angle.
| r1 | r2 | r3 | r4 | r5 | r6 | r7 | r8 | r9 | r10 | r11 | r12 | r13 |
|---|---|---|---|---|---|---|---|---|---|---|---|---|
| 0.6027 | 0.6654 | 0.6195 | 0.5962 | 0.6059 | 0.5496 | 0.6722 | 0.6067 | 0.5890 | 0.6626 | 0.6348 | 0.6069 | 0.6173 |
4.3. Main Factors Affecting the Treatment Effect of the Surfactant
To obtain the main factors affecting the treatment effect of three surfactants on coal wettability, the dominance analysis method was applied. Specific related parameters and calculation programs are attached in Appendixes 1.2 and 2.2.
The incidence matrix (R) of influencing factors and contact angle was obtained by MATLAB
 |
In the abovementioned R matrix, the elements in the first to third rows represent the relational degree between each factor and the contact angle of the coal samples treated by APG, SDBS, and PAM, respectively. As listed in the R matrix, the elements in the third row are almost the largest, indicating that the physicochemical properties of coal affected the treatment effect of PAM on coal wettability the most. In the first row, r1,4 = 0.8316 is the largest, indicating that aromatic methylbenzene has the greatest influence on the treatment effect of APG. In the second row, r2,12 = 0.8597 is the largest, indicating that the hydroxyl content in coal was the main factor affecting the treatment effect of SDBS. In the third row, r3,12 = 0.9077 is the largest, indicating that the hydroxyl group has the greatest influence on the treatment effect of PAM. Since SDBS is the most effective surfactant to improve the coal wettability (see Section 4.1) and the influence of hydroxyl, −CH, 1,2-dimethylbenzene, methylbenzene, FCad, 1,4-dimethylbenzene, −CH3, Aad, Si–O–Si, 1,3-dimethylbenzene, Mad, −CH2, and Vdaf on its treatment effect decrease successively, it is concluded that an SDBS solution can be prepared based on the content of hydroxyl in coal. For coal with a low hydroxyl content, a higher concentration SDBS solution may be needed. In the process of water injection, the coal wettability can be improved by adding SDBS into the water, and then the efficiency of droplet capture of treated coal dust can be enhanced when spraying.
4.4. Implications for Field Application
In the fully mechanized coal mining face, the concentration of coal dust can reach up to 1000 mg/cm3. Due to the poor wettability of coal dust, the dedusting efficiency of water spray is not ideal.7−9 In this study, surfactants were used to treat the coal to improve the coal wettability so as to improve the wet dedusting efficiency. In the process of coal seam water injection, the coal wettability can be improved by adding a suitable surfactant into water. After that, when applying the spray dedusting technology, the floating coal dust with modified wettability and produced during the coal mining process can be more efficiently captured by water. Figure 11 shows the schematic diagram of dust suppression. Figure 12 shows the schematic of field implementation for future on-site operation. First, the surfactant solution was injected into the coal seam and high-pressure water was used to keep the pressure of the water injection borehole for 15 days.14 Then, the coal mining machine was used to mine the coal treated with the surfactant and the nozzle was opened on the hydraulic support to reduce coal dust. This paper provides an efficient way to select the most effective surfactant among different surfactants to improve the coal wettability and to investigate the main factors affecting the modification effect of surfactants. Considering the influence of coal properties on the modification effect of the surfactant, a suitable surfactant can be selected to treat coal and then to improve the wet dedusting efficiency.
Figure 11.
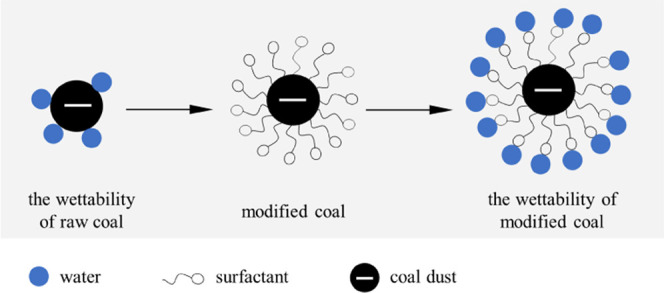
Schematic diagram of water capturing the coal dust.
Figure 12.
Schematic of the field operation process.
5. Conclusions
To investigate the main influencing physicochemical properties of coal on the coal wettability and the treatment effect of the surfactant, the coal–water contact angle was used as an index to evaluate the coal wettability, and three surfactants were applied to treat the coal. The relationship between basic physical properties, the chemical functional group structure of coal, and the contact angle was investigated by grey system theory. The main conclusions are as follows:
-
(1)
The coal wettability shows a high–low–high trend with the increase in the metamorphic degree. The wettability of long flame coal is the strongest and that of gas coal is the weakest. For the coal samples treated by APG and SDBS, the contact angle decreased by 15–77 and 38–90%, respectively. However, for the coal samples treated by PAM, except for the contact angles of ZL and FC, which only decreased by 0.01 and 7%, respectively, the contact angles of other samples increased by 18–72%. Thus, APG and SDBS can improve the coal wettability and PAM can weaken the coal wettability. The anionic surfactant SDBS is the most effective surfactant to improve the coal wettability, which can be used to improve wet dedusting efficiency such as coal seam water injection and water spray.
-
(2)
The results of the grey relational analysis show that the relational degree of 1,4-dimethylbenzene, −CH2, moisture, ash, −CH3, Si–O–Si, hydroxyl, volatile matter, 1,2-dimethylbenzene, −CH, methylbenzene, fixed carbon, and 1,3-dimethylbenzene with the contact angle decreases in order. Moisture is the main hydrophilic factor of coal and 1,4-dimethylbenzene is the main hydrophobic factor of coal.
-
(3)
The main factors affecting the treatment effect of APG, SDBS, and PAM are the aromatic methylbenzene, hydroxyl, and hydroxyl content of coal, respectively. Among these three surfactants, the treatment effect of PAM on coal wettability was affected by the physicochemical properties of coal the most. The most effective surfactant SDBS solution can be used to improve the coal wettability and prepared based on the hydroxyl content of coal. For coal with a low hydroxyl content, a higher concentration SDBS solution could be needed.
Acknowledgments
This research was supported by the National Natural Science Foundation of China (Nos. 51974300 and 51904291), the Fundamental Research Funds for the Central Universities (2021YCPY0206 and 2020ZDPY0224), the Six Talent Peaks Project in Jiangsu Province (GDZB-027), the Basic Research Program of Jiangsu Province (No. BK20190638), the Postgraduate Research & Practice Innovation Program of Jiangsu Province (Grant KYCX21_2474), and a project funded by the Priority Academic Program Development of Jiangsu Higher Education Institutions.
Appendix 1. Calculation Process of Grey System Theory
Grey system theory is a method that can be used to investigate the mathematical relationship between factors based on the characteristic data of the grey system and the explicit and implicit information in the data.50 In this study, two methods of grey system theory, relational analysis and dominance analysis, were used to calculate the main factors affecting the coal wettability and the treatment effect of different surfactants. The specific calculation process is as follows:
Appendix 1.1. Grey Relational Analysis Model
Grey relational analysis is a method that can measure the degree of correlation between factors based on the similarity or dissimilarity of the development trend of factors. The process of grey relational analysis in this study is as follows:
(1). Determine the Reference Sequence
| 1 |
where k is the number of coal samples, n = 1, 2, ..., 6, and the reference sequence is the contact angle of untreated coal samples.
(2). Determine the Comparison Sequence
| 2 |
where xi is the influencing factor of contact angle, and the parameters represented by xi are listed in Table 9.
Table 9. Parameters for Grey Relational Analysis.
| coal sample | LJB | PN | ZL | XK | YG | FC |
|---|---|---|---|---|---|---|
| contact angle x0 | 16.26 | 82.31 | 80.26 | 16.25 | 50.37 | 85.31 |
| –CH x1 | 15.08 | 18.29 | 16.73 | 9.4 | 18.64 | 11.88 |
| –CH2x2 | 17.79 | 23.62 | 57.42 | 64.61 | 60.85 | 63.53 |
| –CH3x3 | 18.7 | 51.91 | 20.5 | 25.99 | 14.88 | 24.58 |
| methylbenzene x4 | 21.29 | 28.32 | 27.7 | 8.51 | 26.23 | 18.07 |
| 1,2-dimethylbenzene x5 | 24.88 | 38.12 | 31.03 | 15.73 | 32.44 | 8.29 |
| 1,3-dimethylbenzene x6 | 10.41 | 0 | 0 | 1.71 | 6.89 | 5.9 |
| 1,4-dimethylbenzene x7 | 10.23 | 33.56 | 19.54 | 7.96 | 18.91 | 13.14 |
| Vdafx8 | 8.44 | 16.25 | 20.38 | 44.47 | 11.98 | 35.36 |
| FCadx9 | 75.95 | 73.59 | 76.22 | 41.09 | 71.06 | 59.46 |
| Madx10 | 2.66 | 0.94 | 0.89 | 10.62 | 1.34 | 1.84 |
| Aadx11 | 15.58 | 13.66 | 4.24 | 34.52 | 20.54 | 11.4 |
| hydroxyl x12 | 55.21 | 56.83 | 53.81 | 58.2 | 75.53 | 78.3 |
| Si–O–Si x13 | 21.12 | 12.87 | 2.1 | 32.8 | 15.92 | 8.81 |
(3). Initialization of the Sequence
To eliminate the dimension of the sequence, the sequence x = (x(1), x(2), ..., x(n)) was initialized by eq 3
| 3 |
where x̅ is the initialization sequence of the original sequence.
However, because the contact angle decreases with the increase in hydroxyl, quartz, moisture, and ash content,51eq 4 was used to initialize them
| 4 |
(4). Calculate the Grey Relational Coefficient
| 5 |
where ξi(k) is
the relational coefficient of the comparison sequence xi and the reference sequence x0 when the coal sample number is k. It is an index to characterize the relational degree between the
comparison sequence and the reference sequence; ρ∈[0,1],
is the resolution coefficient, and generally ρ = 0.5.52,53 and
and  are the minimum difference
between two levels and the maximum difference between two levels,
respectively.
(5) Since each coal sample in eq 5 has a relational coefficient, the information is scattered and cannot be directly compared, it is necessary to calculate the grey relational degree
| 6 |
where ri is the relational degree between the influencing factors and the contact angle. The larger the value of the relational degree, the better the relationship between the influencing factors and contact angle.
Based on the grey relational analysis model and the parameters listed in Table 9, through the calculation of the MATLAB program (see Appendix 2.1), the relational degree can be obtained, as presented in Table 8.
Appendix 1.2. Dominance Analysis
When there is more than one reference sequence, the dominance analysis method needs to be used to calculate the relational degree. The contact angles of coal samples under three different conditions were measured, thus there are 3 reference sequences y1, y2, y3, and 13 comparison sequences x1, x2, ..., x13. The parameters represented by each sequence are listed in Table 10. Defining ri,j as the relational degree of the comparison sequence xj to the reference sequence yi, then the incidence matrix R = (ri,j)3×13 could be constructed. According to the elements in the matrix R, the main influencing factors of the contact angle under different conditions can be analyzed, and the main factors affecting the treatment effect of three surfactants on coal can be obtained. When a row element is larger than other row elements, the parent element corresponding to this row is the dominant parent element. When a column element is larger than other column elements, the corresponding subfactor of this column is the dominant subfactor. The data in Table 10 were input into MATLAB and the MATLAB program was run for dominance analysis (see Appendix 2.2), by which the matrix R could be obtained.
Table 10. Parameters for Dominance Analysis.
| coal sample | LJB | PN | ZL | XK | YG | FC |
|---|---|---|---|---|---|---|
| contact angle (APG) y1 | 13.79 | 19.11 | 24.59 | 8.66 | 34.55 | 30.58 |
| contact angle (SDBS) y2 | 10.12 | 16.63 | 8.29 | 8.25 | 26.34 | 11.65 |
| contact angle (PAM) y3 | 57.07 | 100.32 | 80.25 | 44.24 | 81.56 | 79.53 |
| –CH x1 | 15.08 | 18.29 | 16.73 | 9.4 | 18.64 | 11.88 |
| –CH2x2 | 17.79 | 23.62 | 57.42 | 64.61 | 60.85 | 63.53 |
| –CH3x3 | 18.7 | 51.91 | 20.5 | 25.99 | 14.88 | 24.58 |
| methylbenzene x4 | 21.29 | 28.32 | 27.7 | 8.51 | 26.23 | 18.07 |
| 1,2-dimethylbenzene x5 | 24.88 | 38.12 | 31.03 | 15.73 | 32.44 | 8.29 |
| 1,3-dimethylbenzene x6 | 10.41 | 0 | 0 | 1.71 | 6.89 | 5.9 |
| 1,4-dimethylbenzene x7 | 10.23 | 33.56 | 19.54 | 7.96 | 18.91 | 13.14 |
| Vdafx8 | 8.44 | 16.25 | 20.38 | 44.47 | 11.98 | 35.36 |
| FCadx9 | 75.95 | 73.59 | 76.22 | 41.09 | 71.06 | 59.46 |
| Madx10 | 2.66 | 0.94 | 0.89 | 10.62 | 1.34 | 1.84 |
| Aadx11 | 15.58 | 13.66 | 4.24 | 34.52 | 20.54 | 11.4 |
| hydroxyl x12 | 55.21 | 56.83 | 53.81 | 58.2 | 75.53 | 78.3 |
| Si–O–Si x13 | 21.12 | 12.87 | 2.1 | 32.8 | 15.92 | 8.81 |
Appendix 2. MATLAB Program for Calculation
Appendix 2.1. MATLAB Program of Grey Relational Analysis
save x
clc, clear
load x
for i=1:10
x(i,:)=x(i,:)/x(i,1);
end
for i=11:14
x(i,:)=x(i,1)./x(i,:);
end
data=x;
n=size(data,1);
ck=data(1,:);m1=size(ck,1);
bj=data(2:n,:);m2=size(bj,1);
for i=1:m1
for j=1:m2
t(j,:)=bj(j,:)-ck(i,:);
end
jc1=min(min(abs(t’)));jc2=max(max(abs(t’)));
rho=0.5;
ksi=(jc1+rho*jc2)./(abs(t)+rho*jc2);
rt=sum(ksi’)/size(ksi,2);
r(i,:)=rt;
end r
Appendix 2.1. MATLAB Program of dominance analysis
save data
clc, clear
load data
n=size(data,1);
for i=1:n
data(i,:)=data(i,:)/data(i,1);
end
ck=data(14:n,:);m1=size(ck,1);
bj=data(1:13,:);m2=size(bj,1);
for i=1:m1
for j=1:m2
t(j,:)=bj(j,:)-ck(i,:);
end
jc1=min(min(abs(t’)));jc2=max(max(abs(t’)));
rho=0.5;
ksi=(jc1+rho*jc2)./(abs(t)+rho*jc2);
rt=sum(ksi’)/size(ksi,2);
r(i,:)=rt;
end r
Author Contributions
§ Co-first author: X.L. and B.W. contributed equally to this work.
The authors declare no competing financial interest.
References
- Cai P.; Nie W.; Chen D.; Yang S.; Liu Z. Effect of air flowrate on pollutant dispersion pattern of coal dust particles at fully mechanized mining face based on numerical simulation. Fuel 2019, 239, 623–635. 10.1016/j.fuel.2018.11.030. [DOI] [Google Scholar]
- Gianoncelli A.; Rizzardi C.; Salomon D.; Canzonieri V.; Pascolo L. Nano-imaging of environmental dust in human lung tissue by soft and hard X-ray fluorescence microscopy. Spectrochim. Acta, Part B 2018, 147, 71–78. 10.1016/j.sab.2018.05.019. [DOI] [Google Scholar]
- Fang X.; Yuan L.; Jiang B.; Zhu W.; Ren B.; Chen M.; Mu M.; Yu G.; Li P. Effect of water-fog particle size on dust fall efficiency of mechanized excavation face in coal mines. J. Cleaner Prod. 2020, 254, 120146 10.1016/j.jclepro.2020.120146. [DOI] [Google Scholar]
- Chang P.; Xu G.; Chen Y.; Ghosh A.; Moridi M. A. Improving coal powder wettability using electrolyte assisted surfactant solution. Colloids Surf., A 2021, 613, 126042 10.1016/j.colsurfa.2020.126042. [DOI] [Google Scholar]
- Bao Q.; Liu Y.; Li C.; Jia L.; Yan J.; Yuan M.; Zhou W. Development and performance characterization of a hybrid dust suppressant based on sodium ligninsulfonate modification. Starch-Stärke 2021, 73, 2000207 10.1002/star.202000207. [DOI] [Google Scholar]
- Chang P.; Zhao Z.; Xu G.; Ghosh A.; Huang J.; Yang T. Evaluation of the coal dust suppression efficiency of different surfactants: A factorial experiment. Colloids Surf., A 2020, 595, 124686 10.1016/j.colsurfa.2020.124686. [DOI] [Google Scholar]
- Wang J.; Zhou G.; Wei X.; Wang S. Experimental characterization of multi-nozzle atomization interference for dust reduction between hydraulic supports at a fully mechanized coal mining face. Environ. Sci. Pollut. Res. 2019, 26, 10023–10036. 10.1007/s11356-019-04413-w. [DOI] [PubMed] [Google Scholar]
- Bao Q.; Nie W.; Liu C.; Zhang H.; Wang H.; Jin H.; Yan J.; Liu Q. The preparation of a novel hydrogel based on crosslinked polymers for suppressing coal dusts. J. Cleaner Prod. 2020, 249, 119343 10.1016/j.jclepro.2019.119343. [DOI] [Google Scholar]
- Ji H.; Peng X.; Yao J.; Mao Y.; Hou Y.; Sheng Z. Insight into the influence of small organic molecules on the wettability of coal. Fuel 2021, 294, 120537 10.1016/j.fuel.2021.120537. [DOI] [Google Scholar]
- Lu Y.; Li H.; Lu J. X.; Shi S.; Wang G.; Ye Q.; Li R.; Zhu X. Clean up water blocking damage in coalbed methane reservoirs by microwave heating: Laboratory studies. Process Saf. Environ. Prot. 2020, 138, 292–299. 10.1016/j.psep.2020.04.007. [DOI] [Google Scholar]
- Lyu S.; Chen X.; Shah S.-M.; Wu X. Experimental study of influence of natural surfactant soybean phospholipid on wettability of high-rank coal. Fuel 2019, 239, 1–12. 10.1016/j.fuel.2018.11.005. [DOI] [Google Scholar]
- Jia L.; Li K.; Zhou J.; Yan Z.; Wang Y.; Mahlalela B.-M. Experimental study on enhancing coal-bed methane production by wettability alteration to gas wetness. Fuel 2019, 255, 115860 10.1016/j.fuel.2019.115860. [DOI] [Google Scholar]
- Ni G.; Li Z.; Xie H. The mechanism and relief method of the coal seam water blocking effect (WBE) based on the surfactants. Powder Technol. 2018, 323, 60–68. 10.1016/j.powtec.2017.09.044. [DOI] [Google Scholar]
- Li J.; Li K.; Shi X.; Zhao L.; Linghu J. Application of gas wettability alteration to improve methane drainage performance: A case study. Int. J. Min. Sci. Technol. 2021, 32, 621–629. 10.1016/j.ijmst.2021.04.002. [DOI] [Google Scholar]
- Shi G.-Q.; Han C.; Wang Y.-m.; Wang H.-T. Experimental study on synergistic wetting of a coal dust with dust suppressant compounded with noncationic surfactants and its mechanism analysis. Powder Technol. 2019, 356, 1077–1086. 10.1016/j.powtec.2019.09.040. [DOI] [Google Scholar]
- Han W.; Zhou G.; Zhang Q.; Pan H.; Liu D. Experimental study on modification of physicochemical characteristics of acidified coal by surfactants and ionic liquids. Fuel 2020, 266, 116966 10.1016/j.fuel.2019.116966. [DOI] [Google Scholar]
- Zhang H.; Nie W.; Yan J.; Bao Q.; Wang H.; Jin H.; Peng H.; Chen D.; Liu Z.; Liu Q. Preparation and performance study of a novel polymeric spraying dust suppression agent with enhanced wetting and coagulation properties for coal mine. Powder Technol. 2020, 364, 901–914. 10.1016/j.powtec.2019.10.082. [DOI] [Google Scholar]
- Ni G.; Wang H.; Nie B.; Wang Y.; Dou H.; Lu S.; Wang G. Research of wetting selectivity and wetting effect of imidazole ionic liquids on coal. Fuel 2021, 286, 119331 10.1016/j.fuel.2020.119331. [DOI] [Google Scholar]
- Wang X.; Yuan S.; Jiang B. Experimental investigation of the wetting ability of surfactants to coals dust based on physical chemistry characteristics of the different coal samples. Adv. Powder Technol. 2019, 30, 1696–1708. 10.1016/j.apt.2019.05.021. [DOI] [Google Scholar]
- Jiang B.; Sun Q.; Ni G. Study on the wettability of a composite solution based on surface structures of coal. ACS Omega 2020, 5, 28341–28350. 10.1021/acsomega.0c04345. [DOI] [PMC free article] [PubMed] [Google Scholar]
- Ni G.; Sun Q.; Xue M.; Wang H.; Xu Y.; Cheng W.; Wang G. Effect of NaCl-SDS compound solution on the wettability and functional groups of coal. Fuel 2019, 257, 116077 10.1016/j.fuel.2019.116077. [DOI] [Google Scholar]
- Zhou Q.; Qin B.; Ma D.; Jiang N. Novel technology for synergetic dust suppression using surfactant-magnetized water in underground coal mines. Process Saf. Environ. Prot. 2017, 109, 631–638. 10.1016/j.psep.2017.05.013. [DOI] [Google Scholar]
- Sang F.; Yan S.; Wang G.; Ma Z.; Li J.; Ju S. The effect of microemulsion on coal wetting characteristics and physicochemical structure. Colloid Interface Sci. Commun. 2020, 39, 100335 10.1016/j.colcom.2020.100335. [DOI] [Google Scholar]
- Ma Y.; Sun J.; Ding J.; Liu Z. Synthesis and characterization of a penetrating and pre-wetting agent for coal seam water injection. Powder Technol. 2021, 380, 368–376. 10.1016/j.powtec.2020.11.008. [DOI] [Google Scholar]
- Yang M.; Lu Y.; Ge Z.; Zhou Z.; Chai C.; Wang H.; Zhang L.; Bo T. Viscoelastic surfactant fracturing fluids for use in coal seams: Effects of surfactant composition and formulation. Chem. Eng. Sci. 2020, 215, 115370 10.1016/j.ces.2019.115370. [DOI] [Google Scholar]
- Wang G.; Huang T.; Yan S.; Liu X. Experimental study of the fracturing-wetting effect of VES fracturing fluid for the coal seam water injection. J. Mol. Liq. 2019, 295, 111715 10.1016/j.molliq.2019.111715. [DOI] [Google Scholar]
- Liu C.; Sang S.; Fan X.; Zhang K.; Song F.; Cui X.; Wang H. Influences of pressures and temperatures on pore structures of different rank coals during CO2 geological storage process. Fuel 2020, 259, 116273 10.1016/j.fuel.2019.116273. [DOI] [Google Scholar]
- Zheng L.; Liu Z.; Li D.; Wang H.; Zhang Q. Micromechanism analysis of surfactant wetting of coal based on C-13 NMR experiments. Acs Omega 2021, 6, 1378–1390. 10.1021/acsomega.0c05005. [DOI] [PMC free article] [PubMed] [Google Scholar]
- Zhou Q.; Xu G.; Chen Y.; Qin B.; Zhao Z.; Guo C. The development of an optimized evaluation system for improving coal dust suppression efficiency using aqueous solution sprays. Colloids Surf., A 2020, 602, 125104 10.1016/j.colsurfa.2020.125104. [DOI] [Google Scholar]
- Ma Y.; Wang Y.; Zhang Q. Experimental study for influence of surfactants chemical microstructures on wetting effect about coal dust in Tongchuan Mining Area. J. Chem. 2020, 2020, 4176186 10.1155/2020/4176186. [DOI] [Google Scholar]
- Xu C.; Wang D.; Wang H.; Ma L.; Zhu X.; Zhu Y.; Zhang Y.; Liu F. Experimental investigation of coal dust wetting ability of anionic surfactants with different structures. Process Saf. Environ. Prot. 2019, 121, 69–76. 10.1016/j.psep.2018.10.010. [DOI] [Google Scholar]
- Arif M.; Jones F.; Barifcani A.; Iglauer S. Influence of surface chemistry on interfacial properties of low to high rank coal seams. Fuel 2017, 194, 211–221. 10.1016/j.fuel.2017.01.027. [DOI] [Google Scholar]
- Arif M.; Barifcani A.; Lebedev M.; Iglauer S. CO2-wettability of low to high rank coal seams: Implications for carbon sequestration and enhanced methane recovery. Fuel 2016, 181, 680–689. 10.1016/j.fuel.2016.05.053. [DOI] [Google Scholar]
- Hongchao X.; Guanhua H.; Jingna X.; Weimin C.; Meng X.; Yuhang X.; Hui W.; Gang W. The effect of SDS synergistic composite acidification on the chemical structure and wetting characteristics of coal. Powder Technol. 2020, 367, 253–265. 10.1016/j.powtec.2020.03.056. [DOI] [Google Scholar]
- Xu C.; Wang D.; Wang H.; Xin H.; Ma L.; Zhu X.; Zhang Y.; Wang Q. Effects of chemical properties of coal dust on its wettability. Powder Technol. 2017, 318, 33–39. 10.1016/j.powtec.2017.05.028. [DOI] [Google Scholar]
- Wang H.; Zhang L.; Wang D.; He X. Experimental investigation on the wettability of respirable coal dust based on infrared spectroscopy and contact angle analysis. Adv. Powder Technol. 2017, 28, 3130–3139. 10.1016/j.apt.2017.09.018. [DOI] [Google Scholar]
- Semenova S.-A.; Patrakov Y.-F. Dependence of the water wettability of the surfaces of fossil coals on their structure and properties. Solid Fuel Chem. 2017, 51, 135–140. 10.3103/S0361521917030090. [DOI] [Google Scholar]
- Shi Q.; Qin B.; Bi Q.; Qu B. Changes in the surface structure of coal caused by igneous intrusions and their effect on the wettability. Energy Fuels 2018, 32, 9371–9379. 10.1021/acs.energyfuels.8b02439. [DOI] [Google Scholar]
- Weng S.; Xu Y.. Fourier Transform Infrared Spectroscopy, 2nd ed.; Chemical Industry Press: Beijing, 2019; Vol. 478, pp 224–231. [Google Scholar]
- Li Q.; Lin B.; Zhao C.; Wu W. Chemical structure analysis of coal char surface based on Fourier-transform infrared spectrometer. Proc. Chin. Soc. Electr. Eng. 2011, 31, 46–52. 10.13334/j.0258-8013.pcsee.2011.32.003. [DOI] [Google Scholar]
- Zhao J.; Deng J.; Chen L.; Wang T.; Song J.; Zhang Y.; Shu C.; Zeng Q. Correlation analysis of the functional groups and exothermic characteristics of bituminous coal molecules during high-temperature oxidation. Energy 2019, 181, 136–147. 10.1016/j.energy.2019.05.158. [DOI] [Google Scholar]
- Jingna X.; Ni G.; Hongchao X.; Shang L.; Qian S.; Kai D. The effect of adding surfactant to the treating acid on the chemical properties of an acid-treated coal. Powder Technol. 2019, 356, 263–272. 10.1016/j.powtec.2019.08.039. [DOI] [Google Scholar]
- He X.; Liu X.; Nie B.; Song D. FTIR and Raman spectroscopy characterization of functional groups in various rank coals. Fuel 2017, 206, 555–563. 10.1016/j.fuel.2017.05.101. [DOI] [Google Scholar]
- Ibarra J.; Muoz E.; Moliner R. FTIR study of the evolution of coal structure during the coalification process. Org. Geochem. 1996, 24, 725–735. 10.1016/0146-6380(96)00063-0. [DOI] [Google Scholar]
- Jiang J.; Yang W.; Cheng Y.; Liu Z.; Zhang Q.; Zhao K. Molecular structure characterization of middle-high rank coal via XRD, Raman and FTIR spectroscopy: Implications for coalification. Fuel 2019, 239, 559–572. 10.1016/j.fuel.2018.11.057. [DOI] [Google Scholar]
- Zhang L.; Hu S.; Chen Q.; Xiao L.; Syed-Hassan S.; Jiang L.; Wang Y.; Su S.; Xiang J. Molecular structure characterization of the tetrahydrofuran-microwave-extracted portions from three Chinese low-rank coals. Fuel 2017, 189, 178–185. 10.1016/j.fuel.2016.10.082. [DOI] [Google Scholar]
- Song H.; Liu G.; Zhang J.; Wu J. Pyrolysis characteristics and kinetics of low rank coals by TG-FTIR method. Fuel Process. Technol. 2017, 156, 454–460. 10.1016/j.fuproc.2016.10.008. [DOI] [Google Scholar]
- Zhou G.; Xu C.; Cheng W.; Zhang Q.; Nie W. Effects of oxygen element and oxygen-containing functional groups on surface wettability of coal dust with various metamorphic degrees based on XPS experiment. J. Anal. Methods Chem. 2015, 2015, 467242 10.1155/2015/467242. [DOI] [PMC free article] [PubMed] [Google Scholar]
- Su X.; Ding R.; Zhuang X. Characteristics of dust in coal mines in central North China and its research significance. ACS Omega 2020, 5, 9233–9250. 10.1021/acsomega.0c00078. [DOI] [PMC free article] [PubMed] [Google Scholar]
- Lu J.; Ren L.; Rong D.; Guo X. Assessment of coal mine gas explosion risk based on grey-matter element model. China Saf. Sci. J. 2021, 31, 99–105. 10.16265/j.cnki.issn1003-3033.2021.02.014. [DOI] [Google Scholar]
- Liao X.; Wang L.; Zhu J.; Chu P.; Liu Q.; Yang T. Experimental study on the wettability of tectonic soft coal in Huaibei Mining Area, China. Energy Fuels 2021, 35, 6585–6599. 10.1021/acs.energyfuels.0c04329. [DOI] [Google Scholar]
- Xia A.; Liu J.. Mathematical Modeling and MATLAB Application; Beijing University of Technology Press: Beijing, 2016; p 128. [Google Scholar]
- Zhou P.; Yao Y.; Ai Y.; Liu A.; Xu Z.; Xie J. Grey correlation analysis of factors influencing maldistribution in feeding device of copper flash smelting. J. Cent. South Univ. 2012, 19, 1938–1945. 10.1007/s11771-012-1229-5. [DOI] [Google Scholar]


