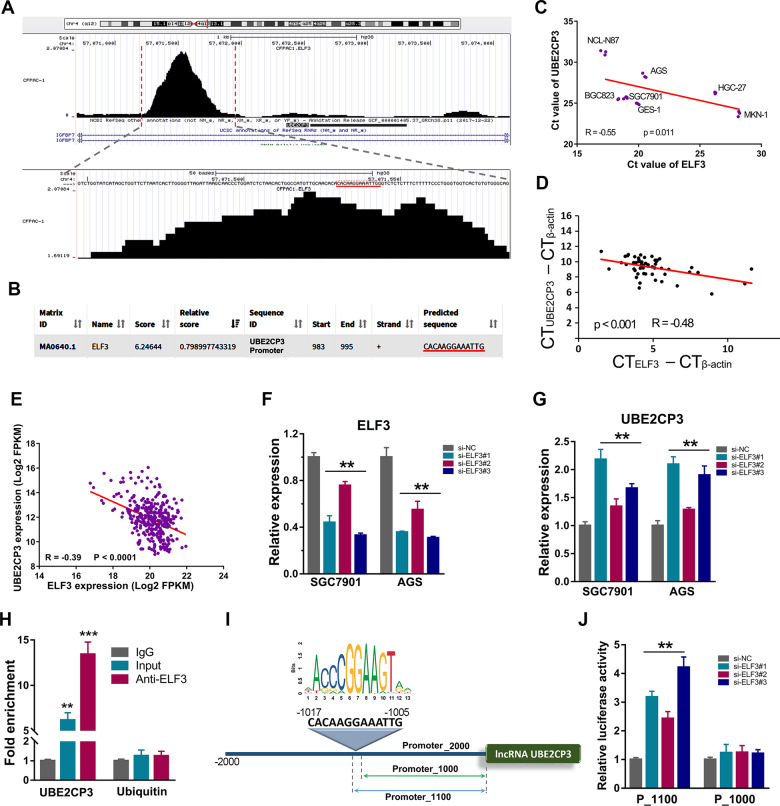
Fig. 7. UBE2CP3 was negatively regulated by transcription factor ELF3 in GC.
A The CHIP-seq data of transcription factor ELF3 was visualized through the Cistrome website. The center of the peak located at UBE2CP3 promoter contains a sequence of CACAAGGAAATTG. B The 2000 bp-length of UBE2CP3 promoter was analyzed by JASPAR web tool to predicted possible ELF3 binding sites. C Co-expression analysis of UBE2CP3 and ELF3 in GC cell lines using Ct value. The Ct value (n = 3) of UBE2CP3 and ELF3 in each GC cell line was obtained from qRT-PCR assay. The P value was estimated using Pearson correlation test. D The co-expression of UBE2CP3 and ELF3 was analyzed by qRT-PCR analysis in 30 paired of GC tissues. The P value was estimated using Pearson correlation test. E The co-expression of UBE2CP3 and ELF3 (log2FPKM value) was analyzed in the GC tissues from TCGA cohort. The P value was estimated using Pearson correlation test. F The knockdown efficiency of ELF3 in GC cell lines was verified by qRT-PCR assay. The P values were estimated using one-way ANOVA test. **P < 0.01. G UBE2CP3 expression was examined after silencing ELF3 expression in GC cell lines by qRT-PCR assay. The P values were estimated using one-way ANOVA test. **P < 0.01. H The CHIP-qPCR analysis in SGC7901 cells showed that the abundance of promoter fragment of UBE2CP3 pulled down by anti-ELF3 was much higher than that of the control IgG group. The P values were estimated using two-tailed t test. **P < 0.01. I The schematic diagram of truncated UBE2CP3 promoter (none ELF3 binding site) and the UBE2CP3 promoter containing ELF3 binding site. J GC cell line SGC7901 was co-transfected with siRNAs targeting ELF3 and luciferase reporter vector. After 48 h of incubation, luciferase activity was measured. The P values were estimated using two-tailed t test. **P < 0.01.

