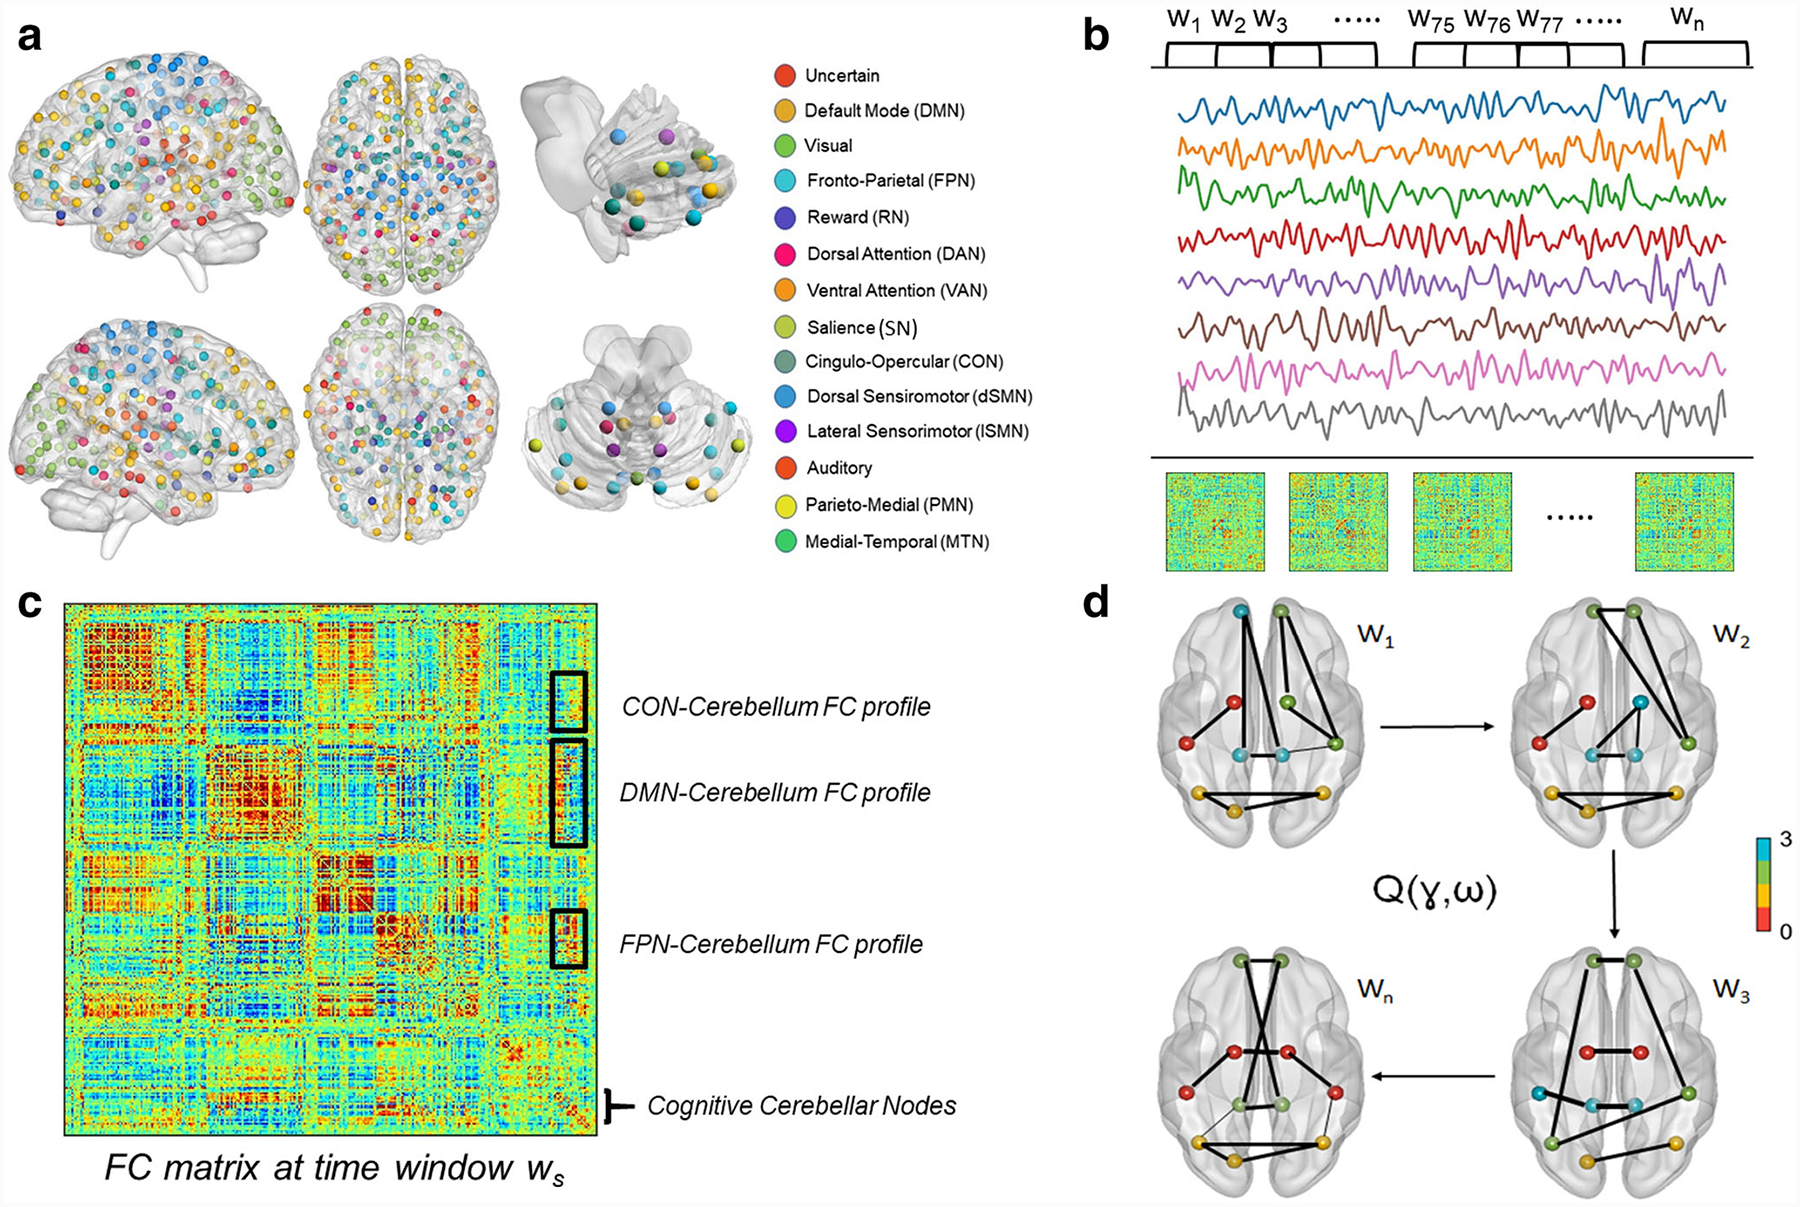
Fig. 1.

Schematic overview of the main methods used in this study. a Whole-brain parcellation using functionally defined regions of interest with an improved representation of the cerebellum and the subcortex. b BOLD signals from all ROIs were segmented into overlapping windows using the tapered sliding window analysis, and a whole-brain FC matrix was constructed by computing pairwise Pearson’s correlation in each window. c An example FC matrix in an arbitrary time window ws. The FC profile between distinct cerebral cognitive networks and the cerebellum is a sub-matrix (shown as boxes marked by black lines) containing the FC weights between its constituent nodes and every node in the cognitive cerebellum. Then, temporal variability of FC was calculated as the extent of variation of cerebro-cerebellar FC profiles across time windows. d Maximizing the multilayer modularity quality function Q(γ,ω) helps detecting the optimal community assignment for each node in each window. Using the optimal community structure, we calculated flexibility as the proportion of time a node changes its community assignment in time. Also, we calculated integration as the average probability for a node to be assigned to the same community with nodes outside its native system. Brain networks were visualized with the BrainNet Viewer toolbox http://www.nitrc.org/projects/bnv/ [60]
