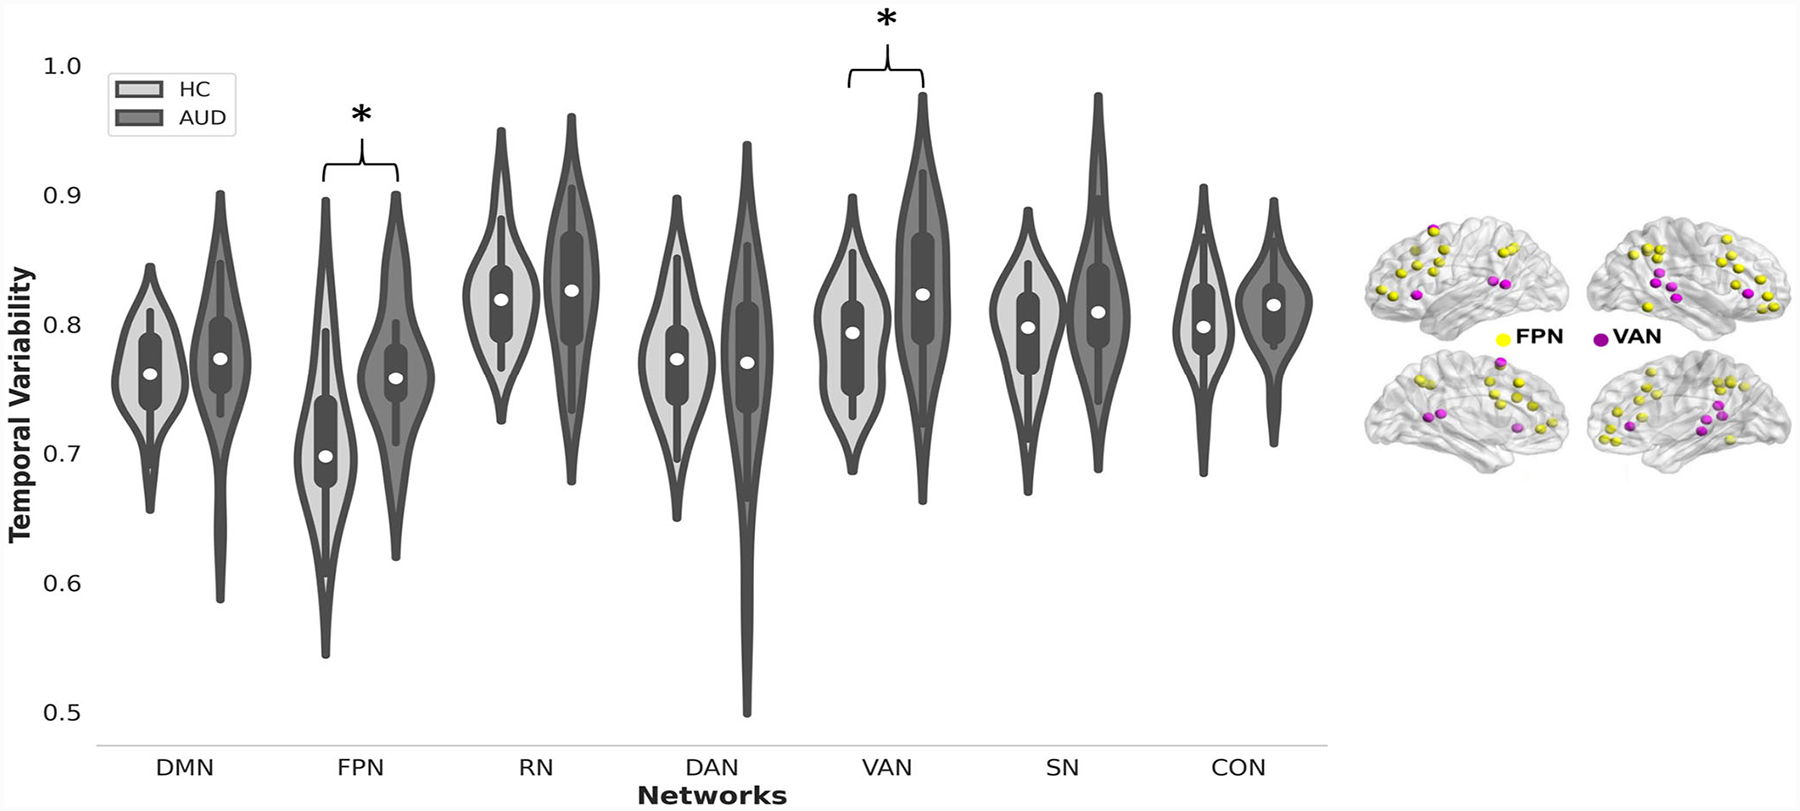
Fig. 2.

(Left) Violin plots of temporal variability of FC between the cerebellum and seven large-scale cognitive networks for the AUD group and controls. Asterisk indicates p < 0.05 (FDR corrected) for group differences. (Right) Brain plot of the frontoparietal and ventral attention networks
