

Abstract
Reactive oxygen species (ROS) are cell signaling molecules synthesized inside the cells as a response to routine metabolic processes. In stress conditions such as ultraviolet radiation (UVR), ROS concentration increases several folds in the cells that become toxic for the cell survival. Here we present the method for in vivo detection of ROS by using an oxidant-sensing probe 2’,7’-dichlorodihydrofluorescein diacetate (DCFH-DA) in cyanobacteria. This method provides reliable, simple, rapid and cost effective means for detection of ROS in cyanobacteria.
Keywords: Reactive oxygen species, 2’, 7’-Dichlorodihydrofluorescein diacetate, Cyanobacteria, Ultraviolet radiation, Oxidative damage
Background
Cyanobacteria are the most ancient oxygenic photoautotrophs; they play an important role in the biomass production in both aquatic and terrestrial ecosystems and serve as source of various value-added products ( Vaishampayan et al., 2001 ; Häder et al., 2007 ; Fischer, 2008). In recent years the depletion of the ozone layer has resulted in an increase in solar ultraviolet radiation (UVR) influx, which is harmful to all organisms residing on Earth including cyanobacteria (Holzinger and Lutz, 2006). The UVR harms cyanobacteria directly by acting on DNA/proteins or indirectly through oxidative damage from reactive oxygen species (ROS) (He and Häder, 2002). In plants, algal and mammalian cells various fluorescence and chemiluminescence methods have been used for detecting ROS (Crow, 1997; He and Häder, 2002; Soh, 2006; Wu et al., 2007 ; Palomero et al., 2008 ).
2’,7’-Dichlorodihydrofluorescein diacetate (DCFH-DA) is a non-fluorescent, cell-permeable dye which is hydrolyzed intracellularly into its polar, but non-fluorescent form DCFH on the action of cellular esterases and thus is retained in the cell. Oxidation of DCFH by the action of intracellular ROS and other peroxides turns the molecule into its highly fluorescent form 2’,7’-dichlorofluorescein (DCF) that can be detected by various fluorescent methods (He and Häder, 2002; Rastogi et al., 2010 ; Singh et al., 2014 ) (Figure 1). Although DCFH-DA is widely used for the detection of ROS, it should be noted, however, that the dye cannot be used as an indicator for a specific form of ROS ( Marchesi et al., 1999 ).
Figure 1. Mechanism of action of DCFH-DA probe inside the cell.

(Adapted from He and Häder, 2002)
Materials and Reagents
2 ml RNase, DNase free microcentrifuge tube (Thermo Fisher Scientific, InvitrogenTM, catalog number: AM12425)
Glass microscope slides (Fisher Scientific, catalog number: 12-544-4)
Glass microscope coverslips (Fisher Scientific, catalog number: S17525B)
Millipore membrane filter (EMD Millipore, catalog number: HAWP04700)
Cuvette (fluorescence spectroscopy) 3 ml (Hellma, catalog number: 101-QS)
-
Cyanobacterial cells e.g., Nostoc sp. strain HKAR-2
Note: Nostoc sp. strain HKAR-2, an autotrophic, filamentous and heterocystous cyanobacterium, was grown under axenic conditions in nitrogen-free liquid BGA medium (Safferman and Morris, 1964) at 20 ± 2 °C under continuous white light (12 ± 2 Wm-2) to an OD750 of 0.8 to 0.9 (exponential growth phase) which was measured using quartz cuvette in a spectrophotometer.
Nail varnish (Lakme)
Potassium phosphate dibasic anhydrous (K2HPO4)
Potassium phosphate monobasic (KH2PO4)
2’,7’-Dichlorodihydrofluorescein diacetate (DCFH-DA) (Sigma-Aldrich, catalog number: D6883)
100% ethanol (Sigma-Aldrich, catalog number: 459836)
50 mM phosphate buffer (see Recipes)
2 mM 2’,7’-dichlorodihydrofluorescein diacetate (DCFH-DA) stock solution (see Recipes)
Equipment
Glass Petri-dishes (Corning, catalog number: 3160-102)
Measuring cylinder
295 nm UV cut-off filter (Ultraphan, Digefra, Munich, Germany) to facilitate the desired wavebands of UV-B (280-315 nm), UV-A (315-400 nm) and PAR (400-700 nm)
UV-treatment chamber fitted with UV-B (Philips Ultraviolet-B TL 40 W: 12, Philips Lighting, model: TL 40W/12 RS SLV/25), UV-A (Philips Ultraviolet-A TL 40 W: 12, Philips Lighting, model: TL-K 40W/10-R UV-A) and PAR (55.08 ± 9.18 μmol m-2 sec-1) (OSRAM L 36 W: 32 Lumilux de luxe warm white and Radium NL 36 W: 26 Universal white, Germany) lamps
Glass rod (Fisher Scientific, catalog number: 11-380A)
Magnetic stirrer (REMI ELECTROTECHNIK, model: 2 MLH)
Refrigerated centrifuge (REMI ELECTROTECHNIK, model: CM-12 PLUS)
Shaker
Fluorescence microscope (Nikon eclipse Ni fluorescence microscope processed by NIS Elements (BR))
Fluorescence spectrophotometer (Agilent Technologies, model: Cary Eclipse)
Spectrophotometer (Hitachi High-Technologies, model: U-2900, Double beam spectrophotometer)
Quartz cuvette (3.5 ml) (Cole-Parmer, JENWAY, catalog number: 035 028)
Software
NIS-Elements (BR) imaging software (Nikon)
SigmaPlot 11 software
Procedure
A flow chart of the sample preparation is shown in Figure 2.
Figure 2. Flow chart showing various steps involved in the protocol.
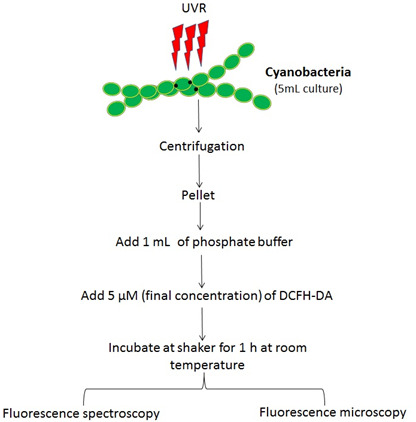
Transfer 100 ml of cyanobacterial culture to sterile glass Petri-dishes with the help of a measuring cylinder. Cover the Petri dishes with a 295 nm UV cut-off filter and transfer them to a UV light treatment chamber.
Irradiate the cyanobacteria with UV-A, UV-B and PAR and maintain the temperature of the chamber at 25 ± 2 °C to avoid a heating effect. Mix the culture with a glass rod at regular intervals or use magnetic stirrer (15-20 rpm) to avoid self-shading of the cells.
After desired time intervals (hereafter 12 h and 24 h), take 5 ml of sample and harvest cells by centrifugation at 9,050 × g for 20 min at room temperature.
Resuspend the cell pellet in 1 ml phosphate buffer (see Recipes).
Add 2.5 µl of 2 mM 2’,7’-dichlorodihydrofluorescein diacetate (DCFH-DA) solubilized in ethanol (see Recipes) to the sample mixture.
Incubate the sample mixture on a shaker (15 rpm) at room temperature in the dark for 1 h.
-
After 1 h incubation
For fluorescence microscopy: Take a clean glass slide and add 30 µl of culture. Cover the cells with a glass cover slip. Seal the slide with nail varnish to avoid drying out. Cells were visualized under a fluorescence microscope using an excitation wavelength of 488 nm and emission was detected in the range of 500-600 nm (Figure 3).
For fluorescence spectroscopy: 3 ml of liquid sample was added to a cuvette for fluorescence spectrophotometric analysis (Figure 4). The cuvette was placed in fluorescence spectrophotometer and the sample was excited at 485 nm. Emission was recorded in the range of 500-600 nm. The exposure time was limited to 600 msec to reduce the damage of cells. Fluorescence was measured in terms of emitted fluorescence intensity after different durations of stress exposure.
Figure 3. Fluorescence images of UV-A + UV-B + PAR exposed Nostoc sp. strain HKAR-2 showing green DCF fluorescence after reaction with ROS.

Negative control (containing DCFH-DA only; showing the basal level of fluorescence) (A); fluorescence at 0 h (B); 12 h UV-A + UV-B + PAR exposure (C); 24 h UV-A + UV-B + PAR exposure (D). PAR: Photosynthetically active radiation. Scale bar =10 µm.
Figure 4. Fluorescence intensity of DCF after reaction with ROS generated due to varying duration of UV-A + UV-B + PAR exposure in Nostoc sp. strain HKAR-2 .
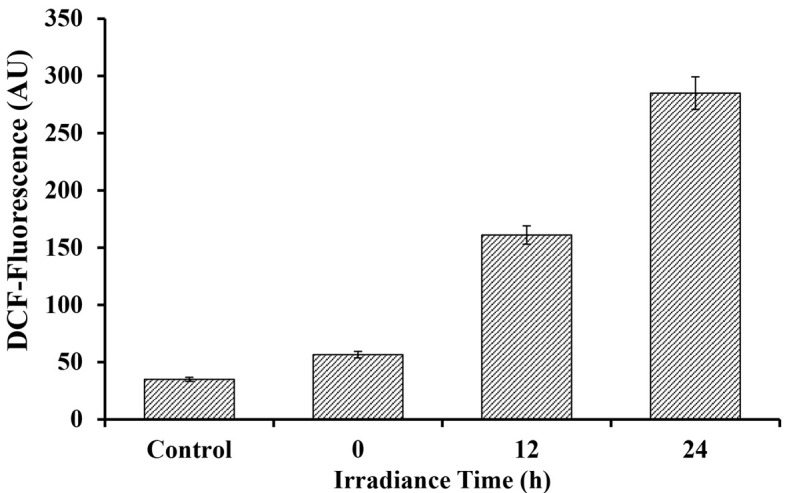
(means ± SD, n = 3). Control: Untreated sample. PAR: Photosynthetically active radiation.
Data analysis
The UVR irradiated cells were analyzed using a Nikon Eclipse Ni fluorescence microscope processed by NIS-Elements (BR) imaging software. The microscope was equipped with the following filter set: UV: (DAPI) EX 340 nm EM 488 nm, blue: (FITC) EX 495 nm EM 510 nm and green: (PI 550) EX 550 nm EM 650 nm. Cells were imaged in the epifluorescence mode with a 20x objective lens. The image analysis was performed by NIS-Elements (BR) imaging software provided by Nikon and images were saved in JPEG format. In addition, the fluorescence of the samples was measured by a fluorescence spectrophotometer (Cary Eclipse, Agilent Technologies) with an excitation wavelength of 485 nm and an emission band between 500 and 600 nm. The data of the fluorescence spectra were exported to excel and the fluorescence intensity values at 525 nm were extracted. A bar diagram was plotted with SigmaPlot 11 software. All fluorescence measurements were performed at room temperature. All results are presented as mean values of three replicates for fluorescence spectrophotometer analysis and random sites of filaments were used for fluorescence microscopy. All data were analysed by one-way analysis of variance (Brown, 2005). Once a significant difference was detected post hoc multiple comparisons were made by using the Tukey test. The level of significance was set at 0.05 for all tests. All statistical analyses were performed by using SigmaPlot 11 software.
Notes
Direct exposure of light to UV treated samples should be avoided.
The stock solution of 2’,7’-dichlorodihydrofluorescein diacetate (DCFH-DA) once prepared, was kept in -20 °C for further use and direct exposure to light should be avoided (it remains stable for more than 3 months).
All solutions were filtered through 0.25 µm size Millipore membrane filter before use.
Recipes
-
50 mM phosphate buffer (400 ml)
8.7 g K2HPO4
6.8 g KH2PO4
Adjust the pH to 7.00
Filter through 0.25 µm size Millipore membrane filter before use
-
2 mM (w/v) 2’,7’-dichlorodihydrofluorescein diacetate (DCFH-DA) stock solution
Dissolve 0.974 mg of 2’,7’-dichlorodihydrofluorescein diacetate (DCFH-DA) in 1 ml of absolute ethanol
Acknowledgments
Rajneesh and Jainendra Pathak are thankful to the Department of Biotechnology (DBT-JRF/13/AL/143/2158) and the Council of Scientific and Industrial Research (09/013/0515/2013-EMR-I), New Delhi, India, respectively, for the financial support in the form of fellowships. SP Singh acknowledges the DST-SERB and UGC for Early Career Research Award and UGC Start-Up Research Grant, respectively. We are also thankful to the Interdisciplinary School of Life Sciences (ISLS), BHU, Varanasi, India, for providing access to the fluorescence microscopy facility. This protocol was adapted from procedures published by Rastogi et al., 2010 .
Citation
Readers should cite both the Bio-protocol article and the original research article where this protocol was used.
References
- 1.Brown A. M.(2005). A new software for carrying out one-way ANOVA post hoc tests. Comput Methods Programs Biomed 79(1): 89-95. [DOI] [PubMed] [Google Scholar]
- 2.Crow J. P.(1997). Dichlorodihydrofluorescein and dihydrorhodamine 123 are sensitive indicators of peroxynitrite in vitro: implications for intracellular measurement of reactive nitrogen and oxygen species . Nitric Oxide 1(2): 145-157. [DOI] [PubMed] [Google Scholar]
- 3.Fischer W. F.(2008). Life before the rise of oxygen. Nature 455: 1051-1052. [DOI] [PubMed] [Google Scholar]
- 4.Häder D. P., Kumar H. D., Smith R. C. and Worrest R. C.(2007). Effects of solar UV radiation on aquatic ecosystems and interactions with climate change. Photochem Photobiol Sci 6(3): 267-285. [DOI] [PubMed] [Google Scholar]
- 5.He Y. Y. and Häder D. P.(2002). UV-B-induced formation of reactive oxygen species and oxidative damage of the cyanobacterium Anabaena sp.: protective effects of ascorbic acid and N-acetyl-L-cysteine . J Photochem Photobiol B 66(2): 115-124. [DOI] [PubMed] [Google Scholar]
- 6.Holzinger A. and Lutz C.(2006). Algae and UV irradiation: effects on ultrastructure and related metabolic functions. Micron 37(3): 190-207. [DOI] [PubMed] [Google Scholar]
- 7.Marchesi E., Rota C., Fann Y. C., Chignell C. F. and Mason R. P.(1999). Photoreduction of the fluorescent dye 2’-7’-dichlorofluorescein: a spin trapping and direct electron spin resonance study with implications for oxidative stress measurements. Free RadicBiol Med 26(1-2): 148-161. [DOI] [PubMed] [Google Scholar]
- 8.Palomero J., Pye D., Kabayo T., Spiller D. G. and Jackson M. J.(2008). In situ detection and measurement of intracellular reactive oxygen species in single isolated mature skeletal muscle fibers by real time fluorescence microscopy . Antioxid Redox Signal 10(8): 1463-1474. [DOI] [PMC free article] [PubMed] [Google Scholar]
- 9.Rastogi R. P., Singh S. P., Häder D. P. and Sinha R. P.(2010). Detection of reactive oxygen species(ROS) by the oxidant-sensing probe 2’,7’-dichlorodihydrofluorescein diacetate in the cyanobacterium Anabaena variabilis PCC 7937. Biochem Biophys Res Commun 397(3): 603-607. [DOI] [PubMed] [Google Scholar]
- 10.Safferman R. S. and Morris M E.(1964). Growth characteristics of the blue-green algal virus LPP1. J Bacteriol 88: 771-775. [DOI] [PMC free article] [PubMed] [Google Scholar]
- 11.Singh S. P., Rastogi R. P., Hader D. P. and Sinha R. P.(2014). Temporal dynamics of ROS biogenesis under simulated solar radiation in the cyanobacterium Anabaena variabilis PCC 7937 . Protoplasma 251(5): 1223-1230. [DOI] [PubMed] [Google Scholar]
- 12.Soh N.(2006). Recent advances in fluorescent probes for the detection of reactive oxygen species. Anal Bioanal Chem 386(3): 532-543. [DOI] [PubMed] [Google Scholar]
- 13.Vaishampayan A., Sinha R. P., Häder D. P., Dey T., Gupta A. K., Bhan U. and Rao A. L.(2001). Cyanobacterial biofertilizers in rice agriculture. Bot Rev 67: 453-516. [Google Scholar]
- 14.Wu T. T. Chen K. and Keaney J. F.(2007). Use of 2’,7’-dichlorodihydrofluorescein diacetate in an easy and quantifiable assay for hypochlorous acid oxidation. FASEB J 21: 882-889. [Google Scholar]