

Summary
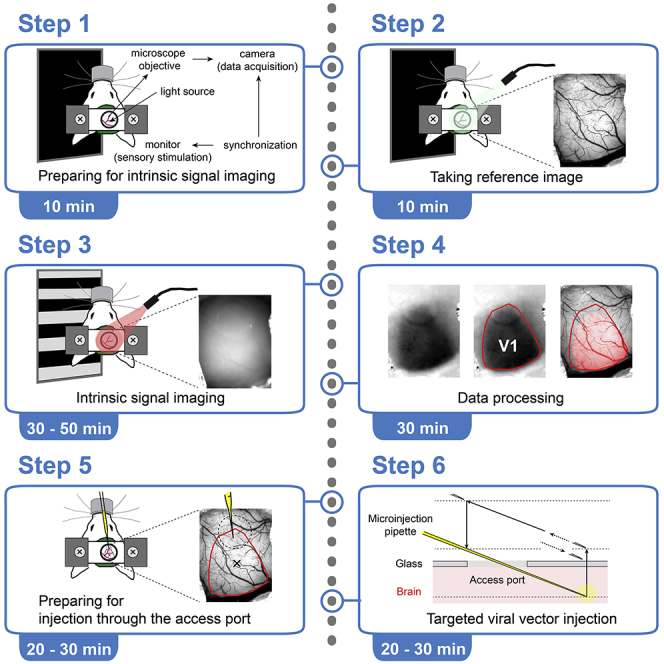
Intrinsic optical signal imaging (ISI) is a hemodynamic response-based technique to map the functional architecture of the cortex. ISI is often used as an auxiliary method to localize cortical areas for targeted electrophysiology, pharmacology, or imaging experiments. Here, we provide a protocol for ISI through a cranial window with an access port to identify the area of the primary visual cortex (V1) in a head-fixed mouse, followed by targeted viral vector injection, which enables subsequent two-photon imaging of V1 layer 6 corticothalamic neurons.
For complete details on the use and execution of this protocol, please refer to our paper Augustinaite and Kuhn (2020b).
Subject areas: Microscopy, Model Organisms, Neuroscience
Graphical abstract
Highlights
-
•
Intrinsic optical signal imaging through a chronic cranial window of a head-fixed mouse
-
•
Mapping of primary visual cortex and other sensory cortical areas
-
•
Injection through the access port of a chronic cranial window of a head-fixed mouse
-
•
Instructions for V1 layer 6 labeling long after chronic cranial window surgery
Intrinsic optical signal imaging (ISI) is a hemodynamic response-based technique to map the functional architecture of the cortex. ISI is often used as an auxiliary method to localize cortical areas for targeted electrophysiology, pharmacology, or imaging experiments. Here, we provide a protocol for ISI through a cranial window with an access port to identify the area of the primary visual cortex (V1) in a head-fixed mouse, followed by targeted viral vector injection, which enables subsequent two-photon imaging of V1 layer 6 corticothalamic neurons.
Before you begin
Intrinsic optical signal imaging (ISI) in the mammalian brain (Grinvald et al., 1986) is a procedure to generate functional maps of cerebral cortex. The mechanism of ISI is based on wavelength-dependent changes of light absorption and reflection due to activity-dependent changes of blood flow, volume, and oxygenation in the observed brain regions (Frostig et al., 1990, Pouratian and Toga, 2002).
The imaging of this signal in mice can be performed using different acute or chronic head-fixed animal preparations, such as intact or thinned bone (Juavinett et al., 2017, Schuett et al., 2002, Marshel et al., 2011, Roth et al., 2012, Garrett et al., 2014), or chronic cranial window (Augustinaite and Kuhn, 2020b, Kalatsky and Stryker, 2003). Here, we describe materials and methods for ISI through the cranial window of an anesthetized head-fixed mouse to map the area of primary visual cortex (V1). The procedure can be easily adapted for other sensory areas.
The map of a cortical area can be used for targeted viral vector injections through the window access port of the chronic cranial window (Roome and Kuhn, 2014). Such post-surgery injections enable controlled localization and timing of the viral expression. For example, we used this method to co-label retrogradely marked V1 layer 6 corticothalamic neurons with a genetically encoded calcium indicator and subsequently for two-photon imaging of neuronal calcium activity (Augustinaite and Kuhn, 2020b).
In this protocol, we provide instructions for population-labeling of cortical layer 6 neurons in an Ntsr1-Cre mouse line. The technique can also be used for other cortical layers or brain regions, single cell labeling with synthetic dye, or other electrophysiological as well as pharmacological manipulations prior-, during- or even after the imaging experiment (Roome and Kuhn, 2014, Roome and Kuhn, 2018, Kuhn and Roome, 2019).
CRITICAL: The chronic cranial window with access port as well as injection pipettes can be prepared following the procedures described previously (Augustinaite and Kuhn, 2020b, Augustinaite and Kuhn, 2020a, Roome and Kuhn, 2014, Roome and Kuhn, 2018, Roome and Kuhn, 2019).
Prepare equipment for intrinsic signal imaging and/or injections through the access port of the chronic cranial window
Timing: 10–20 min
-
1.Prepare the basic setup (Figure 1A) consisting of:
-
a.Head-fixation imaging stage with a feedback-regulated heating pad (40-90-8D, FHC) and nose cone (tube connector OD, 12 mm; ID, 9 mm; Axel) connected to an anesthetic vaporizer (M3000, Supera Anesthesia Innovations).
-
b.Microscope equipped with sCMOS camera (PCO.edge, PCO) with an air objective (5×/NA 0.2 or 2.5×/NA 0.1, Zeiss).CRITICAL: Camera selection. See step 15.
-
c.Green light pass filter (470–575 nm; Chroma) and white LED light source (KL 1600 LED, Schott) with adjustable intensity and gooseneck light guide. The green filter in combination with the LED light will be used to acquire high-contrast images of the brain surface vasculature (Figures 1E, 2A, and 3A).Alternatives: Green LED light (Figure 1A; 540–600 nm, X-Cite XLED1, Excelitas Technologies) can be used. In this case, no filter is necessary.
-
a.
-
2.Add equipment for intrinsic signal imaging (Figures 1B and 1C).
-
a.Stable, high-power red LED light source (615–655 nm, X-Cite XLED1, Excelitas Technologies) with flexible light guide mounted on an adjustable stand.Alternatives: Other wavelength ranges can be used for ISI. See Pouratian and Toga (Pouratian and Toga, 2002) for discussion.
-
b.A large stimulation monitor (Figure 1B; LCD, 47.5 ×26.5 cm, 60 Hz refresh rate, DELL), positioned at a 45° angle to the mouse axis at distance from the eye that results in maximal coverage of the visual field (15 cm), contralateral to the hemisphere with a cranial window.Note: A smaller, and, therefore, closer positioned screen can also be used for stimulus presentation if properly calibrated and synchronized with imaging data acquisition (see steps 2c and 2d).Alternatives: The setup can be easily modified for ISI of the other sensory areas. For example, an air outlet (tube connector OD, 4 mm; ID, 2 mm, WPI) can be positioned at a 20°–30° angle at about 0.5 cm distance from the mouse (Figure 1C) to stimulate whiskers / whisker pad with an air-puff (Picospritzer III, Parker) for mapping the barrel field of primary somatosensory cortex.
-
c.Generate a 5 s visual stimulus sequence (imaging trial in Figure 1F) using software package for visual psychophysics (Psykinematix, KyberVision): 1 s of baseline (full screen RGB black, luminance 0.16 cd m−2) followed by 1 s visual stimulation (4 direction full-field drifting gratings (135°, 180°, 225° and 270°, 250 ms duration each; temporal frequency 2 Hz; spatial frequency (0.04–0.1 cycles per degree; one frequency per experiment) and contrast (RGB black/blue or gray 50%–100%; one contrast per experiment)), and 3 s post-stimulus time (full screen RGB black, luminance 0.16 cd m−2).Note: As shown by intrinsic autofluorescence and calcium imaging, special combinations of spatial and temporal frequencies preferentially activate higher order visual areas (HVAs). For example, anterolateral area (AL) neurons prefer high temporal, but low spatial frequency visual stimuli; posteromedial area (PM) neurons, in contrast, prefer low temporal, but high spatial frequency stimuli; while neurons in lateromedial (LM), anteromedial (AM) and laterointermediate (LI) areas prefer higher temporal as well as higher spatial frequencies (Andermann et al., 2011, Marshel et al., 2011, Glickfeld and Olsen, 2017, Glickfeld et al., 2013). However, we did not observe differences in the resulting image of V1, nor clear images of distinct HVAs when using different frequency, full-field drifting gratings. Most likely, different stimulation and data analysis algorithms than presented in this protocol should be chosen for HVA segmentation from ISI data (for details see Garrett et al., 2014, Juavinett et al., 2017, Kalatsky and Stryker, 2003, Marshel et al., 2011, reviewed in Glickfeld and Olsen, 2017).Note: Full-field stimulation will activate full retina and V1, accordingly. Use spatially restricted stimulation for retinotopic imaging (Schuett et al., 2002, Juavinett et al., 2017, Garrett et al., 2014, Kalatsky and Stryker, 2003, Marshel et al., 2011).Alternatives: The user can choose any psychophysics toolbox, software package or programmable graphics hardware for generation of the visual stimulus sequence if it can be synchronized with the data acquisition (step 2d and Figures 1F and 1G). For alternative configurations see other references (for example: Juavinett et al., 2017, Kalatsky and Stryker, 2003, Schuett et al., 2002).Alternatives: An appropriate stimulation should be chosen for intrinsic imaging of other sensory areas. For example, the intrinsic signal of the barrel field of the primary somatosensory area can be activated by a brief (0.25 s) air-puff (40 psi) delivered to the whiskers / whisker pad (Figure 1C, 1G, and 4C).
-
d.Synchronize sensory stimulation with imaging data acquisition.CRITICAL: Stimulation and imaging must be synchronized (Figures 1E–1G). Typically, stimulation and camera-controlling software are different programs on different computers. At least one of the two units must be able to generate a start trigger pulse and the other unit must be triggerable. Alternatively, synchronization can be achieved by using additional instruments (for example, a pulse generator (Master 9, A.M.P.I.)).
-
e.Check that anesthetic vaporizer contains enough isoflurane for at least 1h.
-
a.
-
3.Prepare equipment for the viral vector injection through the access port of the chronic cranial window (Figure 1D).Note: Preparation for injection through the access port of the chronic cranial window is independent of preparation for ISI.
-
a.To the basic setup arrangement (Figure 1A) add motorized micromanipulator (MP-285, Sutter Instrument) mounted on a stand (MT-75, Sutter Instrument).CRITICAL: Select a 4-axis micromanipulator, allowing movements in x, y, z and diagonal directions. The diagonal movement will be used for the pipette insertion into the brain (Figure 5).
-
b.Mount the pipette holder (H-2, Narishige) on the micromanipulator.
-
c.Prepare a thick wall microinjection pipette (quartz glass OD, 1 mm; ID, 0.3 mm; Sutter Instrument) pulled using a pipette puller (P-2000, Sutter Instrument). Bevel the pipette tip at a 35° angle with a sharp tip and a 10–15 μm opening (short axis of the elliptic opening; BV-10, Sutter Instrument) (Augustinaite and Kuhn, 2020a). The pipette will be connected to the manometer (PM015D, W.P.I.) with appropriate silicone tubing (ID ≤ 1mm for tight sealing; Axel) and mounted on the pipette holder during injection.Alternatives: Borosilicate glass can be used instead of quartz glass. Borosilicate glass can be easier pulled (does not require a puller with CO2 laser heating) but the tip is more flexible. Therefore, penetration of the silicone and dura as well as hitting deep targets is more challenging (see step 28).
-
d.Transfer vial with a viral vector (here, AAV9.Syn.Flex.GCaMP6f, typically 10 μL) from −80°C to +4°C.
-
e.Check that anesthetic vaporizer contains enough isoflurane for at least 1h.
-
a.
Figure 1.

Setup for intrinsic optical signal imaging (ISI) and injection through the access port of the chronic cranial window
(A) The basic procedure setup consisting of a (1) headplate holder, (2) temperature-controlled heating pad, (3) nose cone connected to an anesthetic vaporizer, (4) microscope objective, and (5) white or green LED light source. The microscope with attached camera is not visible in the picture.
(B) The setup prepared for ISI of visual cortex by adding (5) high power red LED light source and (6) monitor for visual stimulation.
(C) The setup prepared for ISI of somatosensory cortex by replacing the monitor with (7) air outlet for whisker / whisker pad stimulation.
(D) The setup for injection through the access port (arrow) with (8) injection pipette, connected to the manometer with (9) silicone tubing and mounted on (10) pipette holder, fixed diagonally on the (11) motorized micromanipulator.
(E–G) (E) Procedural and trial sequence for ISI with (F) visual or (G) somatosensory stimulation.
Figure 2.

Key aspects of intrinsic optical imaging
(A) Image of the brain surface vasculature with (left) and without (right) green (470–575 nm) filter.
(B and C) Effect of anesthesia on hemodynamic signals: (B) Single trial recordings after intra peritoneal (ip) injection of a mixture of Medetomidine, Midazolam and Butorphanol. Notice increased hemodynamic signals that indicate waking in the 5-th trial. (C) Intrinsic signal after adding isoflurane (1%) anesthesia.
(D) Image with the focal plane about 500 μm below the brain surface under red-light illumination.
(E) Image of hemodynamic signal in response to visual stimulation calculated from 5 trials (B and C). Dataset from the same animal; image size 1200 × 925 pixels frame, corresponding to 4.025 × 3.14 mm.
Figure 3.

Mapping of V1 by ISI
(A) Reference images of the brain surface vasculature of 3 mice.
(B) Images of the hemodynamic signal in response to visual stimulation corresponding to the area of V1.
(C) Manual selection of response area of V1.
(D) The area of V1 (as in C) overlayed on the reference image (A).
(E) The image of a brain surface (Brain Explorer 2, Allen Mouse Brain Atlas, Allen Institute for Brain Science) with outline of primary (V1) and higher-order visual areas (cyan).
(F) The overlay of 3 different V1 areas (C).
(G and H) Area of V1 from mouse 3 (C and D) overlayed with the scaled outline of visual cortical areas (E). Mouse 3 is the same as in Figure 2.
Figure 4.

Indirect method to map higher-order visual cortical areas using ISI of V1 and somatosensory cortex
(A) The image of a brain surface (Brain Explorer 2, Allen Mouse Brain Atlas, Allen Institute for Brain Science) with outline of primary (V1) and higher-order visual areas as well as barrel field (BF) of somatosensory cortex (cyan).
(B) Image of the intrinsic signal in response to visual stimulation corresponding to the area of V1.
(C) Image of the intrinsic signal in response to air-puff stimulation of the whisker pad corresponding to the posterior part of the barrel cortex.
(D) The areas of V1 (red; B), somatosensory cortex (green; C) and scaled outline of cortical areas (cyan; A) overlayed on the reference image of the cortical surface.
A, anterior; AL, anterolateral, RL, rostrolateral visual cortex. Note, that RL and A areas correspond to posterior parietal cortex.
Figure 5.

Schematic instruction of the targeted pipette insertion through the access port of the chronic cranial window
(A) Pipette insertion into the injection target region. The vertical distance (d) is the sum of the cortical depth of the intended injection (a), the thickness of the glass (b), and an extra distance above the glass (c); z, the absolute value of the pipette tip position on the Z-axis; inset shows the magnified view of the microinjection pipette tip (scale bar, 100 μm).
(B) Three pipette trajectories aiming for the same target region. Only the black trajectory allows successful insertion.
(C) Three pipette trajectories aiming at different targets by changing the access angle. Gray crosses indicate edges of the access port.
Key resources table
| REAGENT or RESOURCE | SOURCE | IDENTIFIER |
|---|---|---|
| Chemicals, peptides, and recombinant proteins | ||
| IsoSol (isoflurane, USP) | Vedco | NDC 50989-150-15 |
| Medetomidine (Domitor, 10 mL) | Nippon Zenyaku Kogyo | N/A |
| Midazolam (Dormicum injection, 10 mL) | Maruishi Pharmaceutical | N-A |
| Butorphanol (Vetorphale, 5 mg) | Meiji Seika Pharma | N/A |
| Atipamezole hydrochloride | Nippon Zenyaku Kogyo | N/A |
| Mineral oil | Sigma | M5904-5ML |
| Silicone oil | Aldrich | 317667-5ML |
| Bacterial and Virus strains | ||
| AAV9.Syn.Flex.GCaMP6f | Addgene | 100833-AAV9 |
| Experimental models: Organisms/strains | ||
| C57BL6J mouse line | Japan Clea | N/A |
| Ntsr1-Cre mouse line GN220Gsat strain B6.FVB(Cg)-Tg(Ntrs1-Cre) | Mutant Mouse Regional Resource Center (MMRRC) | 030648-UCD |
| Software and algorithms | ||
| Psykinematix | KyberVision Japan LLC | http://www.kybervision.net/ |
| Fiji | Schindelin et al., 2012, | https://imagej.net/Fiji/Downloads |
| IO and VSD signal processor | Harrison et al., 2009 | https://murphylab.med.ubc.ca/io-and-vsd-signal-processor/ |
| Other | ||
| DC Temperature Control System (40-90-8D) | FHC | https://www.fh-co.com/product-category/neurocraft-devices/dc-temperature-control-system/ |
| Anesthetic vaporizer M3000 | Supera Anesthesia Innovations | https://www.superavet.com/M3000 |
| sCMOS camera PCO.edge | PCO | https://www.pco-imaging.com/scientific-cameras/#section-38 |
| Light source for fiber optics Schott KL 1600 LED | Schott | https://www.schott.com/lightingimaging/english/microscopy/products/kl/1600led.html |
| X-Cite XLED1 Multi-Triggering LED Illumination System | Excelitas Technologies | https://www.excelitas.com/product/x-cite-xled1-multi-triggering-led-illumination-system |
| Microinjection dispense system Picospritzer III | Parker | https://ph.parker.com/us/12051/en/picospritzer-iii-intracellular-microinjection-dispense-systems-picospritzer-micro-dispense-system |
| 2P microscope MOM | Sutter Instrument | https://www.sutter.com/MICROSCOPES/mom.html |
| Motorized micromanipulator system MP-285 | Sutter Instrument | https://www.sutter.com/MICROMANIPULATION/mp285.html |
| Micromanipulator stand MT-75 | Sutter Instrument | https://www.sutter.com/STAGES/mt75.html |
| Electrode holder H-2 | Narishige | https://www.tritechresearch.com/H-2.html |
| Quartz glass OD, 1 mm; ID, 0.3 mm, 7.5 cm length | Sutter Instrument | Q 100-30-7.5 |
| Micopipette puller P-2000 | Sutter Instrument | https://www.sutter.com/MICROPIPETTE/p-2000.html |
| Microelectrode beveler BV-10 | Sutter Instrument | https://www.sutter.com/MICROPIPETTE/bv-10.html |
| Pressure manometer SYS-PM015D | W.P.I. | https://www.wpiinc.com/var-3529-pressure-manometer |
| Sterile sponge points Sugi | Questalpha | 31602 |
| Tube connector OD 12 mm, ID 9 mm | Axel | 6-670-04 |
| Tube connector OD 4 mm, ID 2 mm | WPI | https://www.wpiinc.com/var-504954-luer-to-tubing-coupler-assortment-kit |
| Sillicone tube OD 3 mm, ID 1 mm | Axel | 6-586-03-01 |
Materials and equipment
All materials, equipment, and their sources are listed in the text and in the key resources table.
Alternatives: For alternative materials, equipment, and their sources see other references (Harrison et al., 2009, Juavinett et al., 2017, Kalatsky and Stryker, 2003, Pouratian and Toga, 2002, Schuett et al., 2002) and consult with local medical, pharmaceutical, and laboratory equipment suppliers.
Step-by-step method details
Preparation of the mouse for the intrinsic signal imaging
Here we describe ISI through the chronic cranial window of an anesthetized head-fixed mouse. The cranial window surgery can be performed following the detailed procedures described previously (Augustinaite and Kuhn, 2020b, Augustinaite and Kuhn, 2020a).
Note: The ISI can be performed if the brain surface is not obscured by blood (short after the surgery) or re-growing bone (long after the surgery). Usually, ISI was performed 1–2 weeks after the chronic cranial window surgery.
Note: We used 2–3 months old C57BL6J or Ntsr1-Cre mice (both genders) since we find this age best for the long-term chronic cranial window surgery (Augustinaite and Kuhn, 2020a).
Note: As the experiment is done under anesthesia, no habituation to the setup is required.
-
1.
Weigh the animal.
-
2.Induce anesthesia.
-
a.Gently transfer the mouse into an anesthesia induction chamber and induce deep anesthesia with 3% isoflurane (in O2; M3000, Supera Anesthesia Innovations).Note: Anesthesia should induce within 1–1.5 min.
-
b.Inject main anesthetics (here, mixture of Medetomidine (0.3 μg / g; dissolved in 0.9% saline), Midazolam (4 μg / g; dissolved in 0.9% saline), and Butorphanol (5 μg / g; dissolved in 0.9% saline) intraperitoneally (ip) before isoflurane wears off. See also step 6 as well as troubleshooting problem 1 and problem 2.Note: Anesthesia will induce within 3–5 min. Therefore, leave the mouse in its cage for 5 min for a smooth transition to deep anesthesia.
-
a.
-
3.
Head-fix the mouse on the imaging stage using the headplate (Figure 1A).
Alternatives: Researchers using an acute craniotomy or thinned bone preparation can use ear-bars instead of the headplate to immobilize the head.
-
4.
Cover the eyes with a drop of silicone or mineral oil (317667-5ML, Aldrich or M5904-5ML, Sigma, accordingly) to protect the cornea from drying.
-
5.
Turn-on the heating pad after inserting rectal temperature sensor. Maintain 35°C–37°C body temperature throughout the whole procedure.
Alternatives: Tape the temperature sensor to the heating pad so that it senses the temperature between mouse and heating pad.
-
6.
Additionally apply 0.25%–1% isoflurane anesthesia (in O2) and maintain it throughout the whole imaging session.
Taking the reference image
-
7.
Clean the window with small cotton-tips moisturized with water.
-
8.
Optimize the window illumination with the white / green LED by adjusting the gooseneck light guide.
-
9.
Focus with the camera on the brain surface using a low-magnification lens.
-
10.
Adjust the camera settings: center the region of interest; if applicable, adjust the active sensor size of your camera, so that no unnecessary data is acquired.
-
11.
Take the reference image of the brain surface vasculature (Figures 2A and 3A).
Note: Use the green light illumination (Figure 1A) or green light pass filter in the camera light pathway for high-contrast images of the brain surface vasculature (Figure 2A).
Intrinsic signal imaging and initial data processing
-
12.
Focus 400–600 μm below the brain surface.
-
13.
Turn off the white / green LED light source and remove the green filter from the light path (if used).
-
14.
Optimize cortical illumination with the high-power red (615–655 nm) LED light source by adjusting the gooseneck light guide (Figures 1B and 1C).
Note: Some red LED light sources need time to warm up and stabilize (here, about 5–10 min). Troubleshooting problem 3.
Note: The red-light illumination stays on till the end of the imaging procedure (Figure 1E).
-
15.
Adjust camera settings, mainly frame rate and integration time, for highest signal-to-noise ratio. With our sCMOS camera (PCO.edge, PCO), we typically recorded 1200×950 px frames (full dynamic range 16-bit (0-65535) .tiff) at 100–195 Hz and 5 ms exposure time.
-
16.
Record 5–6 imaging trials. Each 5 s trial consisted of 1 s black screen, 1 s visual stimulation, and another 3 s of black screen. Each trial was preceded by a 1–2 min waiting period during which the black screen was presented (Figures 1E and 1F; see also Preparation step 2c).
-
17.
Process the recorded stacks of images (here, .tiff files) using FIJI (Schindelin et al., 2012) plugin “IO and VSD signal processor” (Harrison et al., 2009). The calculated average ratio image (Figures 2E and 3B) shows stimulation induced changes in red light reflectance, as difference between the averages of baseline frames (here, recorded 1s before the stimulus onset) and averages of response frames (here, frames recorded for 1–2s, with <0.5 s delay after stimulus onset). Using the plugin, we filtered the images (1200×950 px at 195 Hz) with 20 pixel sigma Gaussian in x and y, and ± 10 voxel average in z.
Note: Read and follow the instructions of the plugin: https://murphylab.med.ubc.ca/io-and-vsd-signal-processor/
Alternatives: The user can choose any suitable software packages or custom-written algorithms for the processing of the recorded images and calculate stimulation induced changes in red light reflectance.
-
18.
Optional step: Record additional trials. The expected intrinsic optical signal is about 0.1%, spatially localized with about 100 μm resolution, and has a rise time of > 1s (Grinvald et al., 1986). Thus, the signal-to-noise ratio can be increased by averaging trials and spatio-temporal filtering. Troubleshooting problem 3.
-
19.
Optional step: Record additional trials after switching from visual stimulation to somatosensory stimulation (here, deliver air-puff to the whisker pad during imaging trials (Preparation step 2b and 2c; Figures 1C and 1G)) to map the barrel field of primary somatosensory cortex (BF, Figure 4). The V1 and BF trials (Figures 4B and 4C, accordingly) should be processed separately and images of averaged responses overlayed during offline data processing for mapping of HVAs and posterior parietal cortex (Figure 4D).
-
20.
Inject Atipamezole hydrochloride (0.3 μL / g, ip; dissolved in 0.9% saline) for faster waking.
Offline data processing
-
22.
Encircle the functional response, defining V1, on the signal image with the ROI Manager plugin of FIJI (Figures 3C and 4B). These outlines can be used for overlays as shown in Figures 3F–3H and 4D.
-
23.
Adjust the signal image to a threshold for the color map, to project the functional area of V1 on the image of the brain surface (Figure 3D). Our definition of the threshold is based on the peak of the intensity histogram (smoothed by 10-point box filter) of the signal ROI (Figure 3C). The threshold is chosen as the half of the intensity value of that peak.
Pause point: 1 day – n weeks as needed.
5 s trial recording; average of 10 trials. The same mouse as in Figures 2 and 3A–3D mouse 3. Linked to step 21.
Preparation for the injection through the access port of the chronic cranial window
In the following steps, we describe the procedure of viral vector injection through the access port of the chronic cranial window into layer 6 of V1 in an anesthetized, head-fixed mouse. This procedure can follow ISI or be performed separately, for example, for drug or dye injections (Augustinaite and Kuhn, 2020b, Roome and Kuhn, 2014, Roome and Kuhn, 2018, Roome and Kuhn, 2019). In this case, inspect the area of interest with two-photon microscope (MOM, Sutter Instrument) before the injection.
Note: The injection time is restricted by the quality of the cranial window only. If necessary, it can be performed a few days, weeks, or even months after the chronic cranial window surgery if the window is not obscured by blood or re-growing bone.
-
24.Anesthetize and head-fix the mouse.
-
a.Gently transfer the mouse into an anesthesia induction chamber and induce deep anesthesia with 3% isoflurane.Note: Anesthesia should induce within 1–1.5 min.
-
b.Head-fix the mouse on the imaging stage using the headplate (Figure 1A).
-
c.Apply 0.5%–1% isoflurane anesthesia and maintain it throughout the whole procedure.
-
a.
-
25.Connect the microinjection pipette to the manometer and mount it on the micromanipulator.
- a.
-
b.Measure the mounting angle of the pipette and micromanipulator settings for the angle of the diagonal movement direction. The angles must be set the same. For the selection of the angle see step 26e.
-
26.Check the trajectory of the pipette (Figures 5 and 6).CRITICAL: This trial run is important to test if there is any sterical hindrance. If this step is skipped, the delays might occur in step 28.CRITICAL: The access port of the chronic cranial window must be in a place which allows sterically to reach the target. This horizontal distance must be calculated with the tangent formula from the access angle and the target depth. The diameter of the access port (typically, about 1mm) can act as a ruler when positioning the window during the surgery. A 1-mm access port gives some flexibility to reach the target, but not much (Figure 5B). Alternatively, the shape of the access port can be changed, or diameter can be increased. It takes some experience and testing to find the optimal arrangement. Troubleshooting problem 4 and problem 6.
- a.
-
b.Calculate the distance d = a+b+c, where (a) is a depth of your intended injection in the brain, (b) is the thickness of the window glass and (c) is the distance above the window (Figure 5A). For labeling layer 6 in the mouse primary visual cortex (Figure 6I; (Augustinaite and Kuhn, 2020b)), we used (a) 950 μm cortical depth, (b) 170 μm thick glass for the cranial window and (c) 380 μm distance above the glass (380 μm was chosen for convenience, to get d = 1500 μm). Lift the pipette by the distance c and zero the coordinates again (z2 in Figure 5A).CRITICAL: We recommend choosing the distance c of a few hundred μm to prevent damage of the pipette-tip during the procedure. Without this distance the pipette might hit the obstacle and break the tip (see step 26d and Troubleshooting problem 4).
-
c.Switch to the diagonal movement mode and retract the pipette so that it is lifted by distance d (z3 = |d| in Figure 5A).
-
d.Switch back to the regular, orthogonal movement mode of the manipulator and lower the pipette by distance d to the zero point (z4 in Figure 5A).CRITICAL: The pipette might be moved far out of the visual field when retracted diagonally (step 26c). The tip might end up above the edge of the chronic cranial window or headplate and break when being lowered to zero. Also, in practice, the cranial window is never ideally parallel to the headplate. Therefore, the pipette also might break or bend (and create an error offset) if hitting the glass when lowered (Troubleshooting problem 4 and problem 6).
-
e.Switch again to the diagonal movement mode and approach the surface of the access port (Figures 5A and 6D). Slowly move forward till the very tip penetrates the silicone. If the pipette (i) bends and slides on the port’s surface, (ii) might hit the glass (Figure 5B) or (iii) a big superficial blood vessel, lift the pipette and repeat the procedure (step 26). Change the mounting / diagonal movement angle or reconsider the target if necessary. Keep in mind that steeper angles fit more for the closer (or deeper) injection sites, while more shallow angles can be selected for more distant (or shallow) injection sites (Figures 5B and 5C).CRITICAL: If the silicone cannot be penetrated, the shaft of the pipette might be too flexible. Try to make pipettes with shorter shafts, bevel the tips at a steeper angle (Augustinaite and Kuhn, 2020a), or select steeper mounting / diagonal movement angle. Troubleshooting problem 4.CRITICAL: Be careful that the pipette tip does not crash into the window glass. Try to stay away from the edges of the cranial window (grey crosses in Figures 5B and 5C) because of the widening shafts of the injection pipettes (Figure 6F). The pipette might hit the glass immediately with the tip or break later at the shank while lowering the pipette (27° and 39° pipettes in Figure 5B). Also, if the pipette shank slides along the access port edge, the pipette will bend and not reach the target area. Troubleshooting problem 4 and problem 6.CRITICAL: If the big superficial blood vessel will be damaged during incision, the spilled blood will spread below the window and obscure the view. This is particularly relevant for imaging experiments planned to be done soon after injection. Troubleshooting problem 5.
-
27.Tip-fill the pipette with the viral vector containing solution.
-
a.Free some space over the headplate by moving the pipette to the side.Note: There is no need to replace the pipette if its tip was not damaged during the checking of the trajectory (step 26).
-
b.Place a small (5×10 mm) piece of parafilm with a 2 μL droplet of AAV solution on the headplate.
-
c.Bring back the pipette to the headplate, apply weak positive pressure (10–14 hPa) and lower the pipette tip into the droplet under visual guidance (Figure 6E).
-
d.Tip-fill the pipette with up to 300 nL of solution using negative pressure (typically −150 to −200 hPa). The volume is judged by the tick marks (made with a fine-tip water-resistant marker) on the pipette (in 0.3 mm inner diameter pipette, 1 mm corresponds to a volume of 70 nL, Figure 6F).CRITICAL: Replace the pipette in case of clogging (remove the clogged pipette and go back to step 25; step 26 can be skipped). Try a larger tip diameter pipette and/or additional dilution with PBS.
-
e.Apply weak positive pressure (10–14 hPa) and lift the pipette up. Maintain this pressure until the injection of the solution into the brain (see step 29).
-
f.Wipe the pipette tip with a PBS-soaked sterile sponge (for example, Sugi, Questalpha).Note: Fluorescent particles/viral vectors outside the glass wall might label neurons/tissue along the insertion track and thus compromise the labeling and/or the imaging quality. Troubleshooting problem 6.CRITICAL: The positive pressure in step 27c and 27e and later (step 29a and 29c) is kept for counteracting the capillary effects. It prevents air or cerebrospinal fluid to tip-fill the pipette. If air is taken up, it will be injected into the brain; if cerebrospinal fluid is taken up, the viral vector solution will be diluted. On the other hand, if too high positive pressure is applied, the solution will be ejected, emptying the pipette before entering the brain, or causing strong labeling along the pipette tract in the brain. Therefore, the pressure should be adjusted depending on the viscosity of the solution as well as inner diameter of the injection pipette. Troubleshooting problem 6.
-
a.
Figure 6.

Targeted injection through the access port of the chronic cranial window
(A and B) Selection of the injection target. (A) The area of V1 (red) overlayed with the blood vessel pattern, generated during the ISI procedure. (B) Blood vessel pattern with indicated target region in V1. Inset shows zoomed in blood vessel pattern. The target region was chosen to be devoid of large blood vessels above the future imaging area.
(C) The pipette tip located at the glass surface of the cranial window directly above the target site (z1 position in Figure 5A).
(D) The pipette tip located at the silicone surface of the access port (position between z4 and z5 in Figure 5A).
(E) The pipette tip in the drop of the viral vector containing solution during tip-filling.
(F) Observation of the injection speed (meniscus movement speed) and volume (marks on the pipette wall).
(G) The pipette inserted into the brain with the tip at the estimated target site (z5 position in Figure 5A).
(H) The surface of the brain immediately after pipette retraction.
(I) The two photon reconstructions of (left) dLGN axons and retrogradely transported fluorescent beads in V1 layer 6, (middle) layer 6 corticothalamic neurons and (right) their combined image; adapted from (Augustinaite and Kuhn, 2020b). Notice, that the red beads were injected into dLGN during the surgery and subsequently transported retrogradely to somata of cortical layer 6 neurons. Afterward, these neurons were co-labeled with GCaMP by targeted injection through the access port. Red cross, injection target and possible labeling area; inset, magnified areas with asterisks indicating reference points; dLGN, dorsal lateral geniculate nucleus.
Injection through the access port of the chronic cranial window
-
28.Lower the pipette into the brain aiming at the target injection site (z5 in Figure 5A).Note: The pipette will follow the trajectory defined during step 26.
- a.
-
b.Lift the pipette by the distance c and zero the coordinates again (z2 in Figure 5A).
-
c.Switch to the diagonal movement mode and retract/lift the pipette by the distance d (z3 in Figure 5A).
-
d.Switch back to the orthogonal movement mode and lower the pipette by the distance d to the zero point (z4 in Figure 5A).
-
e.Switch to the diagonal movement mode and insert the pipette into the brain, moving down/forward by the distance d (z5 in Figures 5A and 6G).CRITICAL: Focus on the access port and observe the penetration of the silicone, dura, and motion of the pipette till the injection site is reached (Figures 6D and 6G).
A more rigid and/or sharper tip (steeper tip-beveling angle) or steeper penetration angle might be necessary to penetrate the dura.
Sometimes, the possibility to hit a big blood vessel becomes obvious only after penetration of the silicone, when pipette gets pushed through the dura. Also, the risk to break the pipette at the edges of the access port increases with the traveling distance (compare the sizes of the pipette shaft near the tip and at the incision point (arrows in Figures 6C and 6G, accordingly)). Change the angle and/or reconsider the injection site in these cases (the same virus-loaded pipette can be re-used if the tip was not damaged). Troubleshooting problem 4, problem 5, and problem 6.
Alternatives: The pipette can be inserted under visual guidance, for example, using two-photon imaging, if the target is in the upper cortex and relatively close to the access port (Roome and Kuhn, 2018, Kuhn and Roome, 2019). Such locations require diagonal movement at a relatively shallow angle. The shallow angle is also necessary when using objective lenses with high magnification, but small working distance.
-
29.Inject the solution.
-
a.Wait for 3–5 min before the injection, allowing the tissue to seal around the pipette wall.
-
b.Under visual observation of the meniscus in the pipette (Figure 6F), pressure inject (typically 35–70 hPa) about 70–100 nL of solution within 5–7 min.
-
c.Reduce the positive pressure to the initial pressure of 10–14 hPa and wait for 10 min to allow the injected solution to spread into the tissue.
-
a.
-
30.
Slowly and smoothly retract the pipette. Usually, the silicone of the access port seals immediately after the pipette retraction, and the damage caused by penetration is minimal (compare Figures 6B and 6H).
Optional: If the viral solution was injected smoothly, the same pipette can be used for one or two other target injections.
Expected outcomes
Intrinsic signal imaging and injections through the access port of the cranial window can be performed on the same imaging setup by adding sensory stimulation equipment, a stable, red-light source, a suitable camera, a body temperature control system, and a micromanipulator system with injection apparatus. It can be also combined with a two-photon setup (for example, two-photon imaging setup, Augustinaite and Kuhn, 2020b, Roome and Kuhn, 2018, Kuhn and Roome, 2019).
Once the animal has recovered from the cranial window surgery and the window is clear (Augustinaite and Kuhn, 2020a), the full area of V1 can be mapped reliably with ISI (Figures 3E–3H). The imaging can be repeated at any time, if necessary. Also, the somatosensory cortex can be mapped in addition to V1, providing an alternative method to outline the higher-order visual cortical areas (Figures 3E–3H and 4).
If the chronic cranial window has an access port, the generated maps can be used for two photon imaging combined with targeted electrophysiological, pharmacological, or labeling procedures (Figure 5). Like ISI, the access to the brain depends on the condition of the window: If the window is clear, the injections can be made soon (few days) or late (few weeks or months) after the surgery (Figure 6I). The procedure might be especially useful for behavioral two-photon imaging experiments, when expression of the fluorescent agent must be delayed because of long-lasting training of the animals.
Limitations
The quality of the chronic cranial window and physiological state of the mouse will define the quality of the ISI and injections through the access port as well as the quality of the subsequent two photon imaging. Additionally, the size and position of the window will limit the field of view, while size, shape and position of the access port will restrain the approachability of the target sites. Therefore we recommend obtaining stereotaxic coordinates from a mouse brain atlas (Paxinos and Franklin, 2013) for window- and access port location, as well as collecting experience from own surgeries and experiments (Augustinaite and Kuhn, 2020a, Augustinaite and Kuhn, 2020b, Roome and Kuhn, 2014, Roome and Kuhn, 2018, Kuhn and Roome, 2019).
The sensory stimulation elicited intrinsic response is very small (0.1%; Grinvald et al., 1986). Such small signal can be registered only in anesthetized animal, when the baseline activity is also very low. Otherwise, the sensory response drowns in the background activity, that is, hemodynamic activity of the blood vessels, stronger heartbeat and breathing artefacts as well as neuronal activity caused by motor- and cognitive processing in the awake and behaving animal.
Only the brain surface, but no deeper structures can be studied with ISI. Usually, this method is limited to cortical architecture mapping and not used for actual functional imaging because of the low spatial (about 100 μm) and temporal (rise time of > 1s) resolution (Grinvald et al., 1986). Also, due to light scattering, the ISI signal can be not attributed to a specific cortical layer.
In theory, any target can be reached for injections or other kind of manipulations through the access port. However, due to the lack of anatomical coordinates (after the cranial window surgery) and technological limitations related to the deep imaging, the procedure is largely restricted to the upper brain structures, such as cortex or cerebellum.
Troubleshooting
Problem 1
Type of anesthesia (steps: 2, 6, 17)
The signal strength and trial-by-trial reproducibility depends on the selected anesthetics. Two aspects must be considered when performing ISI of the visual cortex: (i) stable (and not too high) level of the anesthesia and (ii) immobilization of the eye/ preventing pupil dilation. Usually, this cannot be achieved by a single-drug anesthesia.
Potential solution
Stable anesthesia level providing Isoflurane is known to diminish cortical neuronal activity (reviewed in Sorrenti et al., 2021, Voss et al., 2019), therefore should be used at low concentrations. In combination with a sedative agent (here, Midazolam and Medetomidine; or, for example, Chlorprothixene (Juavinett et al., 2017)) allows to keep Isoflurane concentration as low as 0.25%.
Additionally, use alpha2 adrenoreceptor agonists (here, Medetomidine) to relax the muscles of the eye and pupil. This will prevent the movements of the eye and spontaneous pupil dilations.
Other combinations of drugs can be used. In our experience, Isoflurane complementary mix of Ketamine (100 μg / g) and Xylazine (20 μg / g) ip has very similar effect as Midazolam and Medetomidine.
Problem 2
Depth of anesthesia (steps: 2, 5, 6, 12, 17)
The depth of anesthesia strongly affects ISI signal because anesthesia modulates the strength of the hemodynamic response: neuronal activity in response to sensory stimulation, baseline neuronal activity, and transduction of neuronal activity via glial and vascular cells to blood flow and oxygen supply of the brain. Mapping of cortical areas will fail if the response to sensory stimulation is too weak or cannot overcome baseline background activity.
Potential solution
Choose an imaging plane 400–600 μm below the brain surface to minimize artefacts mediated by the large blood vessels from the brain surface.
Maintain 35°C–37°C body temperature and 0.25%–1% isoflurane anesthesia throughout the whole imaging procedure while keeping in mind that lower body temperature and deeper anesthesia will weaken all hemodynamic signals.
Observe the animal: trembling whiskers and pupillary light response indicates wakening and therefore too light anesthesia.
Inspect recordings after 5–6 trials. Absence of response indicates too high anesthesia, while blood vessel patterns or highly variable signals indicate too low levels of anesthesia. Change the concentration of isoflurane accordingly and record more trials.
Do not record longer than 1h. Better repeat the imaging on the next day. A longer recovery period from the surgery might be required.
Problem 3
Low signal-to-noise ratio (steps: 3, 14, 15, 18)
ISI will fail if the imaging noise is not minimized. Noise can be introduced by movement artefacts of the mouse, instable or dim illumination, or wrong camera settings.
Potential solution
Firmly fix the head to minimize movement artefacts during the recording. The window glass should slightly press on the brain to reduce movement artefacts due to breathing or heartbeat (see, Augustinaite & Kuhn 2020a for details of the chronic cranial window surgery).
Position the brain surface perpendicular to the axis of the objective lens to collect the maximal amount of reflected light from the brain.
Test the light source by imaging a (non-living) dummy sample. Adjust camera settings (maximal frame rate and exposure time) and power of the LED light source to use the full dynamic range of the digitization to achieve highest signal-to-noise ratio per trial. Allow red LED light source to warm up and stabilize for constant illumination. Also, record more trials because signal-to-noise ratio can be increased by spatial and temporal averaging within and between trials during offline data analysis.
Problem 4
Failure of the pipette insertion into the brain (steps: 25, 26, 28)
The pipette might hit the glass, slide, bend, and even break, but fail to penetrate the silicon of the access port or dura when moving diagonally downwards.
Potential solution
Use thick wall quartz glass pipettes with relatively short shafts (< 4 mm), beveled at less than 45° angle (Augustinaite and Kuhn, 2020a) and mount it with the beveled side of the tip facing to the side or upwards. Select the steepest penetration angle possible. The pipette should be rigid enough to penetrate the silicone and dura without bending.
Always check the injection trajectory. Make sure there are no obstacles in the pipettes path and the penetration point will be far enough from the edges of the access port.
Problem 5
Brain damage (steps: 25, 26, 28)
The pipette will cause a lot of damage by tearing the brain tissue during insertion if mounted and then moved diagonally at a different angle. Also, the pipette might cut through blood vessels during penetration, causing bleeding under the cranial window.
Potential solution
Measure the mounting angle of the pipette and the micromanipulator settings for the diagonal movement mode. The angles must be the same.
Check the penetration trajectory. Even if the pathway looked clear, be aware of the possibility to hit the blood vessel during dura penetration. Go back and change the penetration angle or reconsider the target site if a big blood vessel appears to be on the way, especially, during penetration of the dura.
Problem 6
Failure of the target area labeling (steps: 26–29)
The pipette might not reach the anticipated target site if it bends or breaks when pushed against the edge of the access port. Even if incision was successful, the injected solution might spread upwards along the pipette track, instead of diffusing into the tissue at the target site.
Potential solution
Check the pathway. Arrange penetration point to be far enough from the edges of the access port. Closely observe the pipette during motion: wrong movement direction (for example, up- or forward instead of diagonal down) or absence of the movement indicates that pipette is hitting the glass. Try to change diagonal movement angle or target site. If the problem persists systematically, try to make pipettes with narrower shafts or change the shape of the access port (for example, a slit instead of a circle).
Always apply weak positive pressure before loading the pipette with a solution and keep it till the injection, as well as during waiting period before the pipette retraction. It prevents air (when outside) or cerebrospinal fluid (when in the brain) to tip-fill the pipette and dilute the viral vector solution. The pressure should be adjusted depending on the viscosity of the solution as well as inner diameter of the injection pipette. Otherwise, if too high positive pressure is applied, the solution will be ejected, emptying the pipette before entering the brain, or causing strong labeling along the pipette tract in the tissue.
Wait for 3–5 min before and after the injection allowing the tissue to seal around the pipette and injected solution to diffuse into the tissue at the injection site, instead of spreading up along the pipette, or filling the pipette track after too fast pipette retraction.
If possible, always observe the meniscus of the solution during injection. Like waiting periods, slow injection (50 nL/3–5 min) allows solution to spread locally at the injection site instead of going up along the outer walls of the pipette.
Resource availability
Lead contact
Further information and requests for resources and reagents should be directed to and will be fulfilled by the lead contact, Sigita Augustinaite (sigita.augustinaite@oist.jp).
Materials availability
This study did not generate new reagents.
Acknowledgments
This work was supported by JSPS KAKENHI Grant Number 17K14941 to S.A. and the OIST Graduate University. This protocol was developed in the AAALAC International accredited Animal Facility of the OIST Graduate University.
Author contributions
Conceptualization, S.A. and B.K.; methodology, S.A. and B.K.; investigation and visualization, S.A.; writing – original draft, S.A.; writing – review & editing, S.A. and B.K.; funding acquisition, S.A. and B.K.; supervision, S.A.
Declaration of interests
The authors declare no competing interests.
Footnotes
Supplemental information can be found online at https://doi.org/10.1016/j.xpro.2021.100779.
Data and code availability
All datasets analyzed during this study are available from lead contact upon request.
References
- Andermann M.L., Kerlin A.M., Roumis D.K., Glickfeld L.L., Reid R.C. Functional specialization of mouse higher visual cortical areas. Neuron. 2011;72:1025–1039. doi: 10.1016/j.neuron.2011.11.013. [DOI] [PMC free article] [PubMed] [Google Scholar]
- Augustinaite S., Kuhn B. Chronic cranial window for imaging cortical activity in head-fixed mice. STAR Protoc. 2020;1:100194. doi: 10.1016/j.xpro.2020.100194. [DOI] [PMC free article] [PubMed] [Google Scholar]
- Augustinaite S., Kuhn B. Complementary Ca(2+) activity of sensory activated and suppressed layer 6 corticothalamic neurons reflects behavioral state. Curr. Biol. 2020;30:3945–3960 e5. doi: 10.1016/j.cub.2020.07.069. [DOI] [PubMed] [Google Scholar]
- Frostig R.D., Lieke E.E., Ts'o D.Y., Grinvald A. Cortical functional architecture and local coupling between neuronal activity and the microcirculation revealed by in vivo high-resolution optical imaging of intrinsic signals. Proc. Natl. Acad. Sci. U S A. 1990;87:6082–6086. doi: 10.1073/pnas.87.16.6082. [DOI] [PMC free article] [PubMed] [Google Scholar]
- Garrett M.E., Nauhaus I., Marshel J.H., Callaway E.M. Topography and areal organization of mouse visual cortex. J. Neurosci. 2014;34:12587–12600. doi: 10.1523/JNEUROSCI.1124-14.2014. [DOI] [PMC free article] [PubMed] [Google Scholar]
- Glickfeld L.L., Andermann M.L., Bonin V., Reid R.C. Cortico-cortical projections in mouse visual cortex are functionally target specific. Nat. Neurosci. 2013;16:219–226. doi: 10.1038/nn.3300. [DOI] [PMC free article] [PubMed] [Google Scholar]
- Glickfeld L.L., Olsen S.R. Higher-order areas of the mouse visual cortex. Annu. Rev. Vis. Sci. 2017;3:251–273. doi: 10.1146/annurev-vision-102016-061331. [DOI] [PubMed] [Google Scholar]
- Grinvald A., Lieke E., Frostig R.D., Gilbert C.D., Wiesel T.N. Functional architecture of cortex revealed by optical imaging of intrinsic signals. Nature. 1986;324:361–364. doi: 10.1038/324361a0. [DOI] [PubMed] [Google Scholar]
- Harrison T.C., Sigler A., Murphy T.H. Simple and cost-effective hardware and software for functional brain mapping using intrinsic optical signal imaging. J. Neurosci. Methods. 2009;182:211–218. doi: 10.1016/j.jneumeth.2009.06.021. [DOI] [PubMed] [Google Scholar]
- Juavinett A.L., Nauhaus I., Garrett M.E., Zhuang J., Callaway E.M. Automated identification of mouse visual areas with intrinsic signal imaging. Nat. Protoc. 2017;12:32–43. doi: 10.1038/nprot.2016.158. [DOI] [PMC free article] [PubMed] [Google Scholar]
- Kalatsky V.A., Stryker M.P. New paradigm for optical imaging: temporally encoded maps of intrinsic signal. Neuron. 2003;38:529–545. doi: 10.1016/s0896-6273(03)00286-1. [DOI] [PubMed] [Google Scholar]
- Kuhn B., Roome C.J. Primer to voltage imaging with ANNINE dyes and two-photon microscopy. Front. Cell. Neurosci. 2019;13:321. doi: 10.3389/fncel.2019.00321. [DOI] [PMC free article] [PubMed] [Google Scholar]
- Marshel J.H., Garrett M.E., Nauhaus I., Callaway E.M. Functional specialization of seven mouse visual cortical areas. Neuron. 2011;72:1040–1054. doi: 10.1016/j.neuron.2011.12.004. [DOI] [PMC free article] [PubMed] [Google Scholar]
- Paxinos G., Franklin K.B.J. Academic Press; 2013. The mouse brain in stereotaxic coordinates. [Google Scholar]
- Pouratian N., Toga A.W. In: Brain Mapping The Methods. Second Edition. Toga A.W., Mazziotta J.C., editors. Academic Press; 2002. Optical imaging based on intrinsic signals. [Google Scholar]
- Roome C.J., Kuhn B. Chronic cranial window with access port for repeated cellular manipulations, drug application, and electrophysiology. Front. Cell. Neurosci. 2014;8:379. doi: 10.3389/fncel.2014.00379. [DOI] [PMC free article] [PubMed] [Google Scholar]
- Roome C.J., Kuhn B. Simultaneous dendritic voltage and calcium imaging and somatic recording from Purkinje neurons in awake mice. Nat. Commun. 2018;9:3388. doi: 10.1038/s41467-018-05900-3. [DOI] [PMC free article] [PubMed] [Google Scholar]
- Roome C.J., Kuhn B. In: Multiphoton Microscopy. Hartveit E., editor. Humana Press; 2019. Voltage imaging with ANNINE dyes and two-photon microscopy. [Google Scholar]
- Roth M.M., Helmchen F., Kampa B.M. Distinct functional properties of primary and posteromedial visual area of mouse neocortex. J. Neurosci. 2012;32:9716–9726. doi: 10.1523/JNEUROSCI.0110-12.2012. [DOI] [PMC free article] [PubMed] [Google Scholar]
- Schindelin J., Arganda-Carreras I., Frise E., Kaynig V., Longair M., Pietzsch T., Preibisch S., Rueden C., Saalfeld S., Schmid B. Fiji: an open-source platform for biological-image analysis. Nat. Methods. 2012;9:676–682. doi: 10.1038/nmeth.2019. [DOI] [PMC free article] [PubMed] [Google Scholar]
- Schuett S., Bonhoeffer T., Hubener M. Mapping retinotopic structure in mouse visual cortex with optical imaging. J Neurosci. 2002;22:6549–6559. doi: 10.1523/JNEUROSCI.22-15-06549.2002. [DOI] [PMC free article] [PubMed] [Google Scholar]
- Sorrenti V., Cecchetto C., Maschietto M., Fortinguerra S., Buriani A., Vassanelli S. Understanding the effects of anesthesia on cortical electrophysiological recordings: a scoping review. Int. J. Mol. Sci. 2021;22:1286. doi: 10.3390/ijms22031286. [DOI] [PMC free article] [PubMed] [Google Scholar]
- Voss L.J., Garcia P.S., Hentschke H., Banks M.I. Understanding the effects of general anesthetics on cortical network activity using ex vivo preparations. Anesthesiology. 2019;130:1049–1063. doi: 10.1097/ALN.0000000000002554. [DOI] [PMC free article] [PubMed] [Google Scholar]
Associated Data
This section collects any data citations, data availability statements, or supplementary materials included in this article.
Supplementary Materials
5 s trial recording; average of 10 trials. The same mouse as in Figures 2 and 3A–3D mouse 3. Linked to step 21.
Data Availability Statement
All datasets analyzed during this study are available from lead contact upon request.