Abstract
Background
Although it has been shown that high mean platelet volume (MPV) is associated with target organ damage in hypertensive patients, the relationship between MPV and the development of long-term major adverse cardiovascular events (MACE) has not been thoroughly investigated. In this study, we investigated the relationship between MPV and long-term MACE in hypertensive patients.
Methods
From September 2011 to July 2017, 1507 patients with hypertension were included in this study. Ambulatory blood pressure monitoring was performed in all patients. Patients with chronic renal failure, cardiovascular disease, chronic systemic disease and white coat hypertension were excluded from the study. MACE were defined as myocardial infarction, stroke and cardiovascular mortality. Patients were followed-up until january 2020.
Results
The mean follow-up duration was 87 (83.3 ± 24.4) months, and 876 patients completed the study. MACE developed in 79 patients, while 797 patients were event-free. In univariate Cox regression analysis, age, diabetes mellitus (DM), MPV, creatinine, 24-hour systolic blood pressure, and non-dipper hypertension were found to be associated with the development of MACE. In multivariate Cox regression analysis, creatinine and 24-hour systolic blood pressure lost significance, and age, DM, non-dipper hypertension and MPV were found to be independent predictors for MACE development (p < 0.001, p < 0.001, p = 0.044, and p = 0.049, respectively).
Conclusions
MPV, age, DM, and non-dipper hypertension were independent predictors of long-term MACE in hypertensive patients.
Keywords: Cardiovascular event, Hypertension, Long-term, Mean platelet volume
INTRODUCTION
Mean platelet volume (MPV) is an indirect finding of platelet activation and is affected by many conditions such as diabetes mellitus (DM) and atherosclerosis.1 A high MPV value may reflect the presence of active large platelets which contain more dense granules that are metabolically and enzymatically more active than small ones, leading to high thrombus burden lesions that result in fatal or non-fatal cardiovascular events.2 Platelet activity is increased in essential hypertension.3 The development of target organ damage in hypertensive patients is a predictor of cardiovascular events, and previous studies have shown that increased MPV values are associated with target organ damage.4
In a large study, MPV values were found to be higher in unstable angina patients compared to patients with stable angina.5 In another study conducted with coronary artery disease (CAD) patients, it was shown that a high MPV was an independent predictor of myocardial infarction (MI) and mortality.6 Contrary to these studies, some studies have not shown a difference between healthy subjects and MI patients in terms of MPV, and MPV was not found to be an independent predictor of mortality in long-term follow-up after MI.7,8
Although many studies in the literature have investigated the relationship between MPV and target organ damage, non-dipper hypertension, malignant and resistant hypertension in hypertensive patients, few studies have investigated its relationship with the development of long-term major adverse cardiovascular events (MACE). The aim of this study was to investigate whether there was a relationship between MVP and long-term MACE development in hypertensive patients.
METHODS
Patient selection
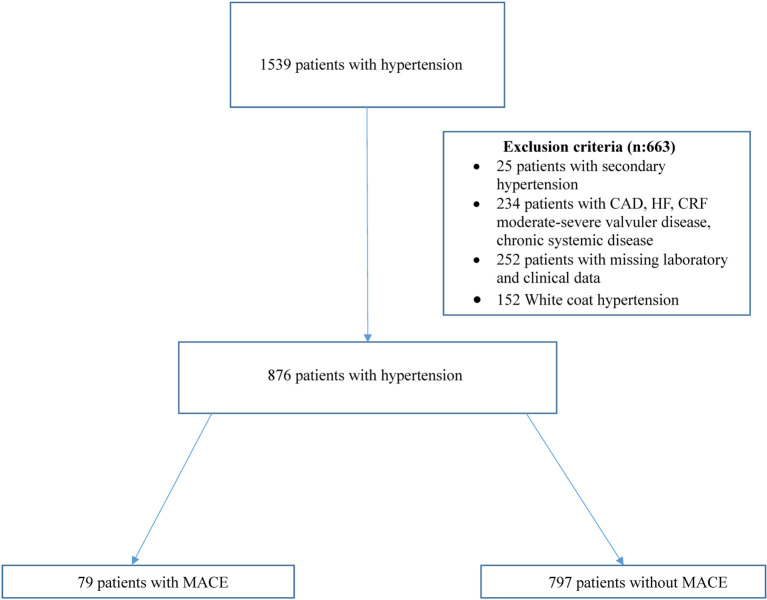
This study was a single center prospective cohort study. Starting from September 2011 to July 2017, a total of 1539 patients with a previous diagnosis of hypertension and under antihypertensive treatment with an office blood pressure (OBP) ≥ 140/90 in at least two measurements in the outpatient clinic were included in this study. Blood pressure (BP) was measured by a physician using auscultatory or oscillometric semiautomatic or automatic sphygmomanometers, after the patients had relaxed in a seated position for at least 5 minutes. BP was measured three times and recorded as the average of the last two readings. The patients were followed-up until january 2020. Echocardiography and ambulatory blood pressure monitoring (ABPM) were performed in all patients. Medical history, physical examination findings and anthropometric measurements of the patients were recorded by an experienced cardiologist. The local ethics committee approved the study protocol and informed consent was obtained from all patients.
The exclusion criteria of this study were secondary hypertension, heart failure (HF), CAD, stroke, moderate-to-severe valvular disease, chronic renal failure (CRF), chronic systemic diseases and white-coat hypertension. Twenty-five patients with secondary hypertension, 152 with white-coat hypertension, 234 with chronic ischemic heart disease, congestive HF, CRF, moderate to severe valvular heart disease, stroke and chronic systemic diseases were excluded from the study. Another 252 patients were excluded due to missing clinical or laboratory findings or could not be reached during follow-up (Figure 1). Therefore, a total of 876 patients completed this study.
Figure 1.
Selection of study participants. CAD, coronary artery disease; CRF, chronic renal failure; HF, heart failure; MACE, major adverse cardiovascular events.
Definitions
Hypertension was defined as an OBP of ≥ 140/90 mmHg and 24-h ABPM ≥ 130/90 mmHg, a mean daytime ABPM of ≥ 135/85 mmHg, nighttime mean ABPM of ≥ 120/70 mmHg, or the active use of antihypertensive drugs.9 White-coat hypertension was defined as an elevated OBP at repeated visits and normal BP on ABPM. Diabetes was defined based on the American Diabetes Association criteria [fasting serum glucose ≥ 126 mg/dL (7 mmol/L), or non-fasting glucose ≥ 200 mg/dL (11.1 mmol/L), or active use of anti-diabetic treatment].10 Body mass index was calculated as weight in kilograms/(height in meters)2, and estimated glomerular filtration rate (eGFR) was calculated using the chronic kidney disease epidemiology collaboration formula.11 Urinary albumin was expressed in milligrams per gram (mg/g). Albuminuria was defined as an albumin/creatinine (A/C) ratio of 30 mg/g or higher, and stratified into two groups of microalbuminuria and macroalbuminuria with A/C ratios of 30-299 mg/g and 300 mg/g or higher, respectively. CRF was defined as an eGFR < 60 ml/min/1.73 m2, which was estimated using the CKD-epidemiology collaboration formula. MI was defined according to the universal definition of MI.12 Cardiovascular mortality was defined as unexplained sudden death, death due to acute MI, heart failure, or arrhythmia. Stroke was defined as the sudden onset of a focal neurologic deficit in a location consistent with the territory of a major cerebral artery, and the diagnosis of ischemic or hemorrhagic stroke was confirmed by computed tomography or magnetic resonance imaging. MACE were defined as MI, stroke and cardiovascular mortality (CV mortality). Non-dippers were those with a nocturnal decrease in systolic blood pressure (SBP) of less than 10% of daytime, and dippers were those with a 10% or larger decline in SBP during the nighttime.13
Echocardiographic examinations
Echocardiographic examinations were performed by a cardiologist using a Vivid 7 system (General Electric Vivid 7 GE Vingmend Ultrasound AS, Horten, Norway). The left ventricular (LV) mass in grams was calculated from M-mode echocardiograms according to the formula described by Devereux et al.14 LV mass was indexed to body surface area as LV mass index (LVMI) in g/m2.
Ambulatory blood pressure monitoring (ABPM)
ABPM was performed for 24 h using an ambulatory blood pressure monitor (Tonoport V, GE Healthcare). The monitor was programmed to measure the blood pressure every 20 min. Daytime and nighttime blood pressure was defined as measurements from 07:00 to 23:00 and from 23:00 to 07:00, respectively.
Blood sampling
Blood samples were taken in the morning after a 12-hour fasting at the first admission to the hospital. MPV was measured from the blood samples collected in ethylenediaminetetraacetic acid (EDTA) tubes, which were analyzed with an automated hematology analysis system (Mindray BC5800). The levels of MPV and other hematologic parameters were measured after 120 min from venipuncture. The expected values for MPV in our laboratory ranged from 6.8 to 10.8 fL. Standard laboratory parameters, including total leukocyte and neutrophil counts, hematocrit, glucose and creatinine levels and lipid profiles were measured.
Study end-points and follow-up
The primary end-point of the study was the development of long-term MACE. Patients were followed up in the outpatient clinics at least once a year. Data of the patients who could not come to the the follow-up visits, were collected by themselves or relatives or family physicians by phone interviews, and other hospital records. Survival data were obtained from the electronic hospital system or National Population Registry.
Statistical analysis
Statistical analysis was performed using SPSS software version 20. The variables were investigated using visual (histograms, probability plots) and analytical methods (Kolmogorov-Smirnov) to determine whether they were normally distributed. Descriptive analyses were presented using means and standard deviations (SD) for normally distributed variables, medians and maximum-minimum values for non-normally distributed variables, and percentages for categorical variables. Chi-square, Student’s t, and Mann-Whitney U tests were used where appropriate. Spearman correlation analysis was performed to determine the association of MPV with the examined variables. Receiver operating characteristic (ROC) curves were used to determine the MVP cut-off values. The parameters which were statistically different between the two groups and may be related to MACE such as age, gender (male), DM, body mass index (BMI), smoking, hematocrit, platelets, glucose, total cholesterol, triglycerides, urinary albumin to creatinine ratio (UACR), office SBP, office diastolic blood pressure, 24-h SBP, 24-h diastolic blood pressure and non-dipper hypertension were evaluated in univariate analysis, and multivariate analysis was performed for the variables with a p value < 0.05 in univariate analysis. Although they were significant in the univariate analysis, due to the association between glucose and DM, and office SBP and 24-h-SBP, they were not included in the multivariate analysis. Finally, multiple Cox regression analyses were performed to identify the significance of the relationships between MACE and MPV, age, diabetes, creatinine, non-dipper hypertension and 24-h SBP. Event-free survival curves were constructed using the Kaplan-Meier method and compared using the log-rank test. An overall 5% type-I error level was used to infer statistical significance.
RESULTS
A total of 876 patients were included in the study, of whom 44.3% were male. The mean follow-up duration was 87 (83.3 ± 24.4) months. At the end of the study, MACE developed in 79 patients. Thirty-four patients had myocardial infarction, 32 patients had stroke, and 18 died due to CV causes (Figure 2). All-cause mortality was recorded in 28 patients. In ROC curve analysis, an MPV value of 9.65 fL was identified as an effective cut-off to predict MACE at 87 months [area under the curve: 0.629, 95% confidence interval (CI) 0.56 to 0.85, p < 0.001] (Figure 3). The patients were divided into a high MPV group (> 9.65 fL; n = 154) and low MPV group (≤ 9.65 fL; n = 722) accordingly (Table 1). Age, DM, glucose, UACR, and office SBP were significantly higher in the high MPV group (Table 1). The usage of antihypertensive agents and statins was higher in the high MPV group (Table 1). Hematocrit and platelet count were lower in the high MPV group (Table 1). Other laboratory values and demographics were similar in the two groups (Table 1). The mean value of MPV was 8.59 ± 1.31 fL, including 8.8 fL in the patients with MI, 9.4 fL in those with stroke, 10.38 fL in those who died from CV causes, and 9.33 fL in the MACE group (Figure 4).
Figure 2.
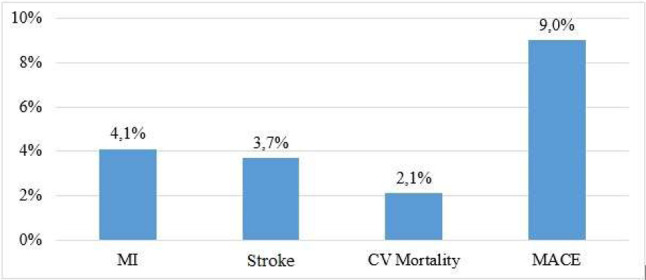
Major cardiovascular events rate in study. CV, cardiovascular; MACE, major adverse cardiovascular event; MI, myocardial infarction.
Figure 3.
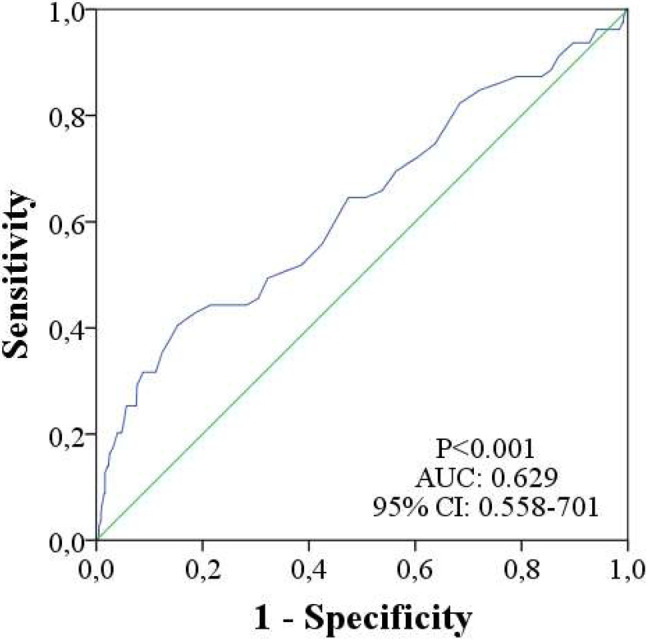
The receiver operating characteristic (ROC) curve with regard to MACE, at 87 months, for MPV with area under curve of 0.629. AUC, area under curve; CI, confidence interval; MACE, major adverse cardiovascular events; MPV, mean platelet volume.
Table 1. Baseline characteristics, laboratory findings of the study population.
| N = 876 | MPV ≤ 9.65 fL (N = 722) | MPV > 9.65 fL (N = 154) | p |
| Age (years) | 52.7 ± 10.8 | 55.6 ± 13.0 | 0.004 |
| Sex (male) | 329 (45.9%) | 60 (39.7%) | 0.167 |
| BMI (kg/m2) | 30.6 ± 5.0 | 31.2 ± 5.5 | 0.257 |
| Smoking | 88 (20.8%) | 29 (25.9%) | 0.242 |
| Diabetes mellitus | 114 (16.2%) | 51 (33.6%) | < 0.001 |
| Heart rate | 75.2 ± 12.7 | 75.0 ± 14.9 | 0.936 |
| LVMI (g/m2) | 98.3 ± 24.8 | 103.0 ± 31.6 | 0.114 |
| Hematocrit,% | 41.7 ± 4.6 | 40.4 ± 5.1 | 0.003 |
| Platelets, × 103/μl | 273.4 ± 72.3 | 235.1 ± 72.2 | < 0.001 |
| Leukocytes, × 103/μl | 7.66 ± 1.91 | 7.72 ± 2.07 | 0.733 |
| Neutrophils, × 103/μl | 4.57 ± 1.41 | 4.68 ± 1.71 | 0.385 |
| Creatinine (mg/dl) | 0.80 (0.70-0.90) | 0.80 (0.70-0.99) | 0.138 |
| Glucose (mg/dl) | 99 (91-111) | 118 (97-164) | < 0.001 |
| Total – cholesterol (mg/dl) | 204.3 ± 40.9 | 201.3 ± 40.3 | 0.432 |
| HDL – cholesterol (mg/dl) | 47.1 ± 12.7 | 48.9 ± 15.5 | 0.144 |
| LDL – cholesterol (mg/dl) | 129.7 ± 34.9 | 124.9 ± 40.8 | 0.146 |
| Triglycerides (mg/dl) | 141 (101-207) | 145 (102-209) | 0.843 |
| Uric acid | 5.44 ± 1.42 | 5.63 ± 1.59 | 0.216 |
| UACR (mg/g) | 0.020 (0.005-0.099) | 0.133 (0.014-0.822) | < 0.001 |
| ACE-ARB | 301 (68.7%) | 92 (78.0%) | 0.050 |
| CCB | 187 (42.8%) | 65 (55.1%) | 0.017 |
| BB | 152 (34.9%) | 52 (44.1%) | 0.066 |
| Diuretic | 225 (51.5%) | 84 (71.2%) | < 0.001 |
| Other antihypertensives | 52 (11.9%) | 29 (24.6%) | 0.001 |
| ASA | 81 (18.7%) | 37 (31.9%) | 0.002 |
| Statin | 42 (9.7%) | 24 (21.2%) | 0.001 |
| Office SBP (mmHg) | 159.9 ± 30.1 | 167.2 ± 24.6 | 0.046 |
| Office DBP (mmHg) | 90.5 ± 11.7 | 92.8 ± 11.3 | 0.109 |
| 24-h-SBP (mmHg) | 144.3 ± 18.2 | 143.4 ± 16.3 | 0.572 |
| 24-h-DBP (mmHg) | 89.6 ± 12.5 | 87.8 ± 13.0 | 0.137 |
| Non-dipper hypertension | 409 (61.5%) | 87 (64.4%) | 0.521 |
ACE, angiotensin-converting enzyme; ARB, angiotensin-receptor blockers; ASA, acetylsalicylic acid; BB, beta-blockers; BMI, bady mass index; CCB, calcium channel blockers; DBP, diastolic blood pressure; HDL; high-density lipoprotein; HT, hypertension; LDL, low-density lipoprotein; LVMI, left ventricular mass index; MPV, mean platelet volume; SBP, systolic blood pressure; UACR, urinary albumin to creatinine ratio.
Figure 4.
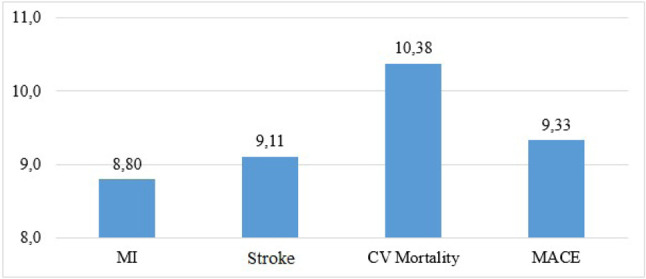
Mean platelet volume levels in major cardiovascular events. CV, cardiovascular; MACE, major adverse cardiovascular event including myocardial infarction, stroke, cardiovascular mortality; MI, myocardial infarction.
Linear correlations were detected between age, LVMI, UACR, office SBP, office diastolic blood pressure and MPV, while a reverse correlation was found between hematocrit and platelet count (Table 2).
Table 2. Correlation between selected covariates and MVP.
| r | p | |
| Age (years) | 0.086 | 0.014 |
| BMI (kg/m2) | 0.012 | 0.787 |
| Heart rate | 0.025 | 0.708 |
| LVMI (g/m2) | 0.098 | 0.030 |
| Hematocrit, % | -0.085 | 0.014 |
| Platelets, × 103/μl | -0.261 | < 0.001 |
| Leukocytes, × 103/μl | -0.022 | 0.536 |
| Neutrophils, × 103/μl | -0.001 | 0.988 |
| Creatinine (mg/dl) | 0.033 | 0.355 |
| Glucose (mg/dl) | 0.033 | 0.352 |
| Total – cholesterol (mg/dl) | -0.031 | 0.405 |
| HDL – cholesterol (mg/dl) | 0.034 | 0.340 |
| LDL – cholesterol (mg/dl) | -0.028 | 0.434 |
| Triglyceride (mg/dl) | -0.028 | 0.436 |
| Uric acid | 0.058 | 0.165 |
| UACR (mg/g) | 0.254 | < 0.001 |
| Office SBP (mmHg) | 0.155 | 0.039 |
| Office DBP (mmHg) | 0.128 | 0.021 |
| 24-h-SBP (mmHg) | 0.002 | 0.963 |
| 24-h-DBP (mmHg) | -0.013 | 0.708 |
BMI, bady mass index; DBP, diastolic blood pressure; HDL, high-density lipoprotein; HT, hypertension; LDL, low-density lipoprotein; LVMI, left ventricular mass index; MPV, mean platelet volume; SBP, systolic blood pressure; UACR, urinary albumin to creatinine ratio.
In univariate Cox regression analysis, while age, DM, MPV, creatinine, glucose, 24-h SBP, office SBP, and non-dipper hypertension were found to be associated with MACE development, creatinine and 24-h SBP lost significance. In multivariate logistic regression analysis, only age, DM, non-dipper hypertension and MPV were found to be independent predictors of MACE development (Table 3). The Kaplan-Meier survival plot for MACE at 87 months is presented in Figure 5.
Table 3. Univariate and multivariate Cox regression analysis of MACE.
| Univariate analysis | Multivariate analysis | |||
| HR (95% CI) | p-value | HR (95% CI) | p-value | |
| Age (years) | 1.067 (1.046-1.089) | < 0.001 | 1.052 (1.026-1.079) | < 0.001 |
| Sex (male) | 1.028 (0.656-1.610) | 0.905 | ||
| Diabetes mellitus | 6.078 (3.877-9.527) | < 0.001 | 5.219 (3.008-9.055) | < 0.001 |
| BMI (kg/m2) | 1.035 (0.985-1.089) | 0.176 | ||
| Smoking | 1.167 (0.624-2.181) | 0.629 | ||
| Hematocrit, % | 0.981 (0.956-1.037) | 0.238 | ||
| Platelets, × 103/μl | 1.000 (0.997-1.003) | 0.932 | ||
| MPV | 1.512 (1.300-1.758) | < 0.001 | 1.183 (1.001-1.401) | 0.049 |
| Creatinine (mg/dl) | 1.437 (1.030-2.007) | 0.033 | 0.793 (0.425-1.480) | 0.467 |
| Glucose (mg/dl) | 1.010 (1.007-1.013) | < 0.001 | ||
| Total – cholesterol (mg/dl) | 0.998 (0.992-1.004) | 0.481 | ||
| Triglycerides (mg/dl) | 1.002 (1.000-1.003) | 0.077 | ||
| UACR (mg/g) | 1.071 (0.944-1.216) | 0.286 | ||
| Office SBP (mmHg) | 1.012 (1.003-1.021) | 0.011 | ||
| Office DBP (mmHg) | 1.016 (0.994-1.039) | 0.152 | ||
| 24-h-SBP (mmHg) | 1.018 (1.006-1.031) | 0.004 | 1.012 (0.995-1.029) | 0.166 |
| 24-h-DBP (mmHg) | 0.995 (0.976-1.014) | 0.604 | ||
| Non-dipper hypertension | 2.851 (1.527-5.324) | 0.001 | 2.202 (1.020-4.755) | 0.044 |
BMI, bady mass index; CI, confidence interval; DBP, diastolic blood pressure; HR, hazard ratio; HT, hypertension; MACE, major adverse cardiovascular events; MPV, mean platelet volume; SBP, systolic blood pressure; UACR, urinary albumin to creatinine ratio.
Figure 5.
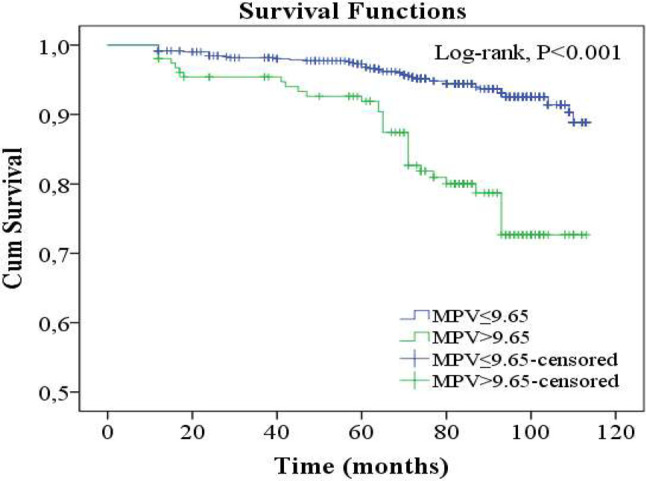
MACE rations of subgroups in 87 months follow-up. MACE, major adverse cardiovascular events; MPV, mean platelet volume.
DISCUSSION
Mean platelet volume is an important platelet production index that may be indirectly related to platelet function. Furthermore, previous studies have reported that MPV was significantly higher in hypertensive patients than in normotensive subjects.15 Shear forces, renin-angiotensin system, endothelial dysfunction, elevated catecholamines levels and presence of co-morbid conditions promote increased activation of platelets in hypertensive settings.15
LVMI and albuminuria are markers of target organ damage in hypertensive patients and are associated with the development of CV events.16 Many studies have investigated the relationship of MPV with LVMI and albuminuria, some of which have found relationships between MPV and LVMI and UACR, while others have not.17,18 We found that MPV was associated with albuminuria and weakly correlated with LVMI.
In the study conducted by Ismail et al., MPV was not found to be associated with 1-year CV mortality in patients with STEMI, while in contrast, Martin et al. reported that a high MPV was associated with mortality and MI development in patients with MI.7,19 Martin suggested that MPV is an independent risk factor for the development of recurrent MI, and that MPV is not correlated with traditional coronary artery disease risk factors such as white cell count, blood lipids, and blood pressure. In a meta-analysis conducted by Zhongxiu et al., increased MPV was found to be associated with the development of long-term CV events in patients who underwent percutaneous coronary interventions.20 Additionally, in studies investigating stroke patients, MPV was found to be higher in the stroke patients than in the control group, and MPV was also associated with stroke severity and 1-year mortality.21,22 Although many studies have investigated MPV in hypertensive patients, few studies have investigated the effect of MPV on the development of long-term CV events. Different from previous studies on hypertensive patients, the effect of MPV on the development of long-term CV events was investigated in the present study, and we found that MPV was an independent risk factor for the development of CV events. Age and DM, which are traditional CV risk factors, were also found to be independent predictors of CV event development in this study.
Shear stress in hypertension causes endothelial damage resulting in thrombus formation. As a result, in hypertensive patients, due to the consumption of small platelets, the number of thrombocytes decreases and MPV increases.23 In a few studies, a reverse relationship has been found between MPV and platelet count.8 In the present study, a reverse correlation was found between MPV and platelet count.
Hypertension is the most common cause of chronic renal failure after diabetes. High creatinine values are also associated with the development of CV events, especially if the eGFR is below 60 ml/min/1.73 m2. The greater the reduction in renal function, the greater the likelihood of CV event development.24 In this study, we did not find an independent relationship between creatinine levels and CV event development, since we did not include patients with an eGFR below 60 ml/min/1.73 m2.
Twenty-four-hour ambulatory blood pressure has been shown to be a better predictor of target organ damage, coronary morbidity, mortality, and stroke than OBP.25 Previous studies have indicated that SBP has a greater association with mortality than diastolic blood pressure.26 In this study, office SBP and 24-h SBP values were found to be associated with the development of MACE.
In most previous studies, non-dipper hypertension has been associated with the development of CV events in hypertensive patients.27,28 Furthermore, non-dipper hypertension was found to be an independent predictor of the development of MACE in this study.
Limitations
Since this study is a single center study, bias is possible in the evaluation of the results. In addition, this study enrolled patients who were previously diagnosed with hypertension and received antihypertensive treatment, and patients who were seen in the outpatient clinic for the first time and had high blood pressures in both office and ABPM. Therefore, patients with white coat hypertension and masked hypertension may not be sufficiently represented in this study. Also, we excluded patients with clinically overt CV diseases (such as coronary artery disease, cerebrovascular disease, and renal failure). Therefore, our results cannot be extrapolated to all hypertensive subjects. Moreover, we did not evaluate leukocyte activation markers, high-sensitivity C-reactive protein and other proinflammatory cytokines. Finally, MPV values was recorded on the first day the patients participated in the study, and we did not investigate changes in MPV values over time or the relationship between the changes and event development.
CONCLUSIONS
In conclusion, although MPV was not as strong a predictor as traditional CV risk factors such as age and DM, it was independently associated with the development of CV events. MPV is a cheap and easily available test that is routinely used in hypertension treatment practice. Therefore, it could be used for risk stratification, follow-up and treatment of hypertensive patients.
CONFLICT OF INTERESTS
All the authors declare that they have no conflict of interest. And this research received no grant from any funding agency in the public, commercial or not-for-profit sectors.
REFERENCES
- 1.Zaccardi F, Rocca B, Pitocco D, et al. Platelet mean volume, distribution width, and count in type 2 diabetes, impaired fasting glucose, and metabolic syndrome: a meta-analysis. Diabetes Me-tab Res Rev. 2015;31:402–410. doi: 10.1002/dmrr.2625. [DOI] [PubMed] [Google Scholar]
- 2.Tsiara S, Elisaf M, Jagroop IA, et al. Platelets as predictors of vascular risk: is there practical index of platelet activity? Clin Appl Thromb Hemost. 2003;9:177–190. doi: 10.1177/107602960300900301. [DOI] [PubMed] [Google Scholar]
- 3.García-Rubio D, Rodríguez-Varela M, Martínez-Vieyra I, et al. Alterations to the contents of plasma membrane structural lipids are associated with structural changes and compartmentalization in platelets in hypertension. Exp Cell Res. 2019;385:111692. doi: 10.1016/j.yexcr.2019.111692. [DOI] [PubMed] [Google Scholar]
- 4.Schmieder RE. End organ damage in hypertension. Dtsch Arztebl Int. 2010;107:866–873. doi: 10.3238/arztebl.2010.0866. [DOI] [PMC free article] [PubMed] [Google Scholar]
- 5.Pizzuli L, Yang A, Martin JF, Lüderitz B. Changes in platelet size, and count in unstable angina compared to stable angina or non-cardiac chest pain. Eur Heart J. 1998;19:80–84. doi: 10.1053/euhj.1997.0747. [DOI] [PubMed] [Google Scholar]
- 6.Sansanaydhu N, Numthavaj P, Muntham D, et al. Prognostic effect of mean platelet volume in patients with coronary artery disease. A systematic review and meta-analysis. Thromb Haemost. 2015;114:1299–1309. doi: 10.1160/TH15-04-0280. [DOI] [PubMed] [Google Scholar]
- 7.Bolat I, Akgül O, Cakmak H, et al. The prognostic value of admission mean platelet volume to platelet count ratio in patients with ST-segment elevation myocardial infarction undergoing primary percutaneus coronary intervention. Kardiol Pol. 2016;74:346–355. doi: 10.5603/KP.a2015.0179. [DOI] [PubMed] [Google Scholar]
- 8.Glud T, Schmidt EB, Kristensen SD, Arnfred T. Platelet number and volume during myocardial infarction in relation to infarct size. Acta Med Scand. 1986;220:401–405. doi: 10.1111/j.0954-6820.1986.tb02787.x. [DOI] [PubMed] [Google Scholar]
- 9.European Society of Hypertension-European Society of Cardiology Guidelines Committee. 2013 European Society of Hypertension-European Society of Cardiology guidelines for the management of arterial hypertension. Eur Heart J. 2013;34:2159–2219. doi: 10.1093/eurheartj/eht151. [DOI] [PubMed] [Google Scholar]
- 10.Expert Committee on the Diagnosis and Classification of Diabetes Mellitus. Report of the expert committee on the diagnosis and classification of diabetes mellitus. Diabetes Care. 2003;26(Suppl 1):S5–S20. doi: 10.2337/diacare.26.2007.s5. [DOI] [PubMed] [Google Scholar]
- 11.Levey AS, Stevens LA, Schmid CH, et al. Ckd EPI. A new equation to estimate glomerular filtration rate. Ann Intern Med. 2009;150:604–612. doi: 10.7326/0003-4819-150-9-200905050-00006. [DOI] [PMC free article] [PubMed] [Google Scholar]
- 12.Thygesen K, Alpert JS, White HD. Joint ESC/AHA/WHF task force for the redefinition of myocardial infarction. J Am Coll Cardiol. 2007;50:2173–2195. doi: 10.1016/j.jacc.2007.09.011. [DOI] [PubMed] [Google Scholar]
- 13.Verdecchia P, Schillaci G, Guerrieri M, et al. Circadian blood pressure changes and left ventricular hypertrophy in essential hypertension. Circulation. 1990;81:528–536. doi: 10.1161/01.cir.81.2.528. [DOI] [PubMed] [Google Scholar]
- 14.Devereux R, Koren M, de Simone G, et al. Methods for detection of left ventricular hypertrophy: application to hypertensive heart disease. Eur Heart J. 1993;14:8–15. doi: 10.1093/eurheartj/14.suppl_d.8. [DOI] [PubMed] [Google Scholar]
- 15.Siebers R, Maling T. Mean platelet volume in human essential hypertension. J Hum Hypertens. 1995;9:207. [PubMed] [Google Scholar]
- 16.Perrone-Filardi P, Coca A, Galderisi M, et al. Noninvasive cardiovascular imaging for evaluating subclinical target organ damage in hypertensive patients: a consensus article from the European Association of Cardiovascular Imaging, the European Society of Cardiology Council on Hypertension and the European Society of Hypertension. J Hypertens. 2017;35:1727–1741. doi: 10.1097/HJH.0000000000001396. [DOI] [PubMed] [Google Scholar]
- 17.Yarlioglues M, Kaya MG, Ardic I, et al. Relationship between mean platelet volume levels and subclinical target organ damage in newly diagnosed hypertensive patients. Blood Press. 2011;20:92–97. doi: 10.3109/08037051.2010.532317. [DOI] [PubMed] [Google Scholar]
- 18.Yavuzkir M, Kurtoğlu E, Yılmaz M, et al. Relationship between mean platelet volume elevation and left ventricular mass index in hypertensive patients. J Int Med Res. 2014;42:781–787. doi: 10.1177/0300060513517486. [DOI] [PubMed] [Google Scholar]
- 19.Martin JF, Bath PM, Burr ML. Influence of platelet size on outcome after myocardial infarction. Lancet. 1991;338:1409–1411. doi: 10.1016/0140-6736(91)92719-i. [DOI] [PubMed] [Google Scholar]
- 20.Chen ZX, Li N, Wang J, et al. Association between mean platelet volume and major adverse cardiac events in percutaneous coronary interventions: a systematic review and meta-analysis. Coron Artery Dis. 2020;31:722–732. doi: 10.1097/MCA.0000000000000885. [DOI] [PubMed] [Google Scholar]
- 21.Miller M, Henninger N, Słowik A. Mean platelet volume and its genetic variants relate to stroke severity and 1-year mortality. Neurology. 2020;95:1153–1162. doi: 10.1212/WNL.0000000000010105. [DOI] [PMC free article] [PubMed] [Google Scholar]
- 22.Sadeghi F, Kovács S, Zsóri K, et al. Platelet count and mean volume in acute stroke: a systematic review and meta-analysis. Platelets. 2020;31:731–739. doi: 10.1080/09537104.2019.1680826. [DOI] [PubMed] [Google Scholar]
- 23.Thompson CB, Jakubowki JA. The pathophysiology and clinical relevance of platelet heterogeneity. Blood. 1988;72:1–8. [PubMed] [Google Scholar]
- 24.Gerstein HC, Mann JF, Yi Q, et al. Albuminuria and risk of cardiovascular events, death, and heart failure in diabetic and nondiabetic individuals. JAMA. 2001;286:421–426. doi: 10.1001/jama.286.4.421. [DOI] [PubMed] [Google Scholar]
- 25.Ledvidge M, Gallagher J, Conlon C, et al. Natriuretic peptide-based screening and collaborative car for heart failure: the STOP-HF randomized trial. JAMA. 2013;310:66–74. doi: 10.1001/jama.2013.7588. [DOI] [PubMed] [Google Scholar]
- 26.Williams B, Lindholm LH, Sever P. Systolic pressure is all that matters. Lancet. 2008;371:2219–2221. doi: 10.1016/S0140-6736(08)60804-1. [DOI] [PubMed] [Google Scholar]
- 27.Andrikou I, Tsioufis C, Thomopoulos C, et al. Nighttime vs. daytime blood pressure as a predictor of changes in left ventricular mass in hypertensive subjects. Hypertens Res. 2013;36:967–971. doi: 10.1038/hr.2013.64. [DOI] [PubMed] [Google Scholar]
- 28.Mancia G, Verdecchia P. Clinical value of ambulatory blood pressure: evidence and limits. Circ Res. 2015;116:1034–1045. doi: 10.1161/CIRCRESAHA.116.303755. [DOI] [PubMed] [Google Scholar]


