Abstract
Objectives
To assess the performance of CMR myocardial perfusion mapping against invasive coronary physiology reference standards for detecting CAD (defined by fractional flow reserve (FFR)≤0.80), MVD (defined by index of microcirculatory resistance (IMR)≥25) and the ability to differentiate between the two.
Background
Differentiation of epicardial coronary artery disease (CAD) and microvascular dysfunction (MVD) in patients with stable angina remains challenging. Automated in-line CMR perfusion mapping enables quantification of myocardial blood flow (MBF) to be performed rapidly within a clinical workflow.
Methods
Fifty patients with stable angina and 15 healthy volunteers underwent adenosine stress CMR at 1.5T with quantification of MBF and myocardial perfusion reserve (MPR). FFR and IMR were measured in 101 coronary arteries during subsequent angiography.
Results
Twenty-seven patients had obstructive CAD and 23 had non-obstructed arteries (7 normal IMR, 16 abnormal IMR). FFR-positive (epicardial stenosis) areas had significantly lower stress MBF (1.47±0.48ml/g/min) and MPR (1.75±0.60) than FFR-negative IMR-positive (MVD) areas (stress MBF 2.10±0.35ml/g/min, MPR 2.41±0.79) and normal areas (stress MBF 2.47±0.50ml/g/min, MPR 2.94±0.81). Stress MBF ≤1.94ml/g/min accurately detected obstructive CAD on a regional basis (AUC 0.90, p<0.001). In patients without regional perfusion defects, global stress MBF<1.82ml/g/min accurately discriminated between obstructive 3VD and MVD (AUC 0.94 p<0.001).
Conclusions
This novel automated pixel-wise perfusion mapping technique can be used to detect physiologically significant CAD defined by FFR, MVD defined by IMR, and can be used to differentiate MVD from multi-vessel coronary disease. A CMR-based diagnostic algorithm using perfusion mapping for detection of epicardial disease and MVD warrants further clinical validation.
Keywords: CMR, myocardial blood flow, coronary artery disease, microvascular dysfunction, index of microcirculatory resistance, cardiovascular magnetic resonance
INTRODUCTION
Stable angina is a common clinical presentation that is frequently due to obstructive coronary artery disease (CAD). Invasive coronary angiography (ICA) allows for diagnosis of epicardial CAD and treatment with percutaneous coronary intervention (PCI). However, over half of patients referred for ICA for investigation of chest pain have normal or angiographically non-obstructed coronary arteries(1). Many of these patients are told their test is “normal” or given a diagnosis of microvascular dysfunction (MVD), with reassurance and no specific treatment. This is despite the fact that angina in the absence of obstructive CAD is associated with increased cardiovascular risk(2), as well as higher rates of hospital admissions and repeat coronary angiography(3).
Visual analysis of ICA is able to demonstrate coronary artery patency but fails to provide information about the physiological significance(4). Fractional flow reserve (FFR) is a pressure-derived measure that can be used to assess the severity of epicardial stenosis, and FFR-guided revascularization has been shown to be superior to angiography-guided intervention in stable CAD(5). It has emerged as the invasive reference standard for physiological assessment of stenosis severity in view of its ease of use, reproducibility and lack of variability with changes in heart rate and blood pressure(6). Index of microcirculatory resistance (IMR) is an additional invasive physiological measure that has been proposed as a useful tool to diagnose coronary MVD, independent of epicardial stenosis(7). It has been shown that over 25% of vessels with FFR>0.80 have elevated IMR, consistent with a diagnosis of MVD(8).
Stress perfusion cardiovascular magnetic resonance (CMR) has emerged as an accurate non-invasive tool for the detection of clinically significant CAD and its use has been incorporated into guidelines(9). In clinical practice, stress perfusion CMR is usually evaluated qualitatively by visual analysis of first-pass gadolinium images(10,11). This approach may be inaccurate when myocardial blood flow (MBF) is globally reduced, for example in three-vessel disease, but also does not allow reliable quantification of severity of disease or the assessment of microvascular function.
Recently, a new respiratory motion corrected myocardial perfusion method with automated in-line perfusion mapping has been developed, allowing free breathing acquisition and pixel-wise quantification of MBF(12). This dual sequence protocol provides the ability to rapidly and quantitatively assess MBF using perfusion maps generated and displayed in-line on the scanner within minutes. This would be clinically desirable to objectively assess the severity of CAD, to potentially diagnose MVD and to risk stratify patients. The sequence has recently been shown to have good repeatability in healthy subjects(13). Whilst it has been shown that there is good correlation between MBF quantified by stress CMR and positron emission tomography (PET)(14), this new sequence requires further clinical validation and assessment.
The aims of this study were 1) To validate in-line myocardial perfusion mapping against invasively measured FFR for the diagnosis of physiologically obstructive CAD, 2) To assess myocardial perfusion mapping as a tool to diagnose coronary MVD using IMR as the invasive reference standard, and 3) To assess the ability of myocardial perfusion mapping to differentiate between MVD and obstructive three-vessel CAD.
METHODS
Patients aged between 18 and 80 years with symptoms consistent with stable angina were recruited at the Royal Free Hospital, London, United Kingdom between May 2017 and May 2018. Participants underwent stress perfusion CMR with myocardial perfusion mapping prior to ICA and then measurement of FFR and IMR in all major epicardial vessels during the invasive procedure. All patients were referred for ICA for clinical reasons and underwent stress perfusion CMR prior to the invasive procedure as part of the research protocol (unless CMR was performed in the preceding 30 days for clinical reasons). Fifteen healthy volunteers (control subjects) with no symptoms and no past history of cardiovascular disease, hypertension or diabetes were also recruited and underwent stress perfusion CMR only. Ethical approval was obtained from the London Hampstead Research Ethics Committee for recruitment of patients (REC reference: 17/LO/0500) and South-Central Research Ethics Committee for recruitment of control subjects (REC reference: 17/SC/0077). All patients recruited provided written informed consent.
Exclusion Criteria:
Previous coronary artery bypass surgery, myocardial infarction (with transmural late gadolinium enhancement), unstable symptoms (including crescendo angina, angina at rest or acute coronary syndrome), standard contraindications to CMR or adenosine, or estimated glomerular filtration rate <30ml/min/1.73m2 were excluded.
Stress perfusion CMR image acquisition and analysis:
All patients underwent stress perfusion CMR at 1.5T (Magnetom Aera, Siemens Healthcare, Erlangen, Germany). Scans were performed in accordance with local protocol and patients were asked to refrain from caffeine for at least 12 hours prior to the scan. Basal, mid-ventricular and apical short-axis perfusion images were acquired both at rest and during hyperaemia. Hyperaemia was induced using adenosine infused via a peripheral cannula at a rate of 140mcg/kg/min for 4 minutes with a further 2 minutes at 175mcg/kg/min if there was evidence of insufficient stress (such as no heart rate response and no symptoms). Image acquisition was performed over 60 heartbeats with a bolus of 0.05mmol/kg gadoterate meglumine (Dotarem, Guerbet SA, Paris, France) administered at 4ml/sec followed by a 20ml saline flush during acquisition of the perfusion sequence. The perfusion sequence protocol has been described previously and further details are provided in the supplementary material (12).
Perfusion maps were analysed using offline using Osirix MD 9.0 (Bernex, Switzerland). The endo- and epicardial borders were manually delineated for each basal, mid-ventricular and apical perfusion map, excluding obvious image artefacts and coronary arteries. Average MBF in ml/g/min was assessed per coronary artery territory according the 17-segment model modified for coronary dominance and excluding the apical segment(15). Myocardial perfusion reserve (MPR) was also calculated, defined as the ratio between MBF at stress over rest. Global MBF in ml/g/min was calculated by averaging MBF across the three slices and global MPR was calculated as the ratio between global stress MBF and global rest MBF. First-pass perfusion images were also analysed visually by two experienced observers blinded to the findings of the coronary angiograms, coronary physiology and perfusion maps.
Invasive coronary physiology measures and analysis:
Where possible, indices of coronary physiology were obtained in all major epicardial vessels. Measurements were obtained using a coronary PressureWire (St Jude Medical, St Paul, Minnesota) connected to a RadiAnalyzer (St Jude Medical, St Paul, Minnesota). FFR≤0.80 and IMR≥25 were defined as abnormal(5,7). Small, non-dominant vessels were not interrogated. Where a vessel had a critical stenosis (>95% stenosis diameter) and it was assessed by the operator to be unsafe to pass a pressure wire, it was assumed that the vessel had FFR<0.80. For regional per-territory analysis, each vessel was classified as follows: obstructive CAD – FFR≤0.80; MVD – FFR>0.80 and IMR≥25; Normal – FFR>0.80 and IMR<25. For global analysis, patients were classified into the following groups: Single vessel disease – FFR≤0.80 in one epicardial artery; Double vessel disease – FFR≤0.80 in two epicardial arteries; three-vessel disease – FFR≤0.80 in all 3 epicardial arteries; MVD – FFR>0.80 in all 3 epicardial arteries and IMR≥25 in at least one artery; Normal coronary physiology (NCP) – FFR>0.80 and IMR<25 in all epicardial vessels. Further details of the coronary physiology protocol are described in the supplementary material.
Statistical analysis:
All continuous variables were tested for normal distribution (Shapiro-Wilk test). Normally distributed metrics are summarized by the mean ± standard deviation (SD). For normally distributed variables, the unpaired Student t-test was used to compare the means between two groups and one-way analysis of variance (ANOVA) with post-hoc Bonferroni correction to compare the means of multiple groups. Data that were not normally distributed are summarized by the median (interquartile range). Correlations between continuous variables were evaluated by the Spearman correlation coefficient (rho). Receiver-operator characteristic (ROC) curves were compared using the Delong method. The Youden index was used to identify optimal stress MBF and MPR cut-offs on a per-territory basis using all coronary territories combined and also by individual coronary territory. A p value of <0.05 was considered statistically significant. No adjustments were made for MBF or physiology measurements within individuals. ROC analyses were performed using MedCalc 13.2.1.0 (Ostend, Belgium). All other statistical analysis was performed using IBM SPSS Statistics Version 24 (IBM, Somers, New York).
RESULTS
Fifty-four patients and 15 control subjects were prospectively enrolled (Supplementary Figure 1). Two participants were excluded following stress perfusion CMR, one because of evidence of previous transmural myocardial infarction on late gadolinium imaging and the other because of inadequate stress due to recent caffeine intake. Two participants did not undergo coronary physiology assessment, both due to operational issues. In total, 50 patients (mean age 63±8 years, 40 (80%) males) underwent both stress perfusion CMR and coronary physiology assessment. In total, FFR and IMR were determined in 101 vessels and FFR only in 13 vessels. Twenty-three vessels had critical stenoses (assessed by the operator to be unsafe to pass a pressure wire) and were presumed to have FFR≤0.80.
Twenty-seven patients had obstructive CAD, defined as FFR≤0.80 in at least one major epicardial vessel. FFR was abnormal in 48 vessels (14 single vessel disease, 5 two-vessel disease, and 8 three-vessel disease). FFR was positive in the left anterior descending artery in 25 cases, circumflex artery in 11 cases and right coronary artery in 12 cases. Twenty-three patients had non-obstructive CAD, defined as FFR>0.80 in all three major epicardial vessels. Of these, 16 had evidence of MVD, defined as IMR≥25 in at least one epicardial vessel. Seven patients had FFR>0.80 and IMR<25 in all epicardial vessels and these were therefore defined as “patients with normal coronary physiology (NCP)”. No patients included in the analysis had evidence of transmural LGE. Six patients (12%) had evidence of subendocardial (<50% wall thickness) LGE (average 2.3±1.2 segments). Baseline characteristics are summarised in Table 1.
Table 1:
Patient characteristics
| Patients with obstructive CAD (n=27) | Patients with non-obstructive CAD (n=23) | Control subjects (n=15) | ||
|---|---|---|---|---|
| Male | 25 (93%) | 15 (65%) | 13 (87%) | |
| Age, years (mean±SD) | 62±9 | 64±8 | 45±8 | |
| Ethnicity | Caucasian | 15 (56%) | 18 (78%) | 8 (53%) |
| Asian | 12 (44%) | 4 (17%) | 4 (27%) | |
| Afro-carribean | 0 (0%) | 1 (4%) | 3 (20%) | |
| Height, meters (mean±SD) | 1.7±0.1 | 1.7±0.1 | 1.8±0.1 | |
| Weight, kilograms (mean±SD) | 92±20 | 89±15 | 83±16 | |
| Diabetes | 9 (33%) | 9 (39%) | 0 (0%) | |
| Hypertension | 15 (56%) | 17 (74%) | 0 (0%) | |
| Hyperlipidaemia | 25 (93%) | 15 (65%) | 0 (0%) | |
| Family history of IHD | 13 (48%) | 14 (61%) | 5 (33%) | |
| Previous stroke or TIA | 2 (7.4%) | 2 (9%) | 0 (0%) | |
| Peripheral vascular disease | 1 (4%) | 2 (9%) | 0 (0%) | |
| Previous PCI | 2 (7%) | 1 (4%) | 0 (0%) | |
| Atrial fibrillation | 0 (0%) | 1 (4%) | 0 (0%) | |
| LVEF (%) | 67±10 | 68±5 | 69±6 | |
| LV mass index, g/m2 | 62±11 | 56±7 | 53±6 | |
| Smoking | Current | 6 (22%) | 3 (13%) | 0 (0%) |
| Ex-smoker | 10 (37%) | 9 (39%) | 2 (13%) | |
| Angina class | CCS class 1 | 8 (30%) | 9 (39%) | 0 (0%) |
| CCS class 2 | 14 (52%) | 12 (52%) | 0 (0%) | |
| CCS class 3 | 5 (19%) | 2 (9%) | 0 (0%) | |
CAD, coronary artery disease; CCS, Canadian Cardiovascular Society; IHD, ischaemic heart disease; LV, left ventricular; LVEF, left ventricular ejection fraction; PCI, percutaneous coronary intervention; SD, standard deviation; TIA, transient ischaemic attack.
Regional stress MBF and MPR for detection of obstructive CAD
Mean stress MBF and MPR were reduced in myocardial territories supplied by vessels with FFR≤0.80 (Mean stress MBF: 1.47±0.48ml/g/min FFR≤0.80 vs 2.30±0.49ml/g/min FFR>0.80, p<0.001; MPR: 1.75±0.60 FFR≤0.80 vs 2.78±0.84 FFR>0.80, p<0.001) (Figure 1). Examples of stress perfusion maps and corresponding coronary angiogram images of a patient with severe obstructive single-vessel disease are displayed in Figure 2. Including only vessels in which FFR was measured, there were weak correlations between stress MBF and MPR with FFR (stress MBF and FFR: rho = 0.400, p<0.001; MPR and FFR: rho = 0.426, p<0.001). However, in vessels where FFR≤0.80 there was a linear relationship between stress MBF and FFR (FFR=0.35+(0.002 × stress MBF), R2=0.502, p<0.001) (Figure 3).
Figure 1: Myocardial blood flow and FFR.
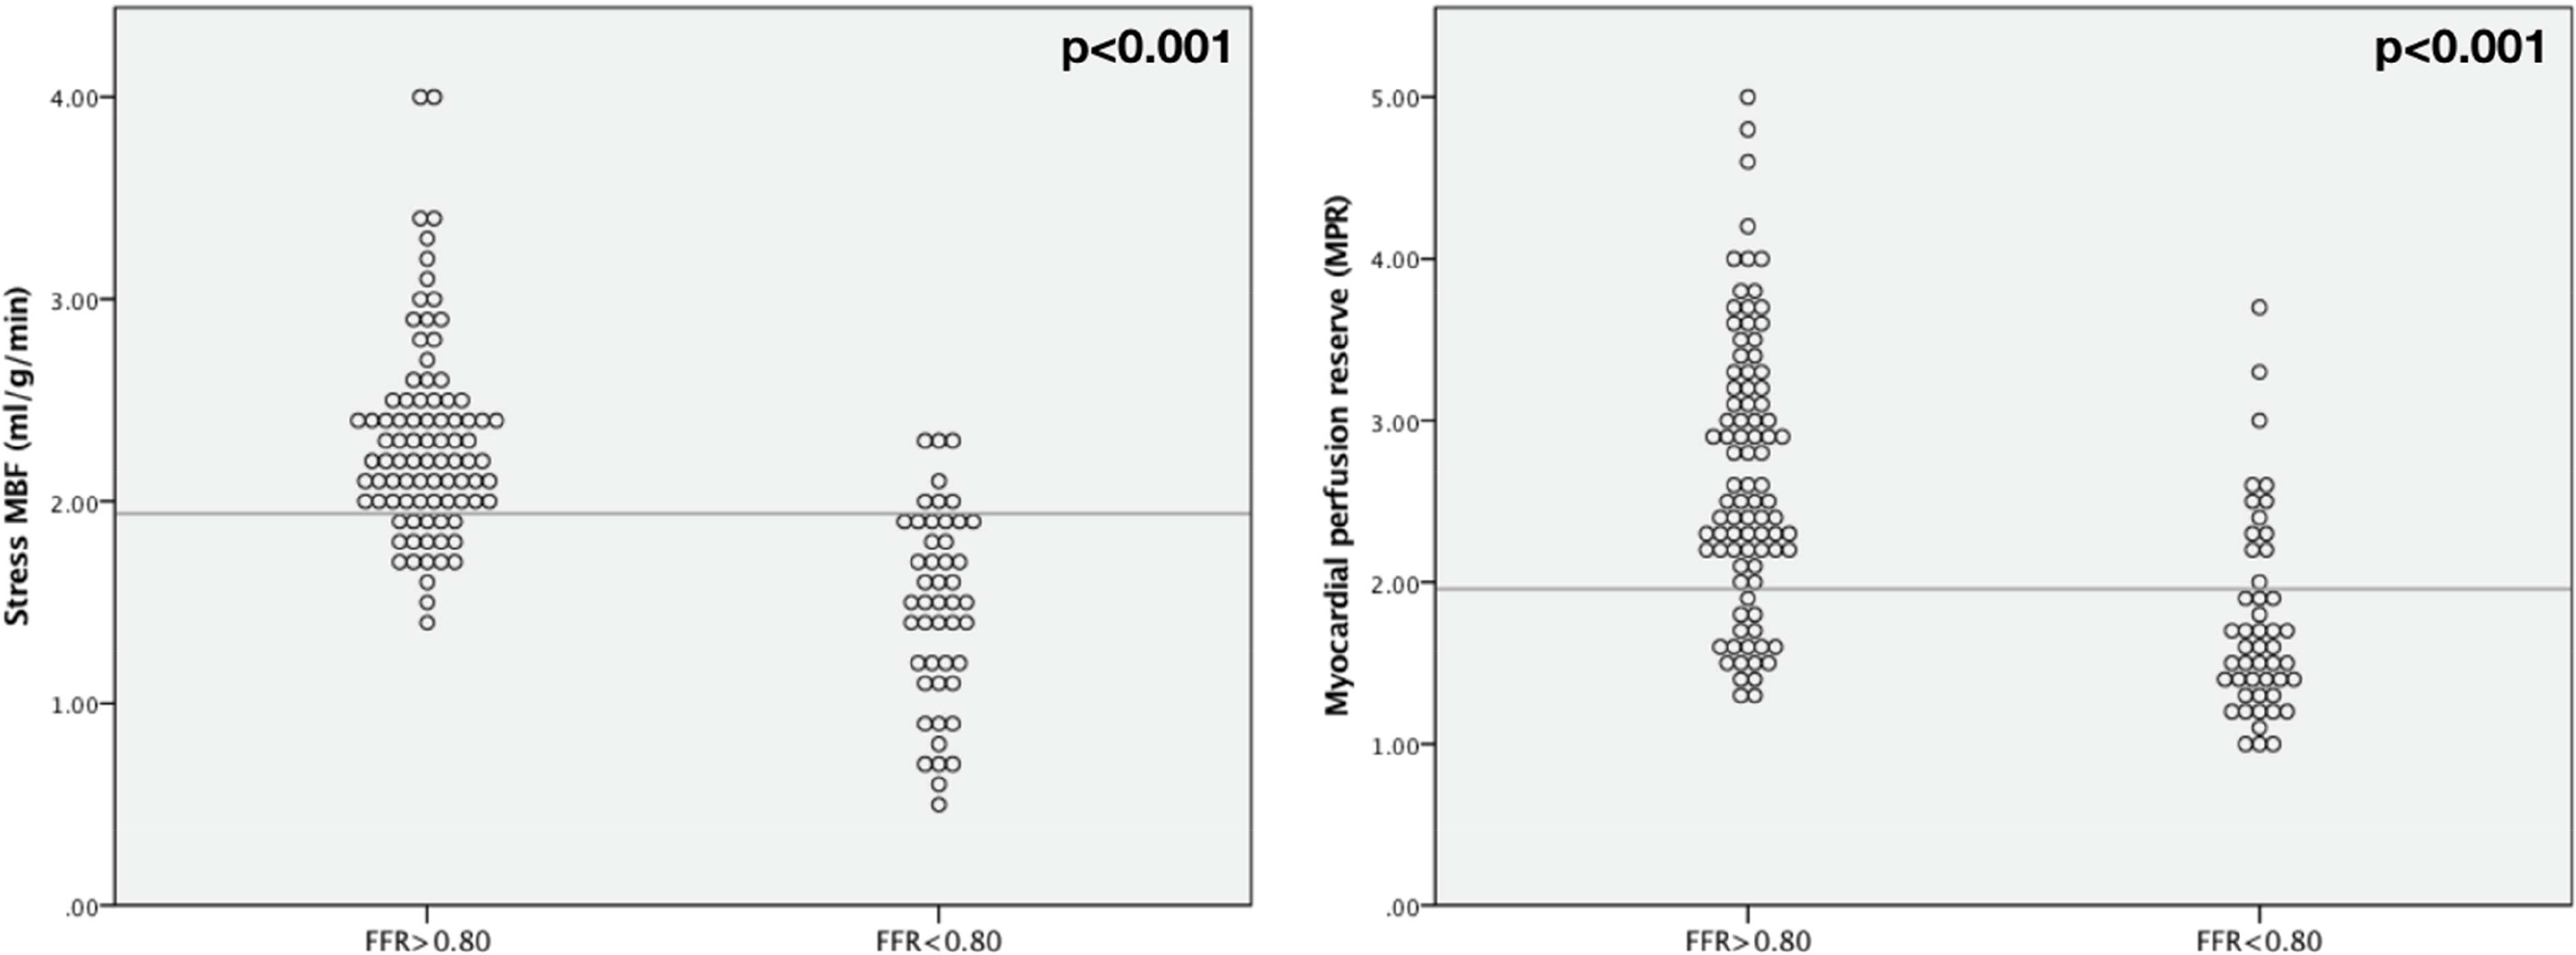
Scatter plots showing distribution of stress MBF and MPR according to FFR.
Figure 2: Perfusion maps in single vessel disease.
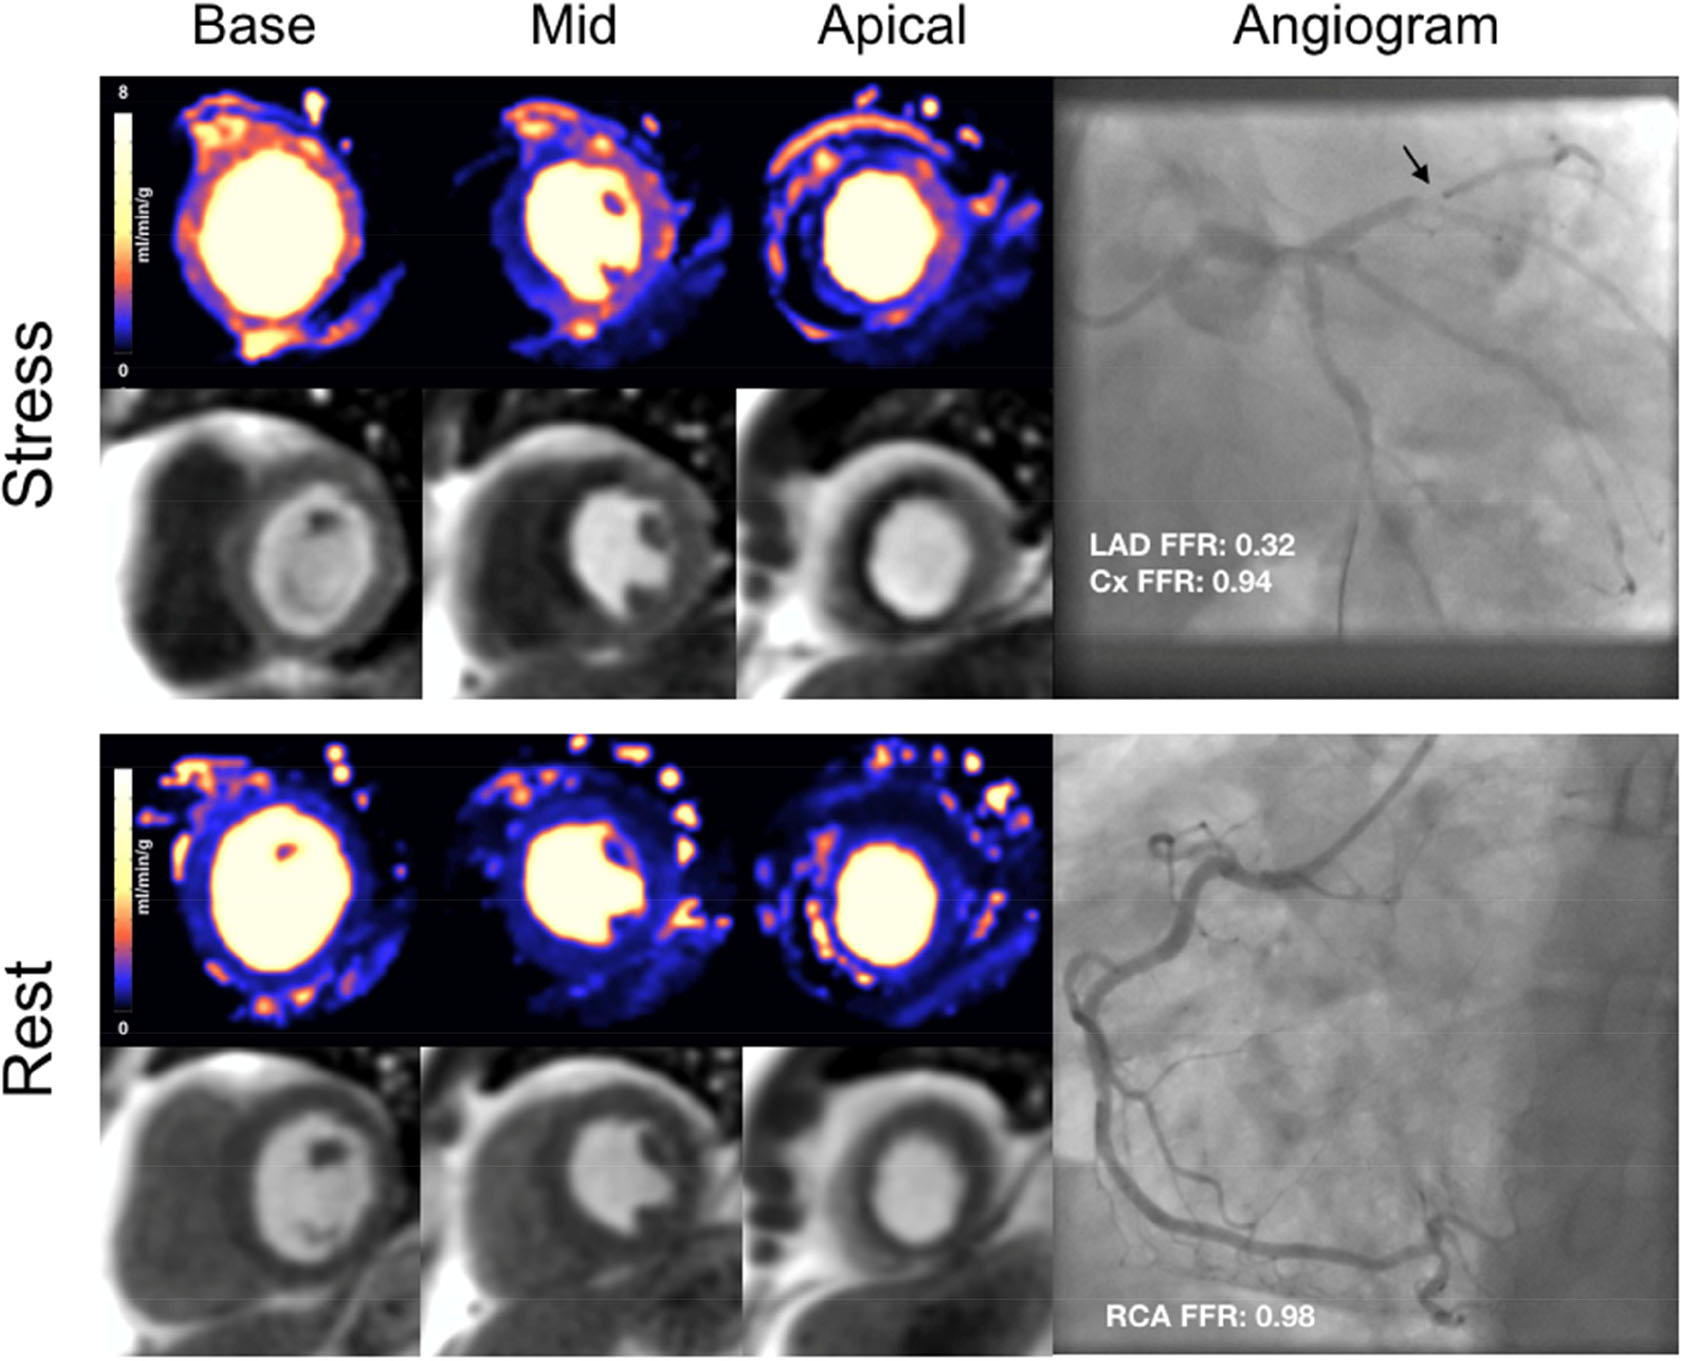
Stress perfusion maps, first pass perfusion images and corresponding coronary angiogram of a 54-year old male with severe stenosis in the mid-LAD. (Cx: circumflex artery; LAD: left anterior descending artery; RCA: right coronary artery)
Figure 3: Stress MBF and FFR.
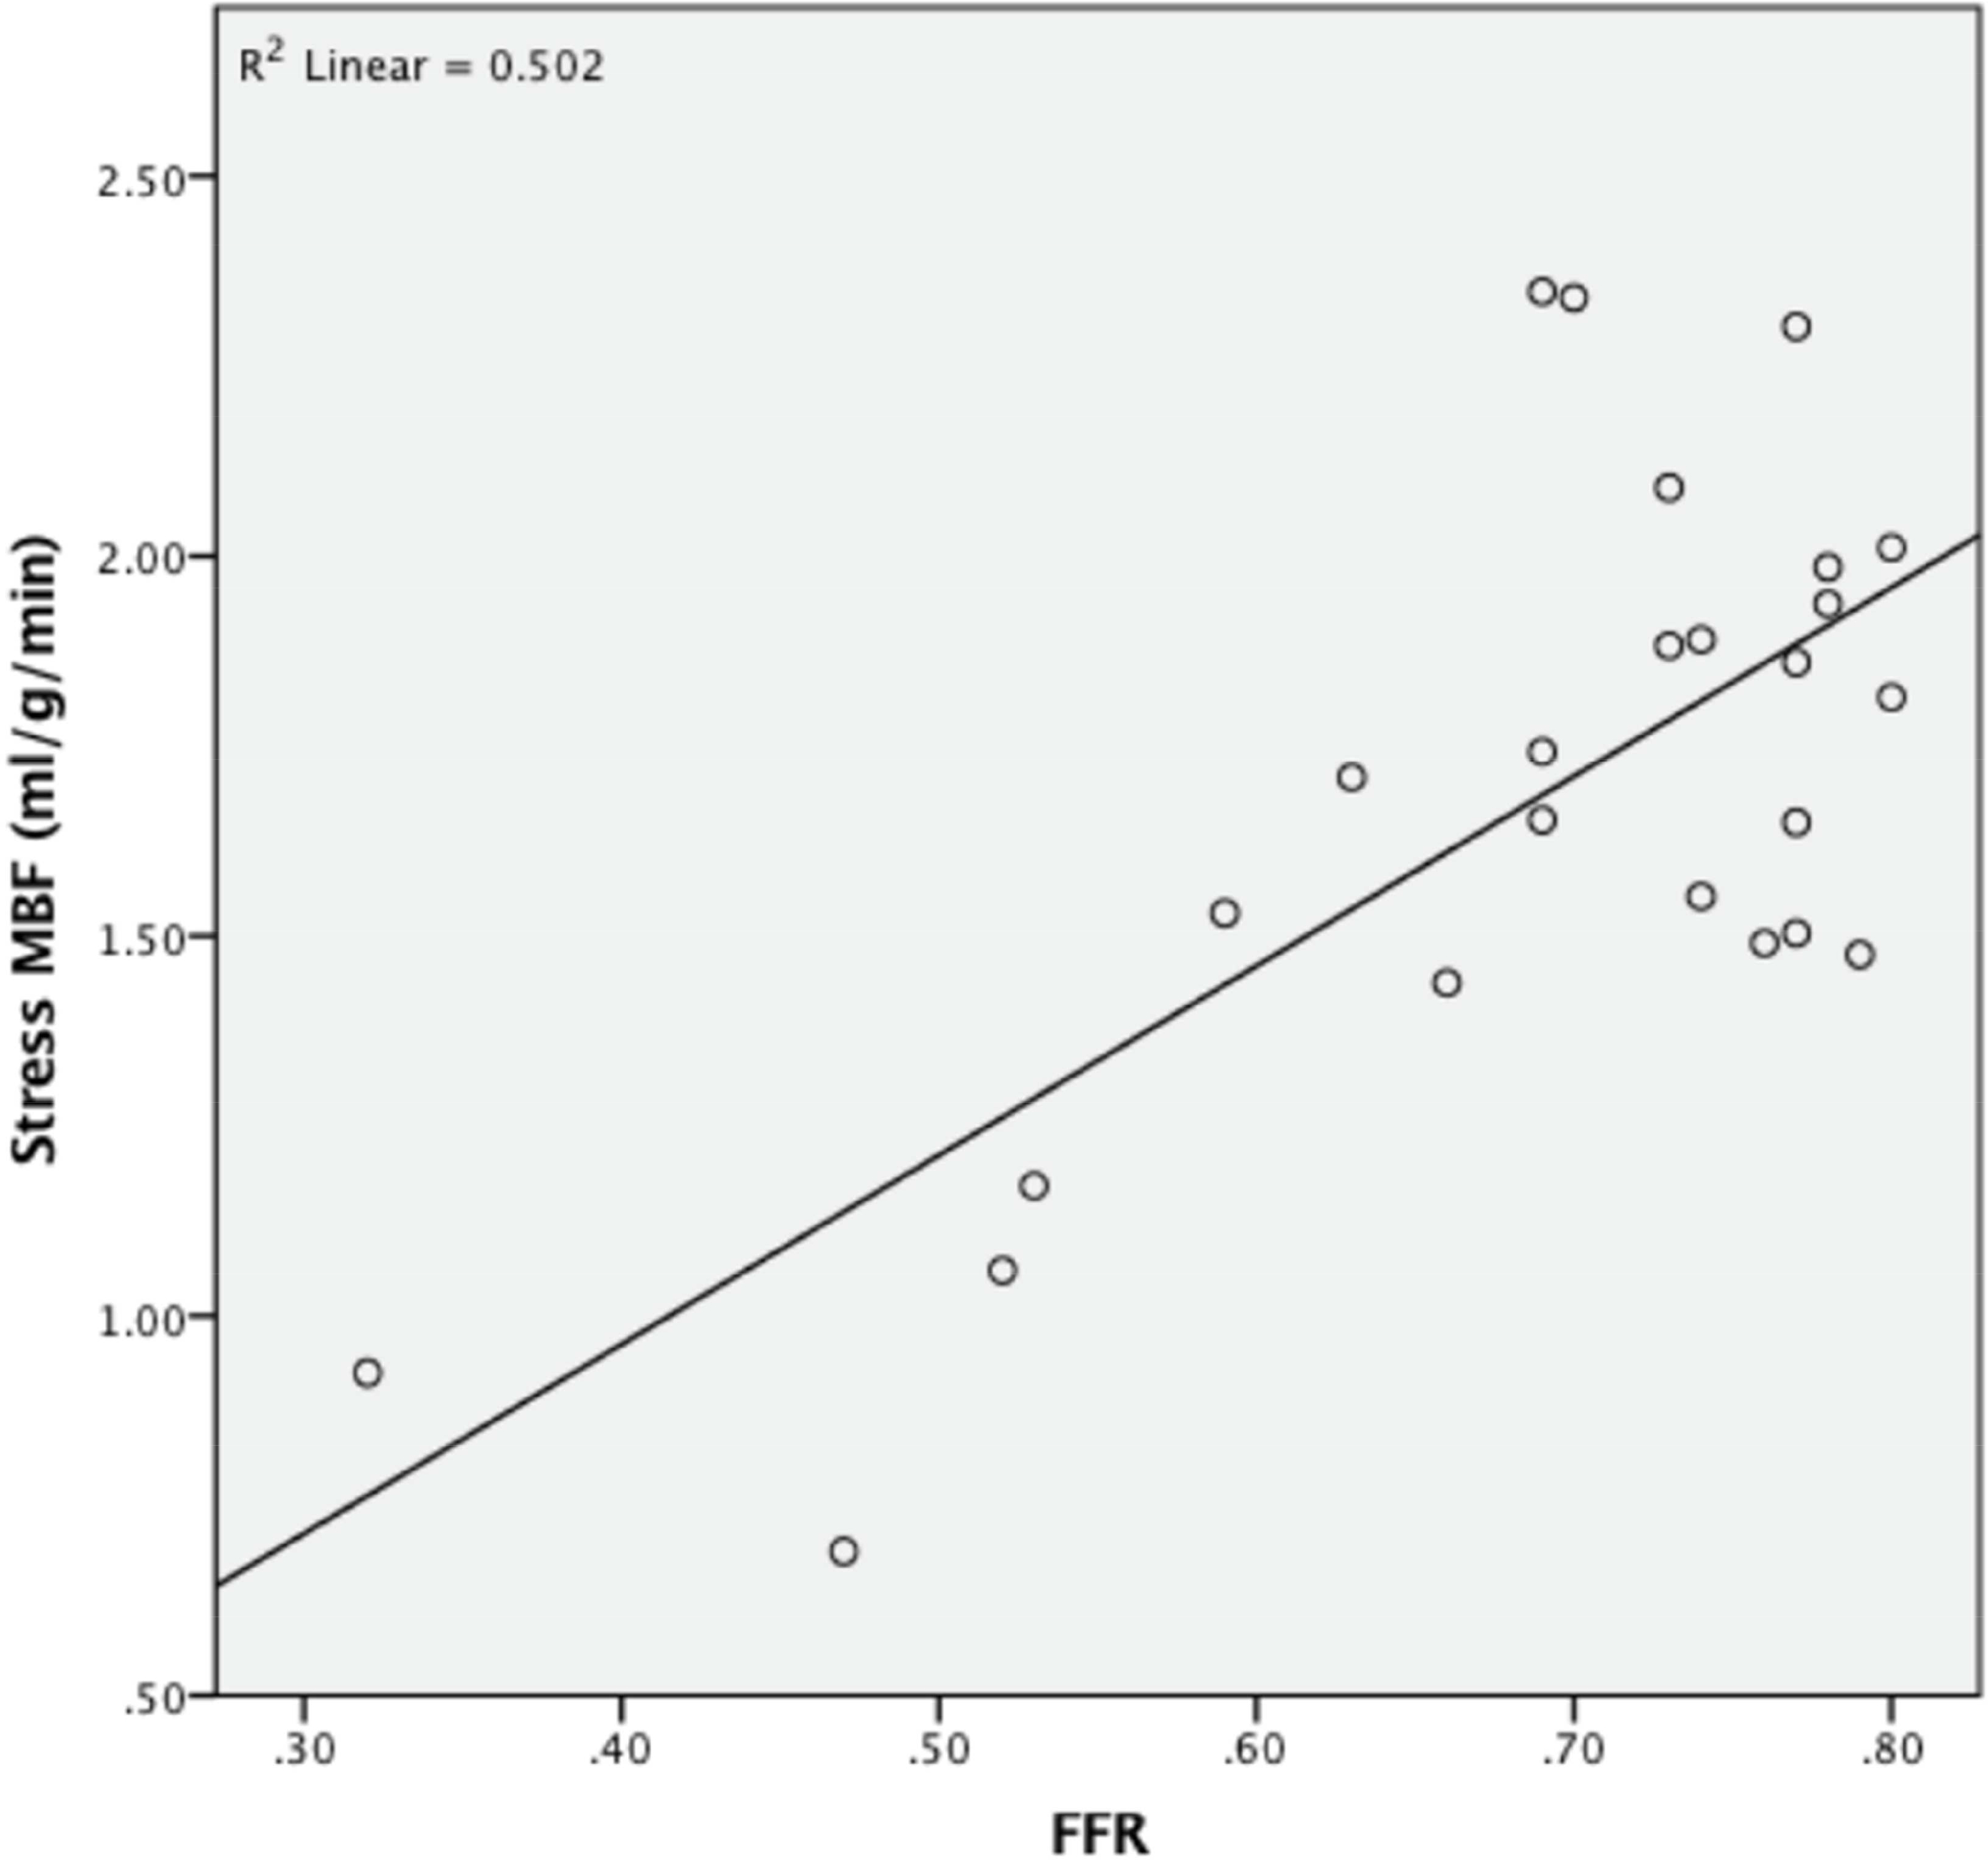
Relationship between stress MBF and FFR in vessels with physiologically significant stenosis (FFR≤0.80).
ROC analysis was performed to assess the performance of regional stress MBF and MPR to predict FFR≤0.80 on a per-territory basis using all coronary arteries. Stress MBF had areaunder-the-curve (AUC) of 0.90 (95% confidence interval (CI) 0.85–0.96, p<0.001) and MPR had AUC 0.82 (95% CI 0.75–0.90, p<0.001), with stress MBF performing significantly better (p=0.0364). When combining all coronary territories, the optimal cut-off value for stress MBF was 1.94ml/g/min, with 85% sensitivity, 81% specificity, positive predictive value (PPV) 70.1% and negative predictive value (NPV) 91%. The optimal MPR cut-off value was 1.96, with 75% sensitivity, 80% specificity, PPV 67% and NPV 86% (Figure 4a). For visual analysis of first-pass perfusion images, sensitivity was 81% and specificity 80% (global agreement 86%, kappa 0.72).
Figure 4: Diagnostic performance of stress MBF and MPR.
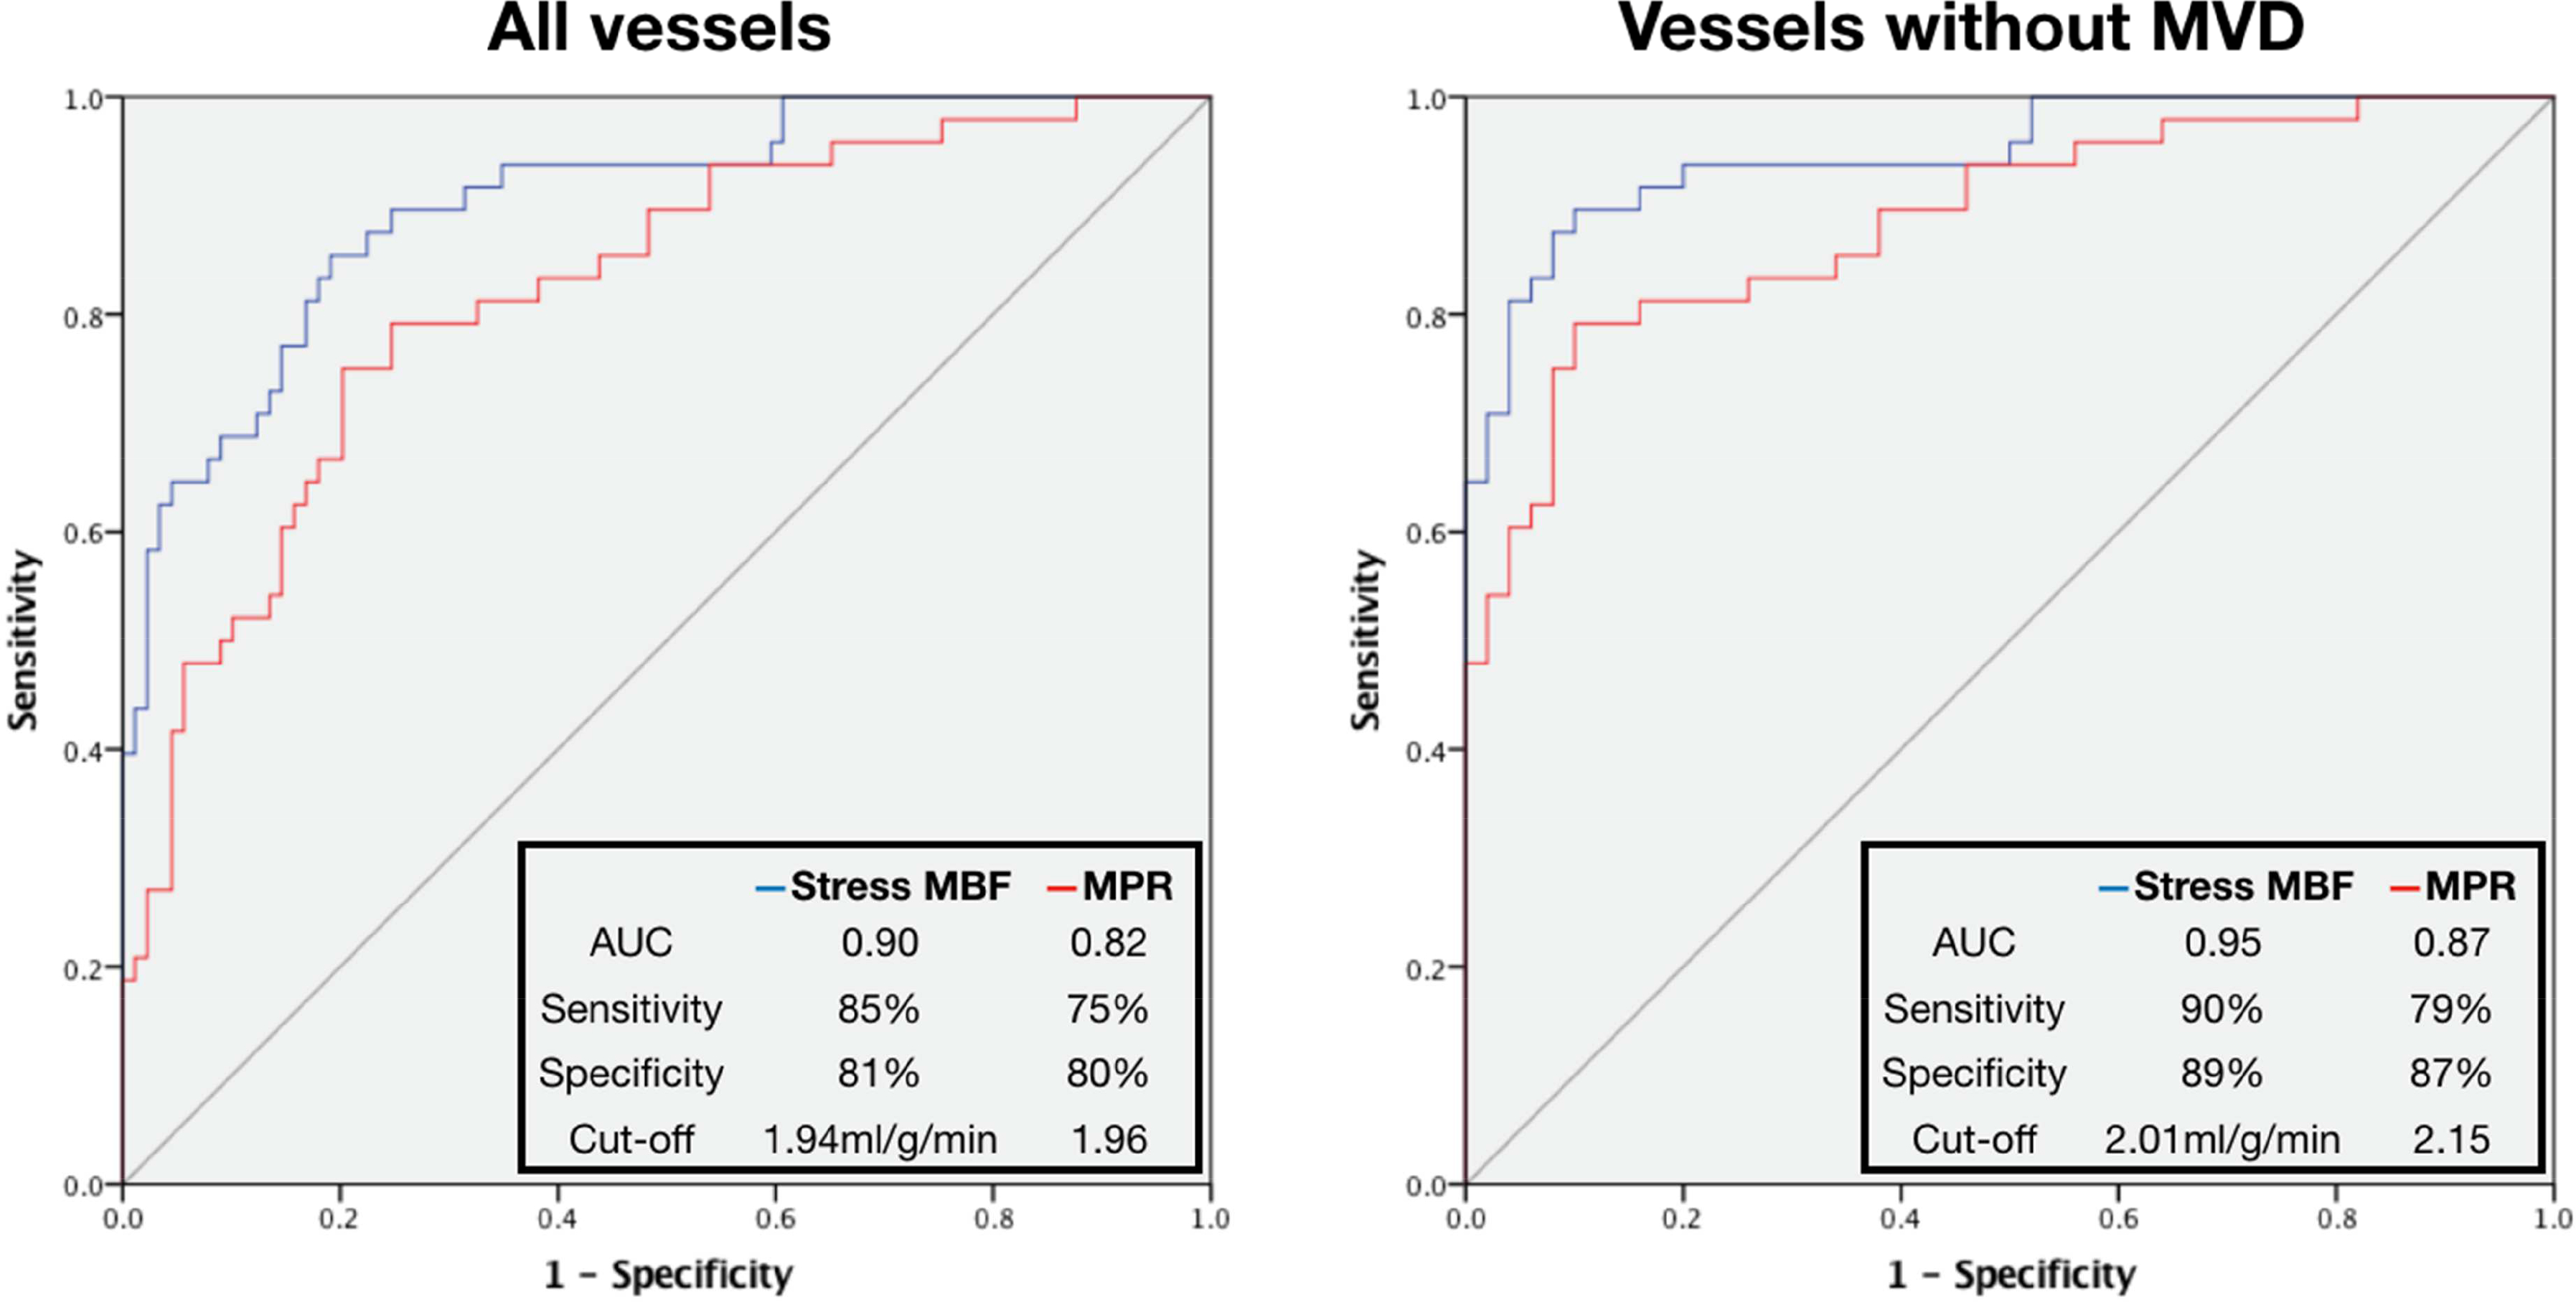
ROC curves for prediction of positive FFR on per-territory analysis.
After removal of vessels with abnormal IMR (MVD areas), the diagnostic accuracy of stress MBF and MPR improved significantly (Stress MBF: AUC 0.95 (95% CI 0.88–0.98), optimal cut-off 2.01ml/g/min, sensitivity 90%, specificity 89%, PPV 88%, NPV 90%, p<0.001; MPR: AUC 0.87 (95% CI 0.78–0.93), optimal cut-off 2.15, sensitivity 79%, specificity 87% PPV 84%, NPV 82%, p<0.001), with stress MBF remaining superior to MPR (p=0.0322)(Figure 4b). Analysis was also performed separately for each coronary territory with stress MBF AUC 0.90 for LAD, 0.91 for Cx and 0.98 for RCA (Table 2). When these thresholds and the combined threshold (1.94ml/g/min) were retested in the same cohort, the accuracy of using separate thresholds for each territory to detect obstructive disease was 85%, and using the combined threshold was 82% (Supplementary Figure 2).
Table 2:
Per-territory ROC analysis for prediction of positive FFR
| Territory | Number | AUC (95% CI) | Optimal cut-off | Sensitivity (%) | Specificity (%) | p-value |
|---|---|---|---|---|---|---|
| Stress MBF | ||||||
| LAD | 50 | 0.90 (0.78–0.96) | ≤1.88ml/g/min | 72 | 92 | <0.001 |
| Cx | 46 | 0.91 (0.79–0.98) | ≤2.01ml/g/min | 100 | 77 | <0.001 |
| RCA | 41 | 0.98 (0.88–1.00) | ≤1.50ml/g/min | 92 | 97 | <0.001 |
| All territories | 137 | 0.90 (0.85–0.96) | ≤1.94ml/g/min | 85 | 81 | <0.001 |
| MPR | ||||||
| LAD | 50 | 0.74 (0.59–0.85) | ≤1.54 | 52 | 88 | <0.001 |
| Cx | 46 | 0.82 (0.68–0.92) | ≤2.15 | 82 | 80 | <0.001 |
| RCA | 41 | 0.91 (0.77–0.97) | ≤2.15 | 92 | 79 | <0.001 |
| All territories | 137 | 0.82 (0.75–0.90) | ≤1.96 | 75 | 80 | <0.001 |
AUC, area-under-the-curve; Cx, circumfelex artery; LAD, left anterior descending artery, RCA, right coronary artery
Diagnosis of regional coronary MVD
In total, 34 vessels (38%) had abnormal IMR in the presence of FFR>0.80 (unobstructed vessels), 28 vessels in patients with non-obstructive CAD and 6 unobstructed vessels in patients one or two-vessel obstructive disease. In unobstructed vessels, stress MBF and MPR were reduced in myocardial territories supplied by arteries with IMR≥25 (mean stress MBF: 2.10±0.35ml/g/min IMR≥25 vs 2.47±0.50ml/g/min IMR<25, p<0.001; MPR: 2.41±0.79 IMR≥25 vs 2.94±0.81 IMR<25, p=0.004). Stress MBF correlated better with IMR compared to MPR with IMR (stress MBF and IMR: rho = −0.368, p=0.001, MPR and IMR: rho = −0.244, p=0.025), with regression analysis showing a non-linear relationship (Supplementary Figure 3). ROC analysis showed an optimal cut-off value for regional stress MBF of ≤2.19ml/g/min to predict abnormal IMR in that territory with sensitivity 71%, specificity 70%, PPV 62% and NPV 78% (AUC 0.73 (95% CI 0.63–0.84), p<0.001). The optimal regional MPR cut-off to predict abnormal IMR was ≤2.06 (sensitivity 44%, specificity 92%, PPV 47% and NPV 66% (AUC 0.68 (95% CI 0.56–0.80), p=0.004). There was no difference in performance between stress MBF and MPR (p=0.4078).
Myocardial perfusion mapping to differentiate epicardial disease from coronary MVD and normal
On global analysis of patients with no apparent regional perfusion defects, obstructive three-vessel disease showed the greatest reduction in global stress MBF and MPR with MVD showing moderate reduction compared to patients with NCP (FFR>0.80 and IMR<25 in all three vessels) and control subjects (global stress MBF: 1.40±0.57ml/g/min three-vessel disease vs 2.03±0.30ml/g/min MVD vs 2.74±0.64ml/g/min patients with NCP vs 3.17±0.65ml/g/min control subjects, p<0.001 between groups and p<0.05 for all individual comparisons except patients with NCP vs control subjects (Figures 5 and 6); MPR: 1.71±0.70 three-vessel disease vs 2.37±0.73 MVD vs 2.59±0.59 patients with NCP vs 4.11±0.62 control subjects, p<0.001 between groups and p<0.01 for control subjects vs all others, non-significant for all other individual comparisons). There was no significant difference in rest perfusion between the groups (global rest perfusion: 0.85±0.32ml/g/min three-vessel disease vs 0.92±0.28ml/g/min MVD vs 1.09±0.31ml/g/min patients with NCP vs 0.78±0.18ml/g/min control subjects, non-significant for all comparisons).
Figure 5: Global stress MBF and disease type.
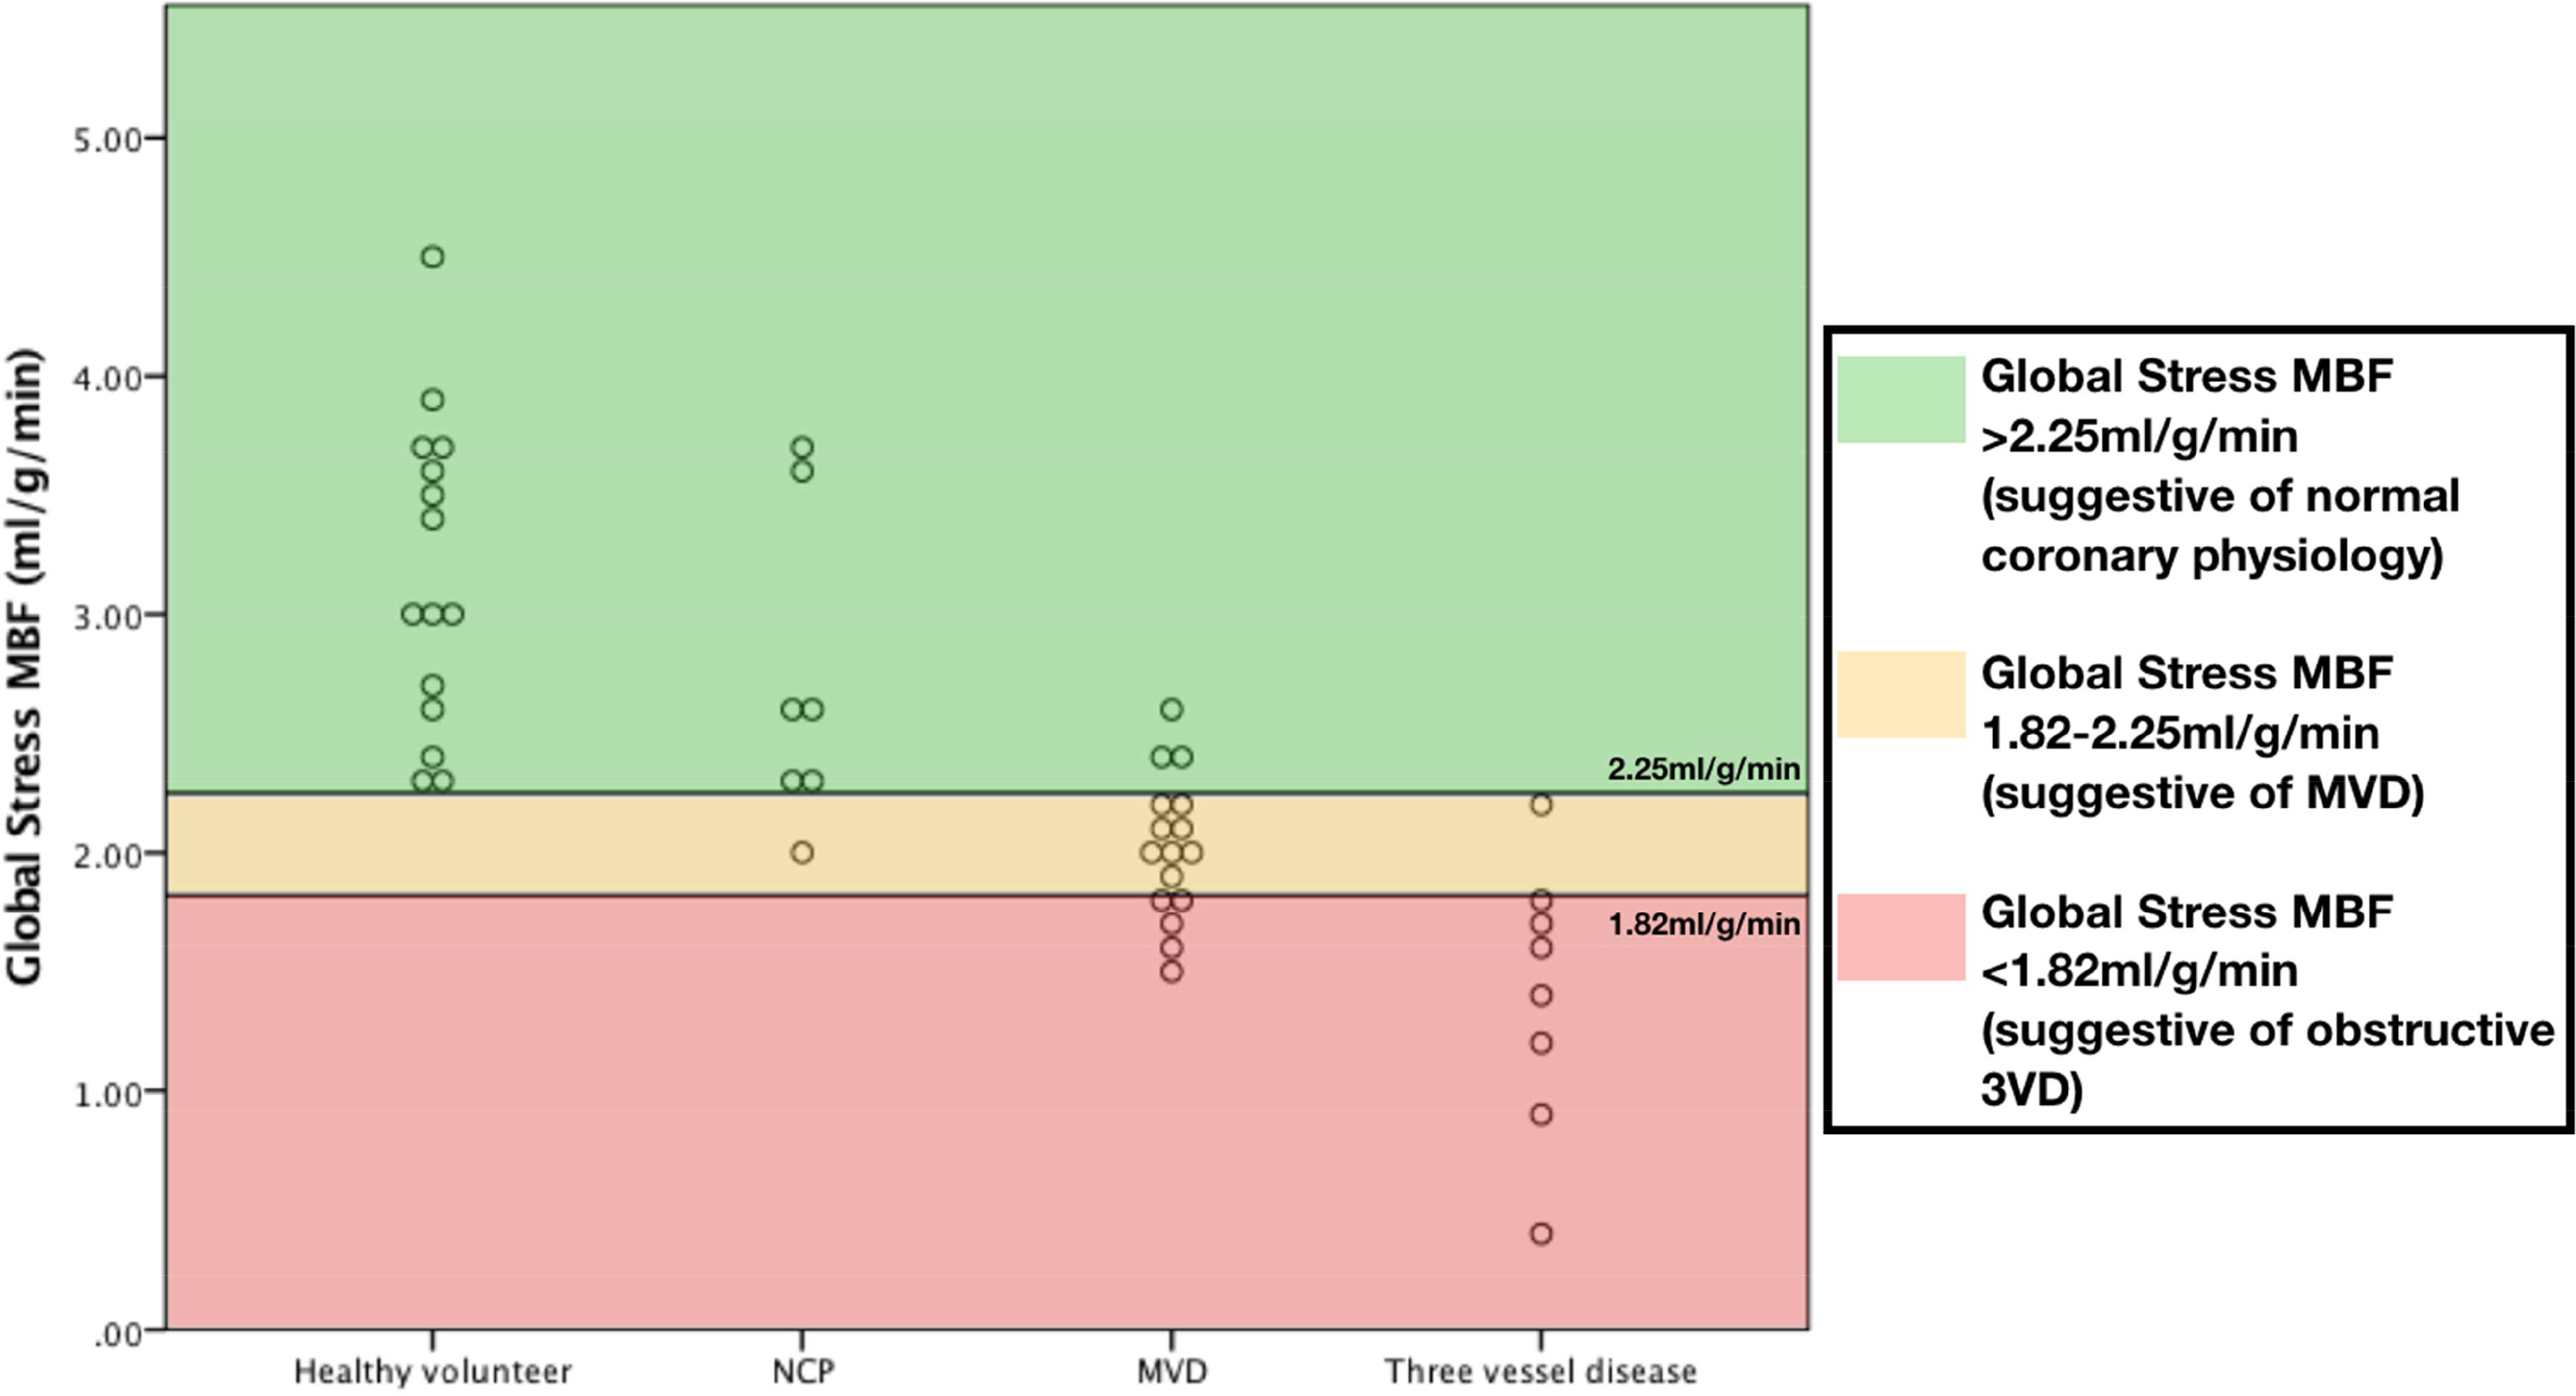
Scatter plots showing distribution of global stress MBF according to disease type.
Figure 6: Perfusion maps in three-vessel disease, MVD and unobstructed coronaries.
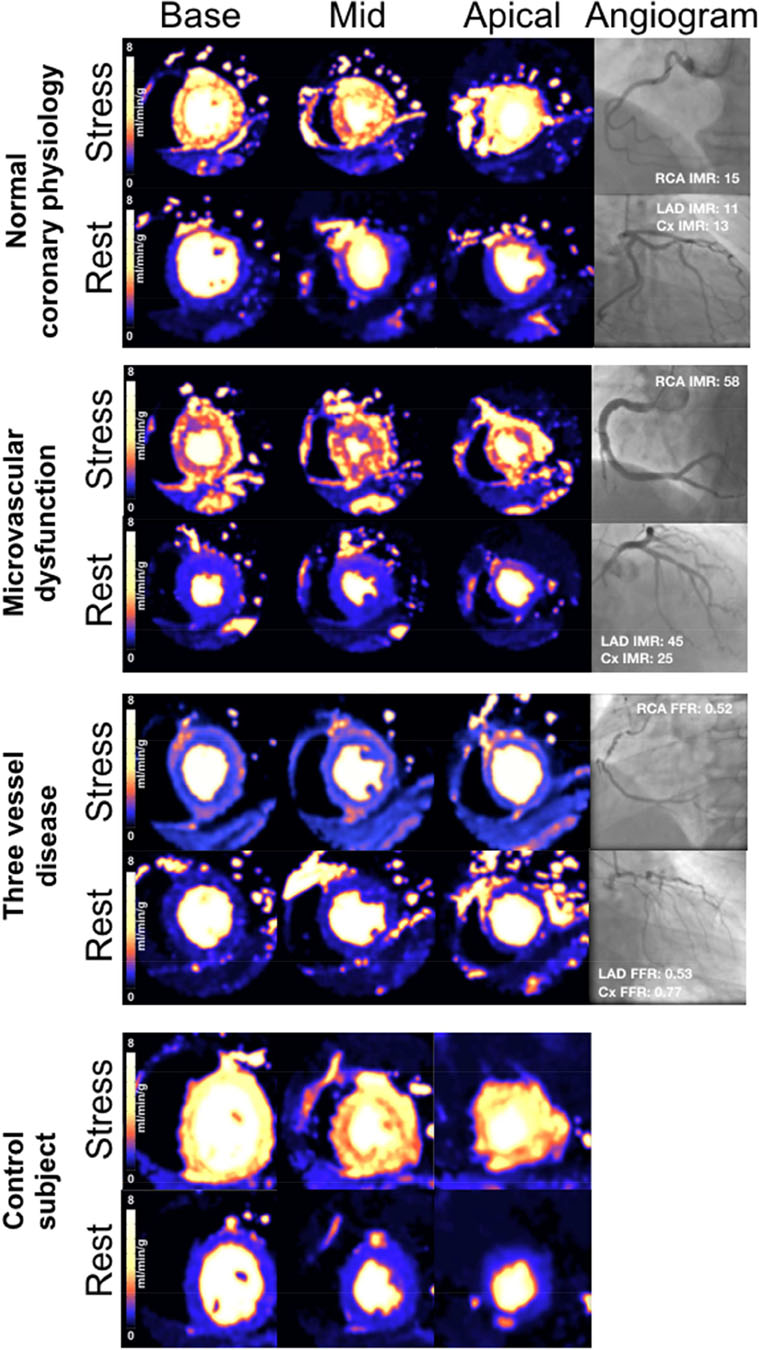
Examples of stress perfusion maps and corresponding coronary angiograms of three patients: normal coronary physiology in all vessels, MVD and severe three-vessel coronary disease. Lower panel shows stress perfusion maps of a control subject (Cx: circumflex artery; LAD: left anterior descending artery; RCA: right coronary artery)
ROC analysis showed that global stress MBF >2.25ml/g/min was able to differentiate normal from abnormal (obstructive CAD or MVD) with 95% sensitivity and 88% specificity (PPV 88%, NPV 96%, AUC 0.96 (95% CI 0.85–0.99), p<0.001). A global stress MBF ≤1.82ml/g/min was able to differentiate three-vessel disease from MVD and normal with sensitivity 88% and specificity 89% (PPV 64%, NPV 97%, AUC 0.94 (95% CI 0.82–0.99), p<0.001). When these cut-offs were retested within the same cohort, accuracy was 80.4% (Supplementary Figure 4). When visual analysis of first-pass perfusion images was combined with global stress MBF, the accuracy improved to 84.8% with 100% sensitivity and 92% specificity for the detection of three-vessel disease (Figure 7).
Figure 7: Differentiation of microvascular dysfunction from 3-vessel disease and normal.
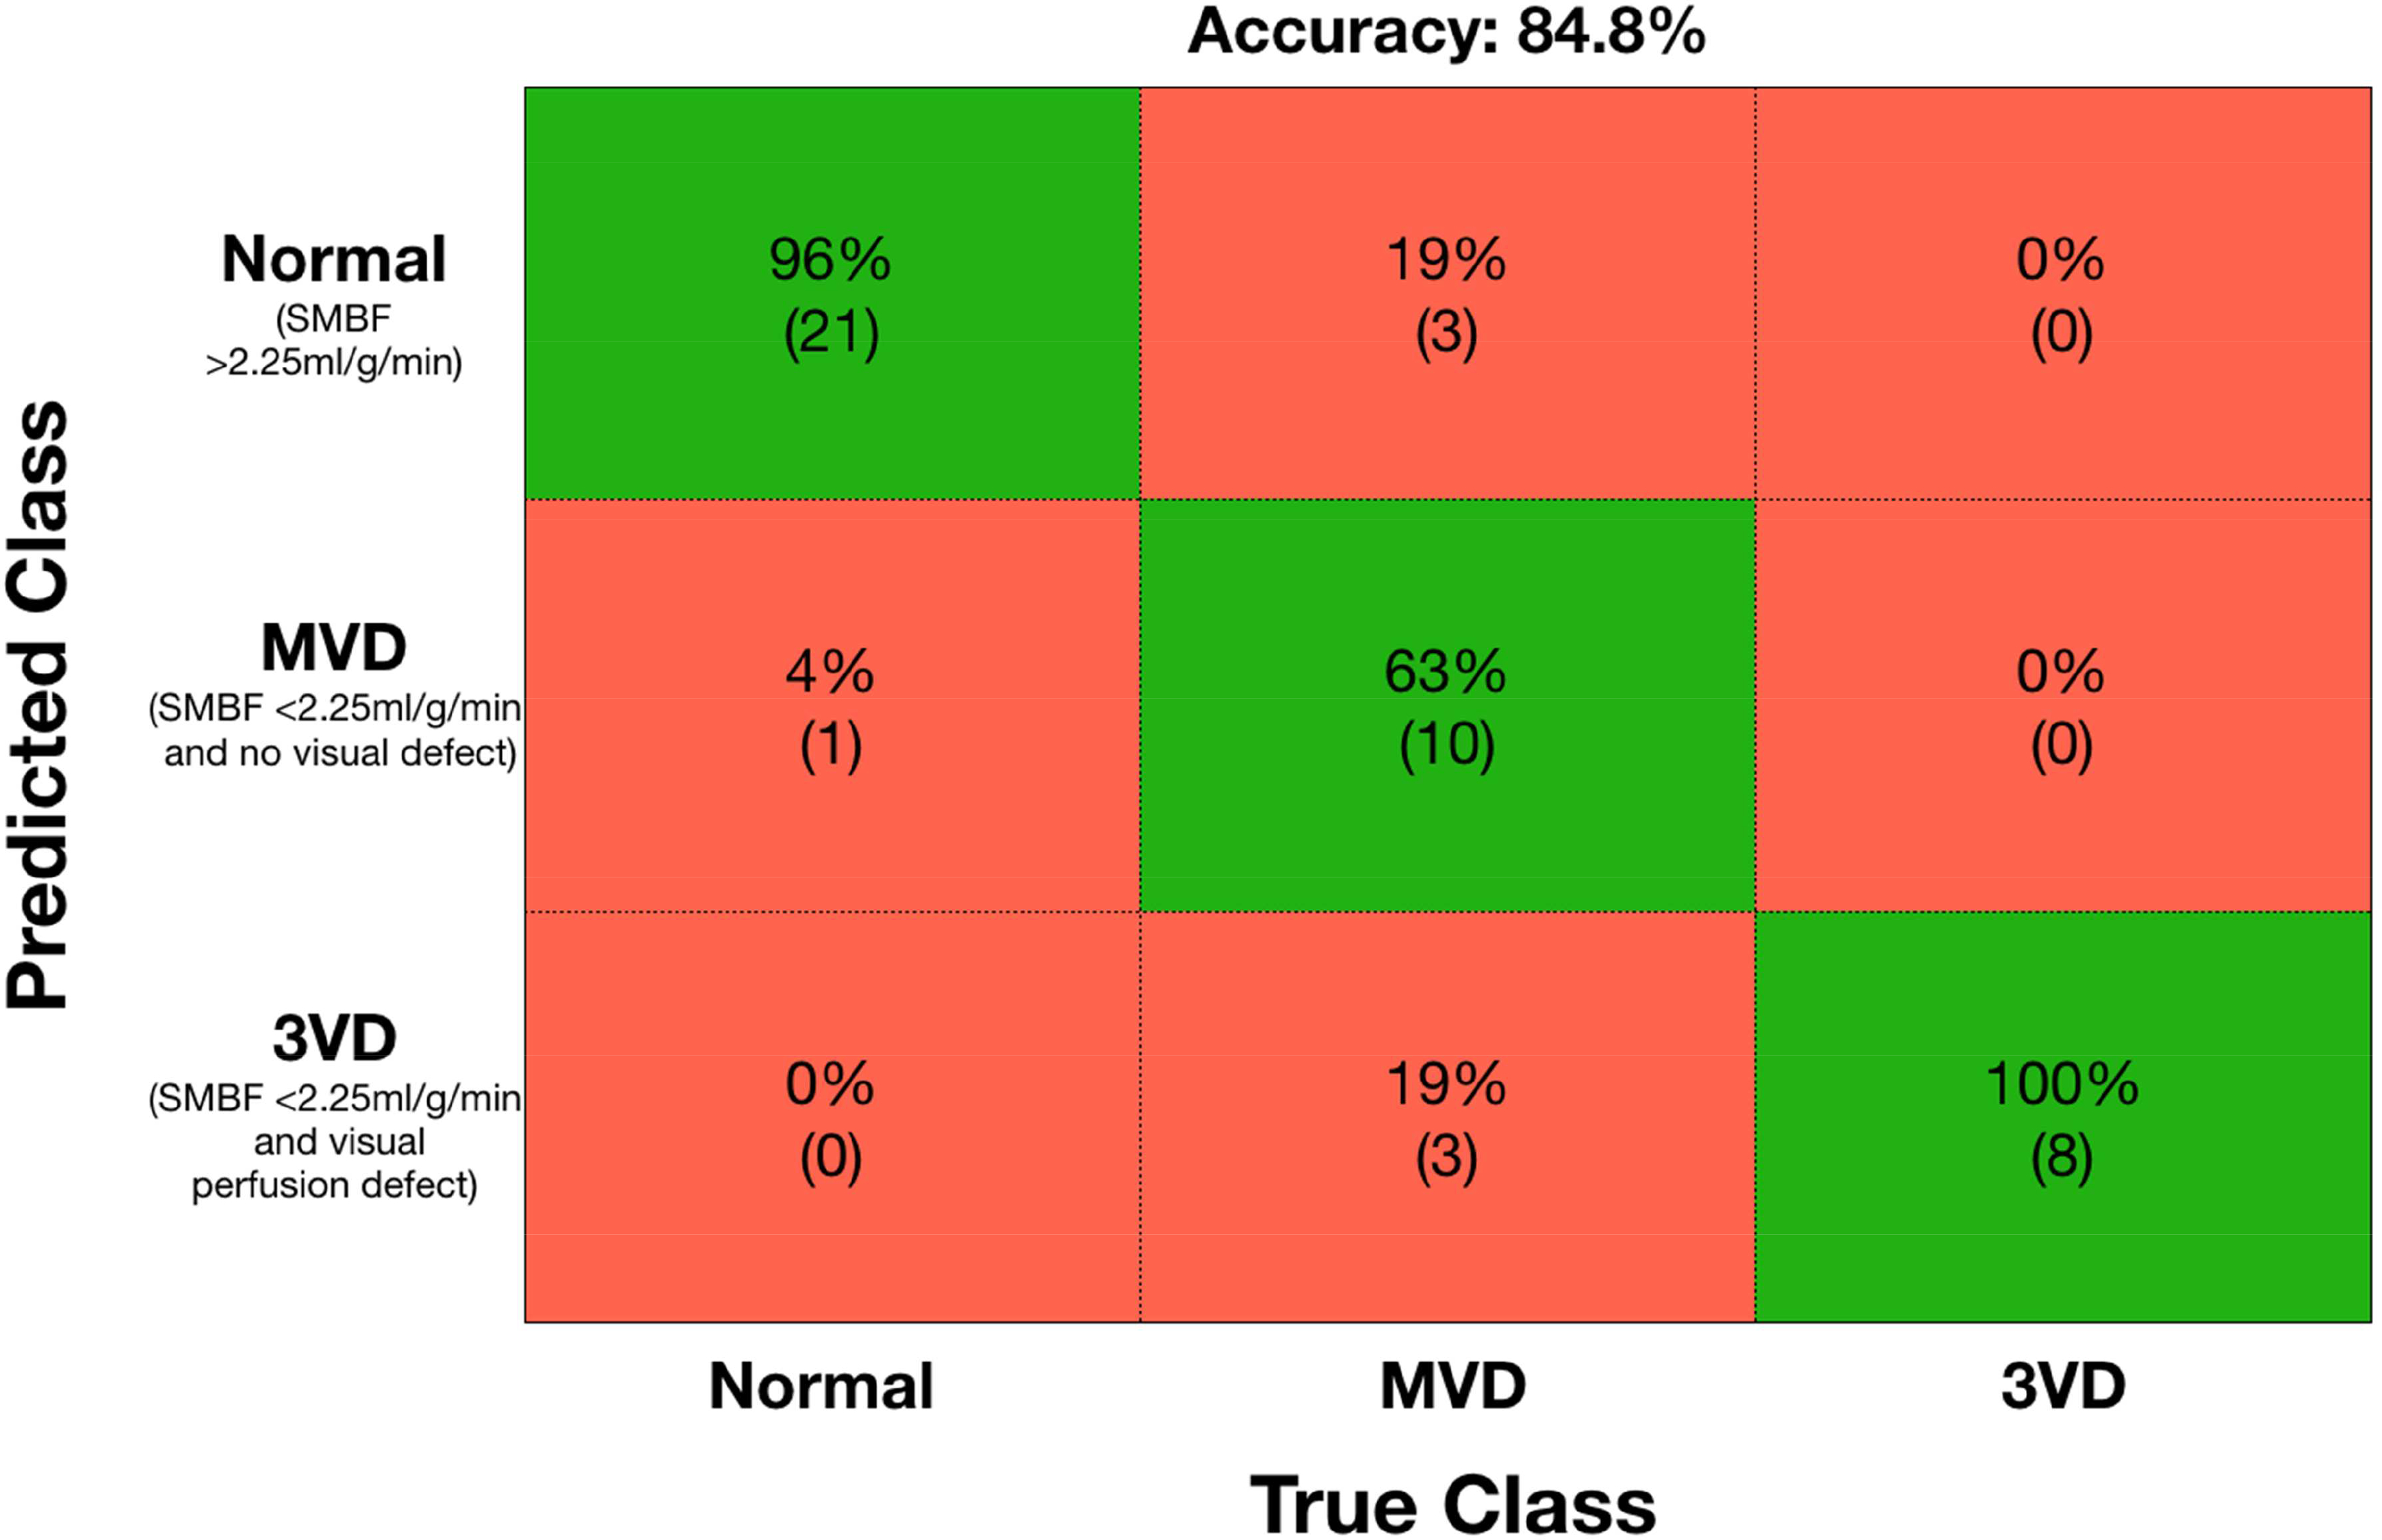
Confusion matrix for detection of normal coronary physiology, microvascular dysfunction (MVD) and 3 vessel disease using global stress myocardial blood flow and visual analysis of first-pass perfusion.
Of the 25 patients with non-obstructive CAD (i.e. FFR>0.80 in all vessels), 5 had abnormal IMR in one vessel, 8 abnormal IMR in two vessels and 3 with abnormal IMR in three vessels. Global stress MBF was significantly higher in those with NCP (i.e. FFR>0.80 and IMR<25 in all three vessels) compared to those with at least one IMR positive territory. There was a trend towards lower global stress MBF with more IMR positive vessels (Global stress MBF: NCP 2.80±0.67ml/g/min, 1-vessel abnormal IMR 2.06±0.36ml/g/min, 2-vessel abnormal IMR 2.13±0.23ml/g/min, 3-vessel abnormal IMR 1.77±0.27ml/g/min, p<0.01 between groups and p<0.05 between NCP and 1-vessel and NCP and 3-vessel, Supplementary Figure 5)
DISCUSSION
The present study shows that this novel automated in-line myocardial perfusion mapping technique can be used to detect epicardial CAD defined by FFR≤0.80, MVD defined by IMR≥25, and can differentiate MVD from three-vessel disease with good accuracy. Performance of this method for detection of physiologically significant CAD is comparable to previously published quantitative methods(16–18) and a recent meta-analysis of quantitative stress perfusion CMR studies (which showed per-territory sensitivity 82%, specificity 83% and AUC 0.84 for the detection of obstructive CAD)(19) with the added advantage of being able to detect coronary MVD and providing perfusion maps in-line on the scanner ready for quantitative analysis of MBF. The only other study to assess pixel-wise quantitative myocardial perfusion mapping reported per-vessel sensitivity of 75–83% and specificity of 72–81% to detect obstructive CAD(20) using quantitative coronary angiography (QCA) as the reference standard rather than FFR.
We propose a potential diagnostic algorithm for the integration of automated in-line myocardial perfusion mapping into the clinical CMR workflow (Figure 8). This could provide a simple non-invasive approach for evaluating epicardial CAD and MVD in patients with angina and also to differentiate three-vessel disease from MVD. These results will need further validation in a larger multicentre study.
Figure 8: Proposed diagnostic algorithm for detection of obstructive epicardial disease and coronary microvascular dysfunction using CMR myocardial perfusion mapping.
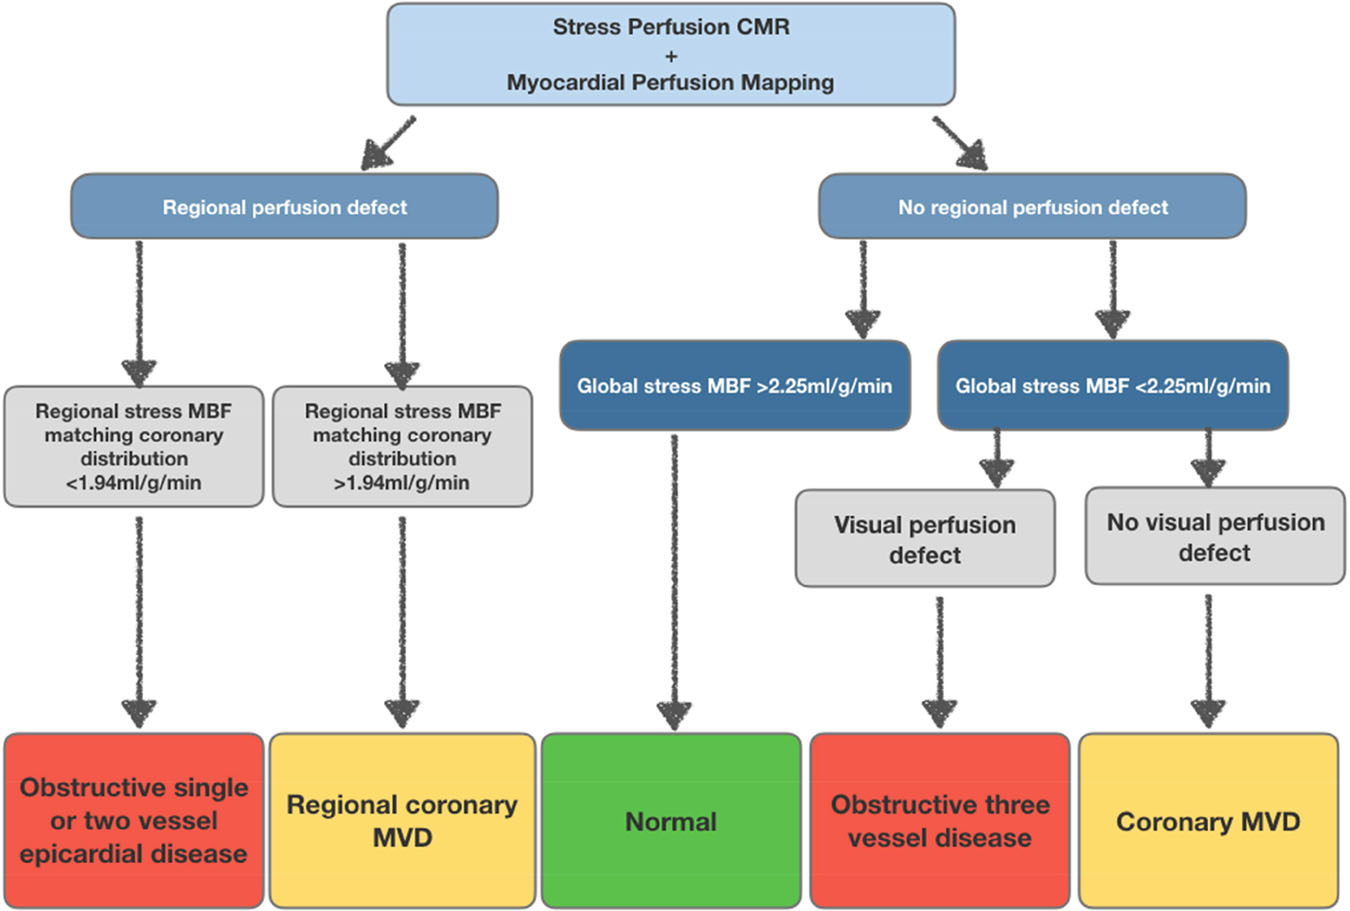
Pathway for the detection of obstructive CAD and MVD based on regional and global stress MBF. Patients with a regional perfusion defect and regional stress MBF ≤1.94ml/g/min are likely to have obstructive one or two-vessel disease. Global stress MBF ≤2.25ml/g/min with visual perfusion defects is likely to be obstructive 3-vessel disease and global stress MBF <2.25ml/g/min without visual defects is likely to be MVD.
Detection of obstructive CAD
Myocardial regions with obstructive CAD (FFR≤0.80) had mean stress MBF 1.47ml/g/min and MPR 1.75. This is comparable to previous studies of quantitative perfusion CMR that report stress MBF values of 1.4–2.32ml/g/min and MPR 1.20–1.82 in regions subtended by arteries with obstructive CAD(16,17,21,22).
Our results show lower specificity compared to previous studies using manually derived quantitative stress perfusion CMR for detection of functionally significant epicardial disease(17,18). This may be in part due to the high prevalence of MVD in our population. Within our cohort, 38% of vessels without obstructive disease had abnormal IMR and 70% of patients with non-obstructive CAD had at least one vessel with evidence of MVD, higher than previously reported(23,24). MVD may explain in part the poor correlation between stress MBF and FFR within FFR negative vessels, and the improvement in diagnostic accuracy of stress MBF and MPR for the detection of FFR positive vessels once areas with abnormal IMR are removed. Given the linear relationship between stress MBF and FFR in areas with obstructive disease (FFR≤0.80), myocardial perfusion maps could also give an indication of severity of disease and may be useful to risk-stratify patients, although future studies are required to confirm this hypothesis.
Detection of coronary MVD
In vessels with FFR>0.80, stress MBF and MPR were reduced in MVD areas. The only previous quantitative CMR study to investigate detection of MVD using IMR as the reference standard showed stress MBF values comparable to obstructive CAD (1.5ml/g/min MVD and 1.4ml/g/min obstructive disease)(21). Our data suggest that obstructive disease causes a greater reduction in stress MBF than MVD, which results in intermediate reduction. This is consistent with previous PET data(25). Mean global stress MBF (2.03ml/g/min) of MVD patients in this study is comparable with PET studies of patients with clinical features of MVD (2.15ml/g/min(26) and 2.52ml/g/min(27)).
Differentiation of epicardial disease from coronary MVD and normal
The accurate detection of severe three-vessel disease is critical to enable correct patient management but has been a limitation of myocardial perfusion techniques in the past due to underestimation of ischemic burden. The proposed approach to CMR stress perfusion quantification overcomes this limitation and rapidly provides images in-line to the scanner that are easy to interpret both visually and fully quantitatively. An additional clinical challenge when there is global reduction in the stress MBF and MPR is the differentiation between three-vessel disease and coronary MVD. Our data show that functionally significant epicardial disease displays a greater reduction in both stress MBF compared to areas with MVD and is able to differentiate three-vessel epicardial disease from MVD and normal with excellent diagnostic accuracy.
Potential clinical implications of inline myocardial perfusion mapping
Obstructive CAD affecting one or two vessels leads to regional perfusion defects that can be diagnosed visually by CMR with acceptable diagnostic accuracy. Therefore, techniques using quantitative perfusion (previously needing time-consuming post-processing and dedicated software) have never entered the routine clinical workflow. However, there remain clinical diagnostic challenges that need to be addressed. Firstly, it has been demonstrated that qualitative visual analysis is not enough for the detection of significant multivessel epicardial disease(28), especially in patients with three-vessel disease where visual analysis may underestimate the extent of ischaemia. Whist this has traditionally been thought of as a problem associated with PET, it has also been shown that stress perfusion CMR only diagnoses perfusion defects in all three territories in up to two-thirds of patients with known obstructive three-vessel disease(29,30). Secondly, we still lack a simple, widely available diagnostic tool for detection of MVD. MVD does not usually result in visible regional or global perfusion defects, and in this setting quantitative perfusion becomes invaluable. Thirdly, once we are able to detect global reduction in stress MBF and MPR it is essential to have a diagnostic tool that is able to accurately differentiate three-vessel disease from MVD, as patient management is drastically different. Myocardial perfusion mapping offers clinicians a diagnostic tool that may be able to address these challenges, being able to detect epicardial CAD and MVD, as well as differentiate MVD from multi-vessel disease. As this technique enables measurement of MBF at a pixel level, fully automated detection algorithms could be developed and implemented in the future, enabling categorization of studies into MVD, three-vessel disease or normal physiology.
Study limitations
The cohort studied were at high risk of CAD and predominantly male. Accepting this, the diagnostic accuracy of CMR derived stress MBF and MPR is good but the performance of this technique in lower risk populations requires further investigation. The proposed diagnostic algorithm provides a framework for differentiating epicardial disease from MVD and normal. However, the sample size was small, there was no independent validation sample and no adjustments were made for MBF measurements within individuals. This algorithm therefore requires further validation in a larger cohort of patients to confirm the accuracy of the suggested cut-off values. In its current form, the technique is not yet fully automated as it requires the user to manually trace endo- and epicardial borders and to visually differentiate regional from global perfusion defects. Finally, due to the sample size, effects of confounders such as age, gender, smoking status and presence of diabetes were not investigated. The effect of these factors on MBF warrants further investigation.
Conclusion
This novel automated in-line myocardial perfusion mapping technique can be used to detect epicardial CAD, MVD and can be used to differentiate MVD from multi-vessel disease. We propose a CMR-based algorithm for diagnosis of epicardial disease and MVD that could be readily implemented into clinical workflow following further clinical validation.
Supplementary Material
CLINICAL PERSPECTIVES.
Competency in medical knowledge:
Stress myocardial blood flow ≤1.94ml/g/min measured using CMR perfusion mapping is able to detect physiologically significant epicardial coronary disease (defined by FFR≤0.80). In the absence of regional perfusion defects, global analysis of stress MBF is able to differentiate obstructive three-vessel disease, coronary microvascular dysfunction and normal.
Translational outlook:
Further research is required to fully validate a proposed CMR based diagnostic algorithm to detect obstructive coronary disease and coronary microvascular dysfunction using myocardial perfusion mapping.
Acknowledgments
Financial Support: This study was supported by the National Amyloidosis Centre, University College London and the National Institute for Health Research University College London Hospitals Biomedical Research Centre.
ABBREVIATIONS
- AUC
area under the curve
- CAD
coronary artery disease
- CI
confidence interval
- CMR
cardiovascular magnetic resonance
- FFR
fractional flow reserve
- IMR
index of microcirculatory resistance
- MBF
myocardial blood flow
- MPR
myocardial perfusion reserve
- MVD
microvascular dysfunction
- NCP
normal coronary physiology
- ROC
Receiver-operator characteristic
Footnotes
Publisher's Disclaimer: This is a PDF file of an unedited manuscript that has been accepted for publication. As a service to our customers we are providing this early version of the manuscript. The manuscript will undergo copyediting, typesetting, and review of the resulting proof before it is published in its final form. Please note that during the production process errors may be discovered which could affect the content, and all legal disclaimers that apply to the journal pertain.
REFERENCES
- 1.Patel MR, Peterson ED, Dai D et al. Low diagnostic yield of elective coronary angiography. N Engl J Med 2010;362:886–95. [DOI] [PMC free article] [PubMed] [Google Scholar]
- 2.Jespersen L, Hvelplund A, Abildstrøm SZ et al. Stable angina pectoris with no obstructive coronary artery disease is associated with increased risks of major adverse cardiovascular events. Eur Heart J 2012;33:734–44. [DOI] [PubMed] [Google Scholar]
- 3.Jespersen L, Abildstrom SZ, Hvelplund A et al. Burden of hospital admission and repeat angiography in angina pectoris patients with and without coronary artery disease: a registry-based cohort study. PLoS One 2014;9:e93170. [DOI] [PMC free article] [PubMed] [Google Scholar]
- 4.Meijboom WB, Van Mieghem CA, van Pelt N et al. Comprehensive assessment of coronary artery stenoses: computed tomography coronary angiography versus conventional coronary angiography and correlation with fractional flow reserve in patients with stable angina. J Am Coll Cardiol 2008;52:636–43. [DOI] [PubMed] [Google Scholar]
- 5.De Bruyne B, Pijls NH, Kalesan B et al. Fractional flow reserve-guided PCI versus medical therapy in stable coronary disease. N Engl J Med 2012;367:991–1001. [DOI] [PubMed] [Google Scholar]
- 6.de Bruyne B, Bartunek J, Sys SU, Pijls NH, Heyndrickx GR, Wijns W. Simultaneous coronary pressure and flow velocity measurements in humans. Feasibility, reproducibility, and hemodynamic dependence of coronary flow velocity reserve, hyperemic flow versus pressure slope index, and fractional flow reserve. Circulation 1996;94:1842–9. [DOI] [PubMed] [Google Scholar]
- 7.Fearon WF, Kobayashi Y. Invasive Assessment of the Coronary Microvasculature: The Index of Microcirculatory Resistance. Circ Cardiovasc Interv 2017;10. [DOI] [PubMed] [Google Scholar]
- 8.Lee JM, Layland J, Jung JH et al. Integrated physiologic assessment of ischemic heart disease in real-world practice using index of microcirculatory resistance and fractional flow reserve: insights from the International Index of Microcirculatory Resistance Registry. Circ Cardiovasc Interv 2015;8:e002857. [DOI] [PubMed] [Google Scholar]
- 9.Montalescot G, Sechtem U, Achenbach S et al. 2013 ESC guidelines on the management of stable coronary artery disease: the Task Force on the management of stable coronary artery disease of the European Society of Cardiology. Eur Heart J 2013;34:2949–3003. [DOI] [PubMed] [Google Scholar]
- 10.Schwitter J, Wacker CM, Wilke N et al. MR-IMPACT II: Magnetic Resonance Imaging for Myocardial Perfusion Assessment in Coronary artery disease Trial: perfusion-cardiac magnetic resonance vs. single-photon emission computed tomography for the detection of coronary artery disease: a comparative multicentre, multivendor trial. Eur Heart J 2013;34:775–81. [DOI] [PubMed] [Google Scholar]
- 11.Greenwood JP, Ripley DP, Berry C et al. Effect of Care Guided by Cardiovascular Magnetic Resonance, Myocardial Perfusion Scintigraphy, or NICE Guidelines on Subsequent Unnecessary Angiography Rates: The CE-MARC 2 Randomized Clinical Trial. JAMA 2016;316:1051–60. [DOI] [PubMed] [Google Scholar]
- 12.Kellman P, Hansen MS, Nielles-Vallespin S et al. Myocardial perfusion cardiovascular magnetic resonance: optimized dual sequence and reconstruction for quantification. J Cardiovasc Magn Reson 2017;19:43. [DOI] [PMC free article] [PubMed] [Google Scholar]
- 13.Brown LAE, Onciul SC, Broadbent DA et al. Fully automated, inline quantification of myocardial blood flow with cardiovascular magnetic resonance: repeatability of measurements in healthy subjects. J Cardiovasc Magn Reson 2018;20:48. [DOI] [PMC free article] [PubMed] [Google Scholar]
- 14.Engblom H, Xue H, Akil S et al. Fully quantitative cardiovascular magnetic resonance myocardial perfusion ready for clinical use: a comparison between cardiovascular magnetic resonance imaging and positron emission tomography. J Cardiovasc Magn Reson 2017;19:78. [DOI] [PMC free article] [PubMed] [Google Scholar]
- 15.Cerqueira MD, Weissman NJ, Dilsizian V et al. Standardized myocardial segmentation and nomenclature for tomographic imaging of the heart. A statement for healthcare professionals from the Cardiac Imaging Committee of the Council on Clinical Cardiology of the American Heart Association. Circulation 2002;105:539–42. [DOI] [PubMed] [Google Scholar]
- 16.Motwani M, Kidambi A, Sourbron S et al. Quantitative three-dimensional cardiovascular magnetic resonance myocardial perfusion imaging in systole and diastole. J Cardiovasc Magn Reson 2014;16:19. [DOI] [PMC free article] [PubMed] [Google Scholar]
- 17.Lockie T, Ishida M, Perera D, al e. High-resolution magnetic resonance myocardial perfusion imaging at 3.0-Tesla to detect hemodynamically significant coronary stenoses as determined by fractional flow reserve. Journal of the American College of Cardiology 2011;57:70–75. [DOI] [PubMed] [Google Scholar]
- 18.Chiribiri A, Hautvast G, Lockie T, al e. Assessment of coronary artery stenosis severity and location: Quantitative analysis of transmural perfusion gradients by high resolution MRI versus FFR. JACC: Cardiovascular Imaging 2013;6:600–609. [DOI] [PMC free article] [PubMed] [Google Scholar]
- 19.van Dijk R, van Assen M, Vliegenthart R, de Bock GH, van der Harst P, Oudkerk M. Diagnostic performance of semi-quantitative and quantitative stress CMR perfusion analysis: a meta-analysis. J Cardiovasc Magn Reson 2017;19:92. [DOI] [PMC free article] [PubMed] [Google Scholar]
- 20.Hsu LY, Jacobs M, Benovoy M et al. Diagnostic Performance of Fully Automated Pixel-Wise Quantitative Myocardial Perfusion Imaging by Cardiovascular Magnetic Resonance. JACC Cardiovasc Imaging 2018;11:697–707. [DOI] [PMC free article] [PubMed] [Google Scholar]
- 21.Liu A, Wijesurendra RS, Liu JM et al. Diagnosis of Microvascular Angina Using Cardiac Magnetic Resonance. J Am Coll Cardiol 2018;71:969–979. [DOI] [PMC free article] [PubMed] [Google Scholar] [Retracted]
- 22.Papanastasiou G, Williams MC, Dweck MR et al. Quantitative assessment of myocardial blood flow in coronary artery disease by cardiovascular magnetic resonance: comparison of Fermi and distributed parameter modeling against invasive methods. J Cardiovasc Magn Reson 2016;18:57. [DOI] [PMC free article] [PubMed] [Google Scholar]
- 23.Lee BK, Lim HS, Fearon WF et al. Invasive evaluation of patients with angina in the absence of obstructive coronary artery disease. Circulation 2015;131:1054–60. [DOI] [PMC free article] [PubMed] [Google Scholar]
- 24.Ong P, Athanasiadis A, Borgulya G et al. Clinical usefulness, angiographic characteristics, and safety evaluation of intracoronary acetylcholine provocation testing among 921 consecutive white patients with unobstructed coronary arteries. Circulation 2014;129:1723–30. [DOI] [PubMed] [Google Scholar]
- 25.Patel MB, Bui LP, Kirkeeide RL, Gould KL. Imaging Microvascular Dysfunction and Mechanisms for Female-Male Differences in CAD. JACC Cardiovasc Imaging 2016;9:465–82. [DOI] [PubMed] [Google Scholar]
- 26.Graf S, Khorsand A, Gwechenberger M et al. Typical chest pain and normal coronary angiogram: cardiac risk factor analysis versus PET for detection of microvascular disease. J Nucl Med 2007;48:175–81. [PubMed] [Google Scholar]
- 27.Camici PG, Gistri R, Lorenzoni R et al. Coronary reserve and exercise ECG in patients with chest pain and normal coronary angiograms. Circulation 1992;86:179–86. [DOI] [PubMed] [Google Scholar]
- 28.Patel AR, Antkowiak PF, Nandalur KR et al. Assessment of advanced coronary artery disease: advantages of quantitative cardiac magnetic resonance perfusion analysis. J Am Coll Cardiol 2010;56:561–9. [DOI] [PMC free article] [PubMed] [Google Scholar]
- 29.Chung SY, Lee KY, Chun EJ et al. Comparison of stress perfusion MRI and SPECT for detection of myocardial ischemia in patients with angiographically proven three-vessel coronary artery disease. AJR Am J Roentgenol 2010;195:356–62. [DOI] [PubMed] [Google Scholar]
- 30.Motwani M, Maredia N, Fairbairn TA, Kozerke S, Greenwood JP, Plein S. Assessment of ischaemic burden in angiographic three-vessel coronary artery disease with high-resolution myocardial perfusion cardiovascular magnetic resonance imaging. Eur Heart J Cardiovasc Imaging 2014;15:701–8. [DOI] [PMC free article] [PubMed] [Google Scholar]
Associated Data
This section collects any data citations, data availability statements, or supplementary materials included in this article.


