Abstract
Liver has a complex and unique energy metabolism and plays a major role in glucose homeostasis. Liver is the main control center for glycogenesis, glycogenolysis, glycolysis and gluconeogenesis which are essential to provide energy for other tissues. Liver meets its own energy need from various sources which is mainly glucose in the fed state and fatty acids in the fasting state. In this review article, we will mainly describe the glucose metabolism of the liver, effect of various factors on 18F-fluorodeoxyglucose (FDG) activity/uptake in the normal liver and 18F- FDG positron emission tomography (PET) uptake patterns in various malignant and benign liver pathologies. Brief information on metabolomics profiling analyses in liver disorders will also be provided.
Keywords: Liver, glucose metabolism, FDG PET, liver lesions
Introduction
Liver plays a major role in glucose homeostasis by controlling glycogenesis, glycogenolysis, glycolysis and gluconeogenesis which are essential to provide energy for other tissues. 18F-fluorodeoxyglucose (FDG) is a radiolabeled glucose analog which is commonly used in positron emission tomography/computed tomography (PET/CT) studies to detect metabolically activity tumor or inflammation in various systems, to demonstrate myocardial viability and to determine metabolic alterations in the brain in various neuro-psychological disorders. Various PET studies have assessed various parameters in normal liver and in liver pathologies. In this review article, we aimed to describe glucose metabolism of the liver, various parameters effecting the FDG uptake in the normal liver, and FDG PET uptake patterns in various benign and malignant liver lesions. We will also provide brief information on metabolomics profiling analyses and other PET tracers in liver disorders. As the purpose of this article is glucose metabolism and FDG PET imaging, radiological imaging patterns of liver diseases will not be discussed.
Liver and glucose metabolism
In the postprandial (fed) state, glucose is stored as glycogen (glycogenesis) and/or converted into fatty acids or amino acids in the liver. In fed state, pancreatic β cells secret insulin, intestines secret fibroblast growth factor 15/19 (FGF15/19) and both stimulate glycogen synthesis [1,2]. Insulin stimulates glycogen synthase and expression of glucokinase (GK, also termed hexokinase-4) in the liver. Glycogen synthase is a major enzyme that facilitates the elongation of glycogen chains [3]. Glucose enters hepatocytes via glucose transport protein-2 (GLUT2) which also mediates glucose release from the liver [1]. GK converts glucose to glucose 6-phosphate (G6P). G6P acts as a precursor for glycogen synthesis and is also metabolized via glycolysis and pentose phosphate pathway. G6P is an allosteric activator of glycogen synthase and allosteric inhibitor of glycogen phosphorylase, thus stimulating glycogen synthesis and inhibiting glycogenolysis [1,3]. Unlike the other hexokinase isotypes (HKs 1, 2 and 3), GK activity is not allosterically inhibited by G6P, thus enabling the liver to continuously utilize glucose.
In fasting state, the liver has a major role in generating glucose as a fuel for other tissues [3]. In the fasted state, insulin and FGF15/19 secretion is suppressed and glucagon secretion from pancreatic α cells is stimulated. Glucagon activates glycogen phosphorylase and inhibits glycogen synthase enzymes. As a result, glycogen is hydrolyzed to generate glucose (glycogenolysis) [3]. G6P is dephosphorylated by glucose-6-phosphatase (G6Pase) enzyme to release glucose into blood [1]. During short-term fasting, liver produces glucose mainly via glycogenolysis. During prolonged fasting, when the glycogen is depleted, liver synthesizes glucose through gluconeogenesis using lactate, pyruvate, glycerol, and amino acids. These gluconeogenic substrates are generated either in the liver or delivered to the liver from extrahepatic tissues (muscles and adipose tissues). Availability of gluconeogenic substrates and the expression and activation of gluconeogenic enzymes (e.g. G6Pase and cytoplasmic phosphoenolpyruvate carboxylase/PEPCK-C) determines the rate of gluconeogenesis [1,3]. Dephosphorylation of G6P is a rate-limiting step in both glycogenolysis and gluconeogenesis. Gluconeogenesis is also controlled/regulated by various transcription factors and co-regulators which stimulate the expression of PEPCK-C and G6Pase, metabolic states (low and high energy states, various molecular energy sensors), the circadian clock genes, endoplasmic reticulum (positive and negative regulation), growth hormone, glucocorticoids (counter-regulatory), cytokines, and several GI hormones [1,4,5]. Insulin suppresses gluconeogenesis.
Hepatocytes have various metabolic fuels for their own energy needs. Glycolysis is dominant in the fed state. In fasted state, hepatocytes uses fatty acid (β-oxidation) for energy supply [1]. Pyruvate generated through glycolysis is oxidized to generate ATP via tricarboxylic acid cycle. It is also used for oxidative phosphorylation and synthesis of fatty acids. G6P is also metabolized via the pentose phosphate pathway to generate NADPH.
Hepatic blood supply and microcirculation
Liver receives approximately 25% of cardiac output [6]. Liver has dual blood supply from hepatic artery and portal vein which drains the blood from the gastrointestinal tract, spleen, pancreas, and gallbladder. Portal vein provides the majority of hepatic blood supply which is approximately 75-80% as compared to 20-25% with hepatic artery. Hepatic oxygen requirement is provided mainly by hepatic artery but also portal vein. Terminal hepatic arterioles and terminal portal venules supply blood to the hepatic sinusoids which correspond to the capillary bed of the liver and represent the segment of the microcirculation where nutrients are supplied and metabolic products are removed [7]. Main sinusoids communicate with each other through shorter interconnecting sinusoids. Hepatic sinusoids have fenestrated discontinuous endothelium which allows mixture of blood from hepatic artery and portal vein [8]. At the center of the hepatic lobules, central venules are found which receive the blood mixed in the liver sinusoids and return it to hepatic veins (right, left and middle).
18F-fluorodeoxyglucose PET/CT imaging
Normal liver
18F-FDG is a widely used PET radiotracer to measure glucose metabolism in normal and abnormal tissues and to detect tumors, various other cardiac, neuropsychological and inflammatory diseases. Similar to glucose, 18F-FDG is transported through the cell membrane via GLUTs. There are various GLUTs (GLUT1-GLUT13). In liver, GLUT2 is the primary glucose transport protein. GLUT2’s affinity for glucose is lower than that of GLUT1, but it also transports other sugars [9]. GLUT1 is expressed in all cell types and also upregulated in many tumors. GLUT3 has the highest affinity for glucose and is the major form found in neurons. GLUT4 is the insulin-sensitive transporter which is mainly found in muscle and adipose tissue.
Inside the cells, 18F-FDG undergoes phosphorylation by HK enzyme to form FDG6P. There are four HK enzymes. HK-4 (GK) is found in the liver, HK-1 in all mammalian tissues, and HK-2 in various tissues particularly skeletal muscles. Further metabolism of FDG6P is limited and it is essentially trapped in the cells, except in hepatocytes. In hepatocytes, FDG6P is dephosphorylated by G6Pase enzyme back to FDG which then leaves the cells and returns to circulation. G6Pase enzyme is mainly found in the liver and kidneys [10,11].
On routine FDG PET images taken after 6 hour fasting, liver shows mild diffuse activity which is slightly higher than the activity of systemic blood pool and spleen (Figure 1A). Normal liver SUVmean ranges from 2.0-3.0 and SUVmax from 3.0-4.0, although SUVs are affected by various factors [12]. Figure 2 shows selected frame from dynamic FDG PET image of the liver and time-activity curves of normal liver and hepatocellular carcinoma (HCC) [13]. As seen in the Figure 2, in the first 60 s there is rapid increase in normal liver activity which is mainly due to arterial and portal perfusion. After 60 s there is slower but gradual increase in liver activity due to uptake in hepatocytes which reaches to peak and becomes stable after 4 min representing combination of uptake in the liver cells and activity in the liver blood pool. To understand the effect of liver blood pool activity on liver FDG activity, Liu et al. proposed a corrective method by placing ROIs over liver, hepatic artery and portal vein to measure standardized uptake value (SUV) [14]. Based on % total blood volume in the liver, and % contributions to total blood volume by hepatic artery and portal vein, they proposed a formula to calculate SUV in liver parenchyma. They found that SUV in liver parenchyma was significantly higher than liver SUV.
Figure 1.
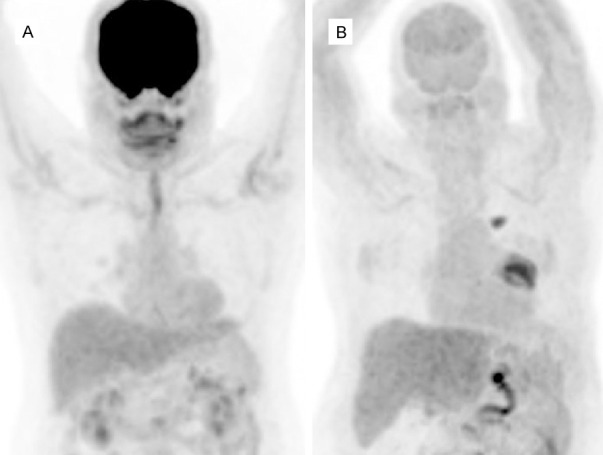
FDG PET MIP images in normoglycemic (6.2 mmol/dl) (A) and hyperglycemic (14 mmol/dl) (B) patients. Both visually and semiqantitatively, liver activity appears to be similar in both cases which is higher than blood pool and splenic activity. SUVmax/SULmax in normoglycemic and hyperglycemic patients were 3.9/2.3 and 4.3/2.2, respectively. Also note the markedly decreased uptake in the brain due to hyperglycemia with no significant effect of hyperglycemia on liver activity. There is also a hypermetabolic lung tumor in the left hilar region with a metastatic focus superior to it (B).
Figure 2.

Time activity curves of normal liver and tumor (HCC) from dynamic FDG PET images (image at 30-45 second). Tumor curves show faster influx and higher peaks than liver tissue (due to increased arterial perfusion), followed by slower drop, which reaches non-tumor levels after more than 3 min (green normal liver, red tumor). Reprinted with permission from from Society of Nuclear Medicine and Molecular Imaging [13].
Relatively low FDG activity in normal liver despite being a major site for glucose homeostasis is mainly due to dephosphorylation of FDG6P by G6Pase enzyme back to FDG which then leaves the hepatocytes and returns to circulation. In addition, fasting and fed state can effect FDG uptake in the normal liver. In fasting state, G6Pase is activated, whereas in fed state GK is activated. Routine FDG PET images are taken at approximately 6 hour fasting state. In hyperglycemic patients, either increased or unchanged liver FDG uptake/SUV was reported in various studies [15-23]. SUVs are also affected by various other factors particularly body weight (body mass index, BMI). Effect of blood glucose on liver SUV can be more accurately assessed by using lean body mass normalized SUV (SUL) instead of weight normalized SUVs [24,25]. Liver to blood pool SUV ratio can also be used. Authors suggesting increased liver FDG uptake or SUV with hyperglycemia have proposed that this might be due to the fact that the liver is the key organ responsible for glucose metabolism through gluconeogenesis and glycogen storage [15]. Figure shows liver activity in a hyperglycemic patient which appears to be similar to liver activity in a normoglycemic case (Figure 1B). In a small number of cases, low blood glucose (hypoglycemia) seemed to reduce liver SUV as compared to normal values [17].
The effect of insulin on hepatic FDG uptake was also investigated. Insulin and insulin sensitivity on hepatic glucose uptake were assessed using FDG PET, graphical analysis and 3-compartment modeling by Iozzo et al. [26]. Authors have suggested that physiologic hyperinsulinemia enhances hepatic glucose uptake and that insulin sensitivity is related to the glucose phosphorylation-to-dephosphorylation balance in the liver. Glucose influx rates were inversely correlated with fasting plasma free fatty acids in the same study. In a study by Roy et al. in hyperinsulinemic patients, liver FDG uptake was lower in patients with muscular uptake than those with no muscular uptake [27]. In the same study muscular uptake was not correlated with injected dose of insulin. Figure shows PET images of two patients who were injected insulin prior to FDG injection (Figure 3). To understand whether insulin resistance occurs simultaneously in all tissues or in specific tissues in diabetic patients, Honka et al. measured insulin-stimulated glucose uptake in insulin-sensitive tissues (skeletal muscle, adipose tissue and liver) in diabetic patients using FDG PET and euglycemic-hyperinsulinemic clamp [28]. They suggested that insulin resistance measured by glucose uptake is partially similar in all insulin-sensitive tissues, and is affected by obesity, age and gender.
Figure 3.
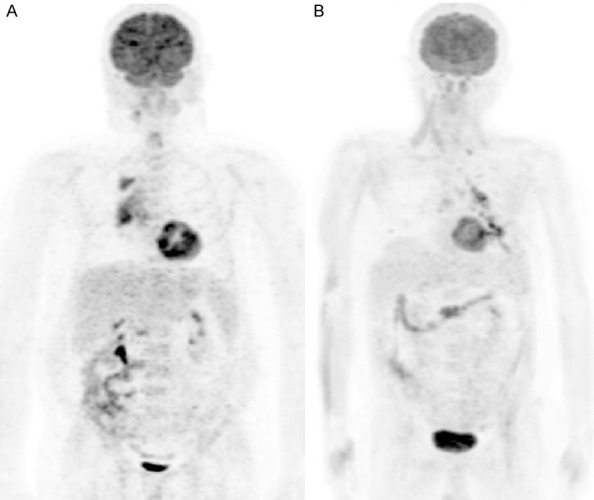
FDG PET MIP images in two patients who received insulin to reduce blood glucose prior to FDG injection. The first patient received 4 IU insulin because blood glucose was 225 mg/dl (A). Blood glucose reduced to 158 mg/dl. SUVmax/SUVmean and SULmax/SULmean of the liver were 3.6/1.5 and 2.1/0.9, respectively. The second patient received 5 IU insulin because blood glucose was 235 mg/dl (B). The blood glucose reduced to 178 mg/dl. Liver SUVmax/SUVmean and SULmax/SULmean were 1.9/1.2 and 1.4/0.9, respectively. In the 2nd patient there is muscular uptake. Liver activity (visually and SUV) is lower than normal in both patients. The higher difference between SUVmax and SUVmean in the first case as compared to second case may be artefactual. Uptakes in chest lesions are seen in both patients.
Liver SUV is used as a reference to better assess res-ponse to treatments in patients with various tumors. SUVmean or SUVmax of the liver is used although SUVmean is more accurate due to a slight heterogeneity in FDG distribution in normal liver with commonly seen mottled appearance (tiny hot spots) which could be artefactual or due to difference in FDG activity in hepatocytes and blood pool. SUVs are overestimated in overweight and obese patients and underestimated in cachectic patients as compared to patients with normal BMI [24,25]. Because of variations in SUVs, tumor to reference ratios (tumor/liver or tumor/blood pool ratios) or SUL are used to better assess response to treatments in oncologic cases. As reference, SUVs should be measured from the normal parts of the liver. In cases with diffuse involvement of the liver with various diseases such as metastases or hepatitis, liver should not be used as normal reference.
Studies have also investigated the effect of various other parameters on liver SUV. Age had a significant and positive impact on SUV of the liver in a study, however, another study reported little to no correlation between age and gender on liver SUV [29,30]. Liver SULmean had excellent inter-reader agreement in measurements at the upper, lower, or portal vein levels of the right lobe of the liver [31]. In another study, the area inferior to the portal vein level was reported to be the most reliable location for SUV measurements on PET/MR studies [32]. Time dependent reduction in SULmean was reported in liver with 7-8% reduction at 2 hr and 15-21% reduction at 4 hr as compared to one hour after FDG injection [33].
Summary
Despite being a major site for glucose metabolism, liver shows mild diffuse FDG uptake/activity which is mainly due to presence of G6pase enzyme in the hepatocytes. FDG uptake in the liver appears to be not significantly affected or slightly affected by blood glucose. Effect of insulin on FDG uptake in the liver needs to be further evaluated. Normal liver is used as a reference region to assess response to treatment in various tumors (tumor to liver SUV ratio) as tumor SUVs are affected by various factors, mainly by BMI.
FDG PET uptake patterns in malignant and benign liver lesions
Hepatocellular cancer
Hepatocellular cancer (HCC) is the most common primary malignant liver tumor which arises from the hepatocytes. In addition to conventional HCC, there are various other subtypes of HCC such as steatohepatitic, clear cell, fibrolamellar, scirrhous, sarcomatoid, lymphoepithelioma-like, granulocyte-colony-stimulating factor producing, and macrotrabecular massive carcinomas [34]. Based on degree of differentiation (histological grades), HCCs are generally classified as grade 1, 2, 3, 4 or well-differentiated, moderately differentiated, poorly differentiated or undifferentiated [35,36]. Microscopically well- and moderately differentiated HCC resemble normal hepatocytes.
In well- and moderately differentiated HCC, FDG uptake is usually low or similar to metabolic activity of the normal liver (isometabolic) and therefore they may not be identified on routine images taken 1 hour after FDG injection (Figure 4). Early dynamic FDG PET images can demonstrate the arterial hyperperfusion in HCC and increase its detectability (Figure 2) [13,37]. Delayed or dual-time point imaging (early at 1 hr and delayed at 2 or 3 hours) can help detecting well- and moderately differentiated HCCs [38,39]. With delayed imaging SUV of the lesions will increase whereas SUV of the normal liver will decrease (increases in target to background ratio). Multiple time-point imaging (early dynamic, 1 hr standard and delayed) will further increase the detectability and number of the lesions. FDG uptake is usually high in poorly differentiated HCC [40,41]. In 28 patients with HCC, range of SUV was 1.9-6.1 in well-differentiated HCC, 2.6-10.3 in moderately differentiated HCC and 3.6-16.3 in poorly differentiated HCC [42]. In the same study, GLUT-2 and HK-2 expressions were high in all HCCs with no correlation with tumor differentiation and SUV. GLUT-1 expression was very low in all HCCs but was significantly higher in poorly differentiated HCC and positively correlated with SUV. G-6-Pase activity was not correlated with tumor differentiation and SUV. In in-vitro analysis of the same study, low FDG uptake was correlated with high expression of P-glycoprotein [42]. In a study by Izuishi et al. in 20 patients with HCC, low FDG uptake in moderately differentiated HCC was result of low GLUT1 and high G6Pase expression, whereas high FDG uptake in poorly-differentiated HCC could be result of increased GLUT1 and decreased G6Pase expression [40]. The SUV correlated with proliferating cell nuclear antigen. In FDG PET dynamic imaging, the k3 and SUV of high-grade HCCs were significantly higher as compared to low-grade HCCs [41]. The G6Pase/HK ratios were significantly lower and HK activities were significantly greater in the high-grade as compared to low-grade HCCs. In a study assessing HK1-3 subtypes, HK2 was positive in all 7 cases with HCC (grade 2-3, grade 3 and intermediate phenotype), whereas GLUT1 was negative in all HCC cases except the case with intermediate phenotype [43]. Chen et al. suggested that higher SUV in patients with poorly differentiated HCC as compared to well- or moderately differentiated HCC could be due to lower fructose 1,6-bisphosphatase 1 expression in the former [44]. Glypican-3 (GPC3) expression in HCC was inversely associated with glucose metabolism [45]. GPC3 is a protein which is highly expressed in HCC and plays an important role in regulating malignant transformation and growth of tumor.
Figure 4.
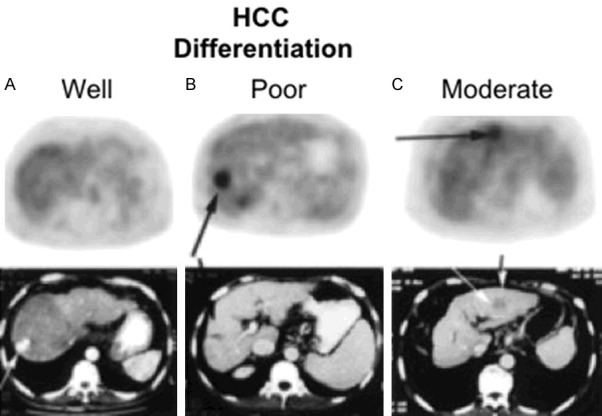
FDG PET/CT images of patients with HCC (selected transaxial PET and CT). Well-differentiated HCC with no increased FDG uptake (A). Poorly differentiated HCC with focally increased FDG uptake (B). Moderately differentiated HCC with mild to moderately increased FDG uptake (C). Reprinted with permission from Society of Nuclear Medicine and Molecular Imaging (46).
Various FDG uptake patterns can be seen in FDG avid HCC, such as focal uptake, multifocal uptake, an area of heterogeneous uptake or a peripheral rim activity surrounding a cold center (large rapidly growing tumor with central necrosis) [41,46-48]. Multifocal uptake can be due to primary multicentric tumor or intrahepatic metastases of primary HCC. Uptake along the intrahepatic branches of portal vein due to invasion by HCC was also reported [49]. Diffuse infiltrative HCC can be seen as a large area of heterogeneous uptake. Figure 4 shows FDG PET images of primary HCCs with various differentiations.
FDG PET was reported to have a higher sensitivity in detecting extrahepatic metastasis of HCC than detecting primary HCC [50,51]. Detection of metastatic HCC lesions by FDG PET is dependent on the grade, differentiation and stage of the tumor [50]. Most extrahepatic HCC occurs in patients with advanced intrahepatic tumor stage (stage IVA) [52]. Cellular behavior of metastases or recurrences may show differences as compared to primary tumor (Figure 5). The other PET tracers, such as 11C-acetate and radiolabeled choline have higher sensitivity in detecting well-and moderately-differentiated primary HCC as compared FDG PET [46,53].
Figure 5.
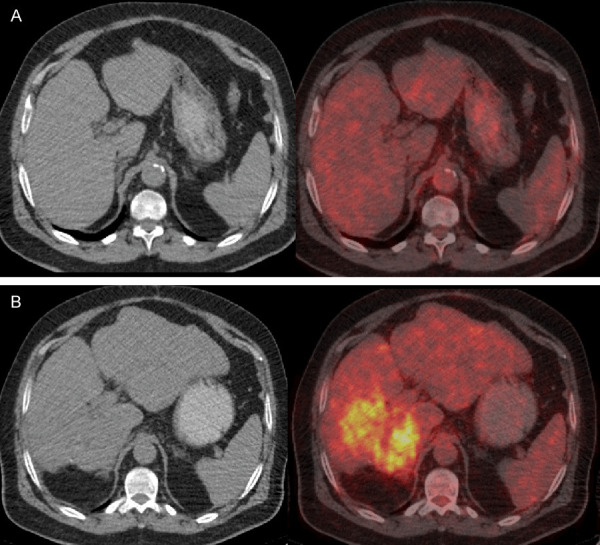
FDG PET images of a patient with HCC. Initial study (top, A) shows homogenous density and isometabolic activity in the liver lesion seen on MR (not shown here). Biopsy showed well-differentiated HCC. Four years later after treatment, PET/CT showed heterogeneous density and increased metabolic activity due to recurrent tumor (tumor SUVmax: 8.9, liver SUVmean: 2.5) in the right hepatic lobe (B). PET findings indicate progression of tumor from well-differentiation to poor differentiation.
Cholangiocarcinoma
Cholangiocarcinoma (CC) is the second most common primary hepatic malignancy. CCs can arise from intrahepatic, hilar or extrahepatic biliary tract. In 26 patients with CC, GLUT1 was positive in 81%, GLUT2 in 54%, and HK2 in 77% of the cases [54]. A significant association between the expression of GLUT1 and HK2 with FDG uptake was reported in moderately and poorly differentiated CC as compared to well-differentiated CC [54]. In another study, HK2 was negative in 6 of 7 cases with moderately or poorly differentiated CC, whereas GLUT1 positive in all 7 cases [43]. FDG uptake was reported to be higher in peripheral nodular and mass forming than infiltrating, primary hilar or extrahepatic CC [55,56]. CC with high mucin content and periductal sclerosis was generally not FDG avid [57]. Most peripheral CCs show ring-shaped FDG uptake due to excessive desmoplastic response within the tumor and neovascularity [58]. CCs can also be seen as an area of heterogeneously increased uptake, focally increased uptake or a linear area of increased uptake (intraductal, periductal or peribiliary) [57-59]. Figure shows FDG PET/CT images of a case with mass forming CC (Figure 6).
Figure 6.
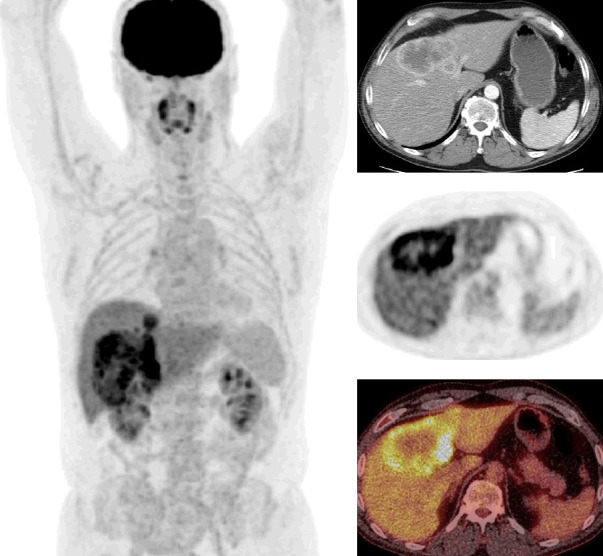
FDG PET/CT images of a case with mass forming cholangiocarcinoma (whole body MIP, selected transaxial contrast enhanced CT, PET, and PET/CT fusion images of the liver). CT shows peripheral enhancement and PET shows central photopenia with peripheral hypermetabolic activity in a large liver mass (tumor SUVmax: 13.5, liver SUVmean: 2.8). An additional small focus of tumor is also seen superior to the primary tumor on whole body MIP image.
Other primary malignant tumors of the liver
Liver sarcomas are very rare. Sarcomas are overall highly FDG avid tumors. Increased FDG uptake was reported in hepatic angiosarcoma [60]. Diffusely increased FDG uptake in the liver was reported in a case with hepatic angiosarcoma causing veno-occlusive disease [61]. Figure shows FDG PET images of a case with primary hepatic sarcoma (Figure 7).
Figure 7.
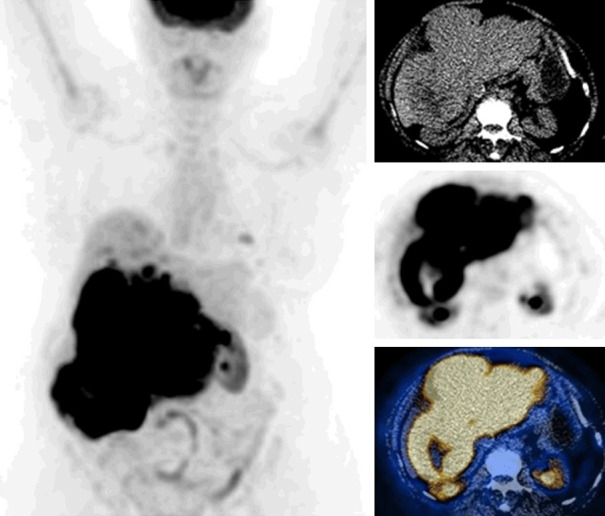
FDG PET/CT images of a case with primary liver sarcoma (whole body MIP, selected transaxial CT, PET, PET/CT fusion images of the liver). CT shows a large hepatic mass with heterogeneous density. PET shows marked hypermetabolic activity in the tumor (SUVmax: 27.5) and additional smaller foci in the liver parenchyma. Foci of mild uptake in the left lung are also seen, suspicious for metastases.
Primary (extra-nodal) hepatic lymphoma is very rare. Lymphomatous involvement of liver is usually secondary. On PET scan, FDG uptake patterns of primary lymphoma could be seen as a mass with heterogeneous uptake, multifocal uptake or diffusely increased uptake (infiltrating primary liver lymphoma) [62,63]. In secondary lymphoma, diffusely increased uptake (diffuse infiltrative) or multifocal uptake are common findings. Figure shows involvement of liver by diffuse large B-cell lymphoma (Figure 8).
Figure 8.
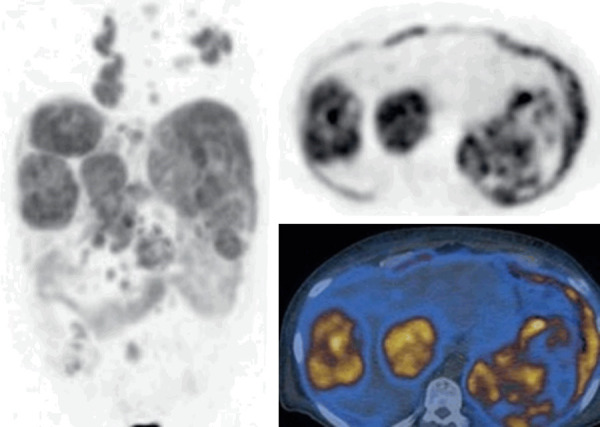
FDG PET/CT images of a case with lymphomatous involvement of the liver due to diffuse large B cell lymphoma (body MIP, selected transaxial PET and PET/CT fusion images of the liver). Large hypermetabolic masses in the liver (SUVmax: 19) with diffuse involvement of the spleen and multiple hypermetabolic lymph nodes in the chest and abdomen.
Liver metastases
Liver metastases are more common than the primary liver tumors. Liver metastases are mostly due to colorectal cancer, and various other cancers such as breast, lung, gastric, pancreatic, and neuroendocrine cancers. Overall, GLUT1 and HK2 expression is high in various malignancies including colorectal cancer. Liver metastases are usually seen as focal or multifocal hypermetabolic activity on FDG PET. Large and rapidly growing metastases of the liver usually have a central necrosis (coagulation necrosis due to tumor hypoxia) and these tumors are seen as a rim activity surrounding a central cold area on PET images. Necrosis can also be seen after treatments (chemotherapy, immunotherapy, percutaneous ablation, conformal radiotherapies, 90Y microspheres and other embolizations). In complete response to treatments, cold areas are seen corresponding to area of necrosis. Mild rim activity surrounding a cold center after treatments could be due to residual tumor (partial response), inflammation [64,65]. Focal uptake adjacent to treated cold area raises suspicion for recurrent tumor [64]. Liver metastases due to tumors with low FDG avidity such as colorectal mucinous cancer or well-differentiated neuroendocrine tumors usually show low metabolic activity. Somatostatin receptor imaging or 18F-DOPA PET has higher sensitivity than FDG PET in detecting well-differentiated neuroendocrine tumors and their metastases [66,67]. Due to normal liver activity and limited PET spatial resolution, subcentimetric metastatic lesions may not be detected on FDG PET [68]. Delayed imaging may increase the detectability of small and mildly hypermetabolic lesions. Metastatic lesions in the liver dome may be misregistered into lung base due to respiratory diaphragmatic motion and mimic lung base lesion [69]. Figures 9 and 10 show liver metastases from various cancers.
Figure 9.
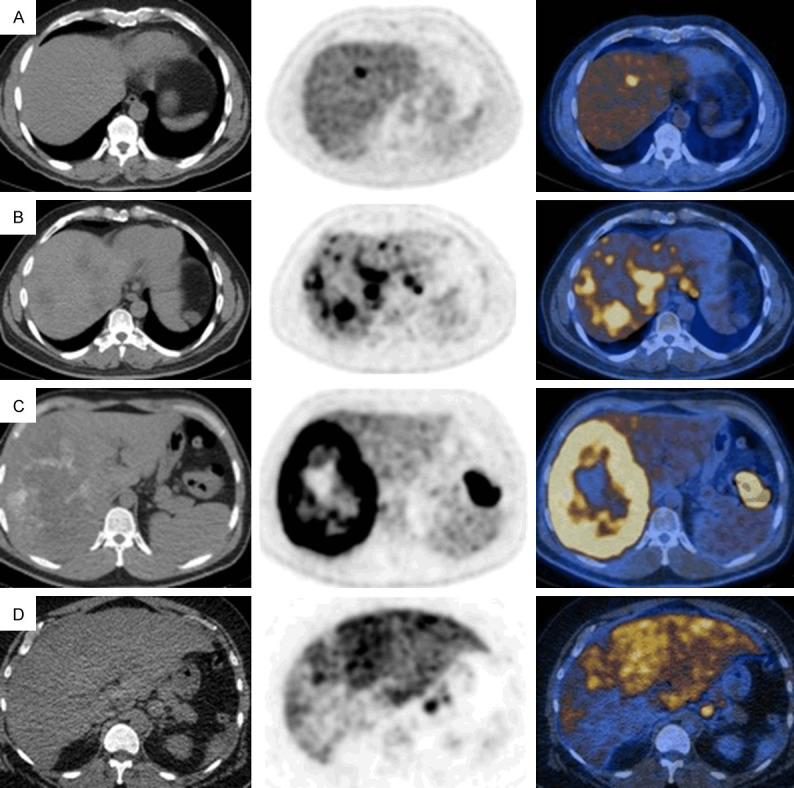
FDG PET/CT images of liver metastases from various tumors (selected transaxial CT, PET and PET/CT fusion images of the liver). Liver metastases from colorectal cancer (A-C): Focal increased uptake in the liver (SUVmax: 7.9) (A), multifocal uptake in both lobes of the liver (SUVmax 8.6) (B) and a large centrally photopenic, peripherally hypermetabolic mass occupying the right hepatic lobe (SUVmax: 19.1) (primary tumor is seen in the splenic flexure) (C). Diffusely and heterogeneously increased uptake in the liver in a case with liver metastasis from gastric cancer (SUVmax 19.2) (D). Focal uptake is seen in a part of gastric tumor at gastroesophageal junction.
Figure 10.
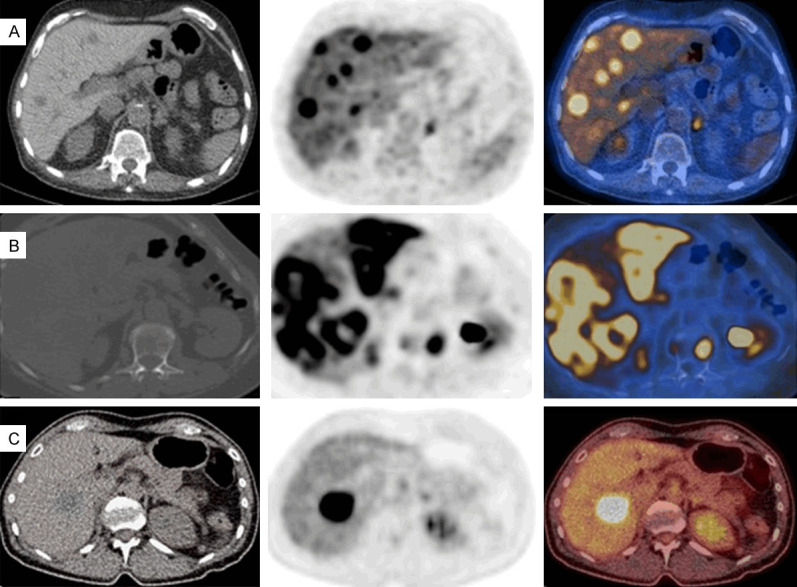
FDG PET/CT images of liver metastases from various tumors (body MIP images in anterior view and selected transaxial PET/CT fusion images of the liver). A. Poorly-differentiated neuroendocrine breast tumor in a male with multiple foci of metastases in the liver (SUVmax: 10.1). B. Invasive ductal breast carcinoma case with diffusely (heterogeneous) increased uptake in the liver (SUVmax: 16.2). C. Non-small cell lung cancer case with a large focal hypermetabolic liver metastasis (SUVmax 12.7).
Cavernous hemangioma
Cavernous hemangiomas are the most common benign tumors of the liver. Hemangiomas are hypervascular venous malformations lined by endothelial cells with a thin fibrous stroma. Their size may range from 1 cm to larger than 10 cm. In large/giant hemangiomas, a fibrous nodule or collagen scar, hemorrhage, thrombosis, extensive hyalinization, and necrosis may be seen [70]. FDG PET can show absence of uptake or mild heterogonous uptake depending on the histopathologic features of the hemangioma (Figure 11) [71-73].
Figure 11.
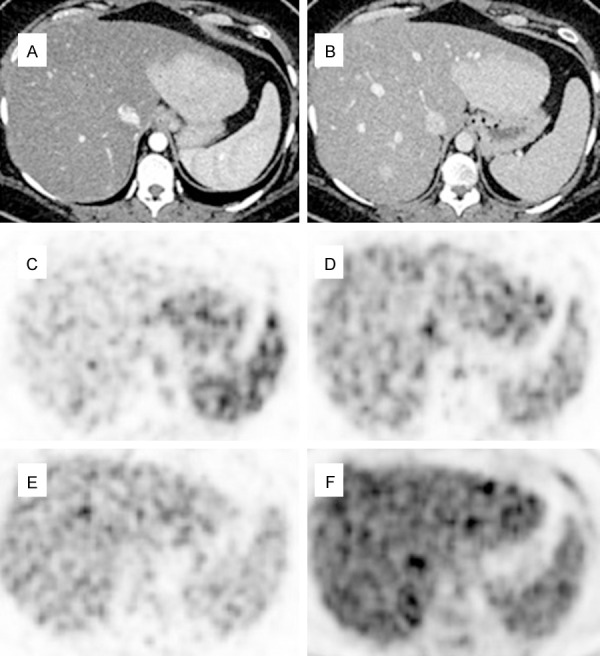
Dynamic FDG PET/CT images in a case with FNH (selected transaxial frames of the liver). Arterial (A) and venous phase (B) CT shows an enhancing mass in the left hepatic lobe. PET in arterial phase shows hyperperfusion in the mass (C). PET in venous phase (D) shows some washout, and PET in late venous phase (E) shows further washout of activity in the mass with only mild activity. Delayed PET at 90 min (F) shows isometabolic activity in the region of the mass as compared to normal liver.
Focal nodular hyperplasia
Focal nodular hyperplasia (FNH) is the second most common benign liver lesion. FNH consists of hyperplastic units of hepatocytes fixed together with dense fibrous tissue which also contains proliferating bile ducts and kupffer cells [74]. The most characteristic macroscopic finding in FNH is the central scar.
In FNH, FDG uptake is usually same or less than normal liver activity but hypermetabolic FNHs were also reported [75,76]. FDG avid FNH can be mistaken for metastasis or primary malignancy. Contrast enhanced dynamic FDG PET/CT images of a case with FNH are seen in the Figure 12.
Figure 12.

FDG PET/CT images in a case with giant hemangioma in the right lobe of the liver (selected transaxial CT, PET and PET/CT fusion images of the liver). CT shows calcification anteriorly, an area of lower attenuation posteriorly (scar, liquefaction or necrosis) and some contrast enhancement posterior to it. There is absent FDG uptake in the calcified and lower attenuation parts of the hemangioma and mild uptake in the rest of the hemangioma which is similar to normal liver activity.
Hepatic adenoma
Hepatic (hepatocellular) adenomas are benign liver tumors caused by benign proliferation of hepatocytes. There are four subtypes of hepatic adenomas [77]. Hepatic adenomas can be solitary or multiple with a risk to undergo malignant transformation to HCC.
Hepatic adenomas are usually known as non-FDG avid lesions. However, HNF1-α subtype of hepatic adenomas was reported to be FDG avid in 9 patients [78]. Focal and multifocal FDG uptake was reported in solitary and multiple adenomas (hepatic adenomatosis) [79,80]. FDG avid hepatic adenomas can mimic metastasis or primary malignant tumors.
Hepatic abscess
Hepatic abscess are usually caused by bacterial or parasitic infections. Common FDG PET finding in hepatic abscess is a peripheral rim shaped uptake with photopenic center [81,82]. Multifocal FDG uptake was reported in a case with multifocal fungal abscesses from candidiasis [83]. Hepatic heterogeneous uptake with multiple cold lesions with peripheral mild metabolism was reported in amoebic abscesses [84]. FDG uptake due to hepatic abscess can mimic malignancy and metastases.
Sarcoidosis
Sarcoidosis is a multisystem disease which can involve liver with epithelioid non-caseating granulomas in majority of the cases with liver involvement. Active granulomatous infections usually show high FDG uptake. Sarcoidosis related increased FDG uptake in the liver could be multifocal, diffuse or heterogeneous and may mimic metastases [85,86].
Hepatitis
Hepatitis is the inflammation of the liver which may be caused by various infectious or non-infectious conditions. In cases with hepatitis, diffusely or heterogeneously increased FDG uptake can be seen in the liver [87,88]. Degree of FDG uptake is correlated with the severity of the inflammation. Multifocal FDG uptake in the liver was reported in a case with granulomatous inflammation due to tuberculosis [89]. Figure 13 shows diffuse and markedly increased FDG uptake in the liver due to hepatitis as adverse effect of immune check point inhibitor treatment (autoimmune reaction).
Figure 13.
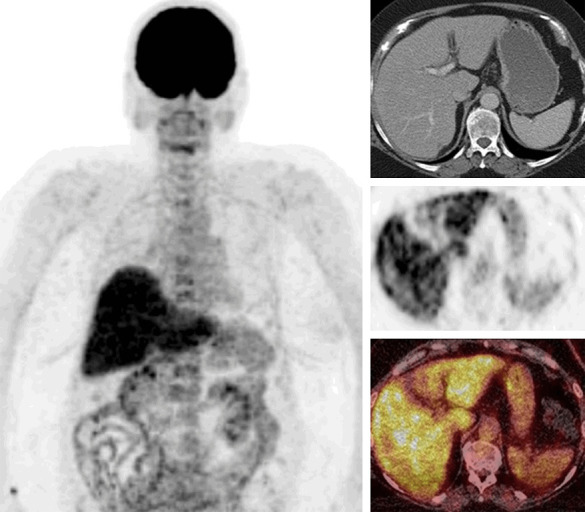
FDG PET/CT images of a case with hepatitis due to immune check point inhibitor treatment (whole body MIP, selected transaxial CT, PET, PET/CT fusion images of the liver). Diffusely and markedly increased FDG uptake in the liver with slight heterogeneity (SUVmax 9.1).
Fatty liver (hepatic steatosis)
Fatty liver is abnormal lipid deposition in hepatocytes. Fat accumulation in the liver could be diffuse, focal or diffuse with focal sparing. In fatty liver, increased or decreased FDG uptake can be seen [90-92]. Increased FDG uptake in fatty liver is likely due to presence of inflammation whereas decreased uptake is due to lack of inflammation and presence of fat only. Increased FDG uptake was in association with elevated serum γ-glutamyl transpeptidase and triglyceride in patients with non-alcoholic fatty liver disease [93]. Normal uptake in fat sparing areas in fatty liver may mimic lesions/metastases [94].
Summary of FDG PET in liver lesions
Overall FDG PET is useful for detecting poorly differentiated HCC and mass forming CC and their metastases and recurrences, liver metastases of FDG avid tumors such as colon, breast and lung carcinomas, and lymphomatous, granulomatous (sarcoidosis) and inflammatory involvement of the liver. FDG PET can help detecting malignant transformation of hepatocellular adenoma to HCC. Due to higher expression of G6pase enzyme in well- and moderately differentiated HCC, FDG PET has low sensitivity in detecting those tumors. FDG PET has low sensitivity in detecting liver metastases of low grade tumors or tumors with low FDG avidity. Physiological mild FDG activity in the liver limits the detection of sub-centimetric tumors and metastases. FDG uptake due to inflammatory or granulomatous lesions may mimic primary malignant or metastatic liver lesions.
Metabolomics
Metabolomics is defined as the comprehensive analysis of metabolites in a biological samples or systems. Metabolites include small molecules and products of various metabolisms. Metabolome is the complete set of metabolites. Mass spectrometry-based techniques are commonly used to measure metabolites noninvasively in relevant quantities (liquid chromatography/mass spectrometry, gas chromatography/mass spectrometry, fourier transform infrared spectroscopy, and nuclear magnetic resonance spectroscopy) [95].
Metabolomics reports show different metabolic patterns in various liver disorders. Various metabolites have been measured in liver diseases in serum and in liver. For glycolysis and tricarboxylic acid-cycle, measured metabolites were glucose, pyruvate, lactate, succinate, fumarate, and citrate. Increased lactate, and decreased glucose and glycogen were reported in HCC [96,97]. Low-grade HCC and high-grade HCC tumors showed differences. The level of lactate was higher but levels of glucose and glycogen were lower in high-grade HCC than in low-grade HCC tumors [96]. The serum metabolic profiling of cirrhotic patients showed decreased levels of glucose and lactate [98]. In metabolic analysis of liver tissue in chronic liver disease, decreased glucose and some unsaturated fatty acids were reported [99].
Conclusion
Liver plays a major role in glucose metabolism. In this review article we summarized the glucose metabolism in liver, various factors effecting FDG uptake in normal liver and FDG PET uptake patterns in various benign and malignant liver diseases.
Disclosure of conflict of interest
None.
References
- 1.Rui L. Energy metabolism in the liver. Compr Physiol. 2014;4:177–97. doi: 10.1002/cphy.c130024. [DOI] [PMC free article] [PubMed] [Google Scholar]
- 2.Kir S, Beddow SA, Samuel VT, Miller P, Previs SF, Suino-Powell K, Xu HE, Shulman GI, Kliewer SA, Mangelsdorf DJ. FGF19 as a postprandial, insulin-independent activator of hepatic protein and glycogen synthesis. Science. 2011;331:1621–4. doi: 10.1126/science.1198363. [DOI] [PMC free article] [PubMed] [Google Scholar]
- 3.Han HS, Kang G, Kim JS, Choi BH, Koo SH. Regulation of glucose metabolism from a liver-centric perspective. Exp Mol Med. 2016;48:e218. doi: 10.1038/emm.2015.122. [DOI] [PMC free article] [PubMed] [Google Scholar]
- 4.Rodgers JT, Lerin C, Haas W, Gygi SP, Spiegelman BM, Puigserver P. Nutrient control of glucose homeostasis through a complex of PGC-1alpha and SIRT1. Nature. 2005;434:113–8. doi: 10.1038/nature03354. [DOI] [PubMed] [Google Scholar]
- 5.Feng D, Liu T, Sun Z, Bugge A, Mullican SE, Alenghat T, Liu XS, Lazar MA. A circadian rhythm orchestrated by histone deacetylase 3 controls hepatic lipid metabolism. Science. 2011;331:1315–9. doi: 10.1126/science.1198125. [DOI] [PMC free article] [PubMed] [Google Scholar]
- 6.Eipel C, Abshagen K, Vollmar B. Regulation of hepatic blood flow: the hepatic arterial buffer response revisited. World J Gastroenterol. 2010;16:6046–57. doi: 10.3748/wjg.v16.i48.6046. [DOI] [PMC free article] [PubMed] [Google Scholar]
- 7.Oda M, Yokomori H, Han JY. Regulatory mechanisms of hepatic microcirculation. Clin Hemorheol Microcirc. 2003;29:167–82. [PubMed] [Google Scholar]
- 8.Braet F, Wisse E. Structural and functional aspects of liver sinusoidal endothelial cell fenestrae: a review. Comp Hepatol. 2002;1:1. doi: 10.1186/1476-5926-1-1. [DOI] [PMC free article] [PubMed] [Google Scholar]
- 9.Avril N. GLUT1 expression in tissue and 18F-FDG uptake. J Nucl Med. 2004;45:930–932. [PubMed] [Google Scholar]
- 10.van Schaftingen E, Gerin I. The glucose-6-phosphatase system. Biochem J. 2002;362:513–32. doi: 10.1042/0264-6021:3620513. [DOI] [PMC free article] [PubMed] [Google Scholar]
- 11.Hume R, Burchell A. The glucose-6-phosphatase enzyme in developing human trachea and oesophagus. Histochem J. 1996;28:141–7. doi: 10.1007/BF02331419. [DOI] [PubMed] [Google Scholar]
- 12.Boellaard R, Delgado-Bolton R, Oyen WJ, Giammarile F, Tatsch K, Eschner W, Verzijlbergen FJ, Barrington SF, Pike LC, Weber WA, Stroobants S, Delbeke D, Donohoe KJ, Holbrook S, Graham MM, Testanera G, Hoekstra OS, Zijlstra J, Visser E, Hoekstra CJ, Pruim J, Willemsen A, Arends B, Kotzerke J, Bockisch A, Beyer T, Chiti A, Krause BJ European Association of Nuclear Medicine (EANM). European Association of Nuclear Medicine (EANM) FDG PET/CT: EANM procedure guidelines for tumour imaging: version 2.0. Eur J Nucl Med Mol Imaging. 2015;42:328–54. doi: 10.1007/s00259-014-2961-x. [DOI] [PMC free article] [PubMed] [Google Scholar]
- 13.Schierz JH, Opfermann T, Steenbeck J, Lopatta E, Settmacher U, Stallmach A, Marlowe RJ, Freesmeyer M. Early dynamic 18F-FDG PET to detect hyperperfusion in hepatocellular carcinoma liver lesions. J Nucl Med. 2013;54:848–54. doi: 10.2967/jnumed.112.113936. [DOI] [PubMed] [Google Scholar]
- 14.Liu G, Hu Y, Zhao Y, Yu H, Hu P, Shi H. Variations of the liver standardized uptake value in relation to background blood metabolism: an 2-[18F]Fluoro-2-deoxy-D-glucose positron emission tomography/computed tomography study in a large population from China. Medicine (Baltimore) 2018;97:e0699. doi: 10.1097/MD.0000000000010699. [DOI] [PMC free article] [PubMed] [Google Scholar]
- 15.Kubota K, Watanabe H, Murata Y, Yukihiro M, Ito K, Morooka M, Minamimoto R, Hori A, Shibuya H. Effects of blood glucose level on FDG uptake by liver: a FDG-PET/CT study. Nucl Med Biol. 2011;38:347–51. doi: 10.1016/j.nucmedbio.2010.09.004. [DOI] [PubMed] [Google Scholar]
- 16.Malladi A, Viner M, Jackson T, Mercier G, Subramaniam RM. PET/CT mediastinal and liver FDG uptake: effects of biological and procedural factors. J Med Imaging Radiat Oncol. 2013;57:169–175. doi: 10.1111/1754-9485.12015. [DOI] [PubMed] [Google Scholar]
- 17.Sarikaya I, Sarikaya A, Sharma P. Assessing the effect of various blood glucose levels on 18F-FDG activity in the brain, liver, and blood pool. J Nucl Med Technol. 2019;47:313–318. doi: 10.2967/jnmt.119.226969. [DOI] [PubMed] [Google Scholar]
- 18.Sprinz C, Altmayer S, Zanon M, Watte G, Irion K, Marchiori E, Hochhegger B. Effects of blood glucose level on 18F-fluorodeoxyglucose (18F-FDG) uptake for PET/CT in normal organs: an analysis on 5623 patients. Sci Rep. 2018;8:2126. doi: 10.1038/s41598-018-20529-4. [DOI] [PMC free article] [PubMed] [Google Scholar]
- 19.Groheux D, Delord M, Rubello D, Colletti PM, Nguyen ML, Hindié E. Variation of liver SUV on 18FDG-PET/CT studies in women with breast cancer. Clin Nucl Med. 2013;38:422–425. doi: 10.1097/RLU.0b013e3182872f0e. [DOI] [PubMed] [Google Scholar]
- 20.Webb RL, Landau E, Klein D, DiPoce J, Volkin D, Belman J, Voutsinas N, Brenner A. Effects of varying serum glucose levels on 18F-FDG biodistribution. Nucl Med Commun. 2015;36:717–721. doi: 10.1097/MNM.0000000000000319. [DOI] [PubMed] [Google Scholar]
- 21.Mahmud MH, Nordin AJ, Ahmad Saad FF, Azman AZ. Impacts of biological and procedural factors on semiquantification uptake value of liver in fluorine-18 fluorodeoxyglucose positron emission tomography/computed tomography imaging. Quant Imaging Med Surg. 2015;5:700–707. doi: 10.3978/j.issn.2223-4292.2015.05.02. [DOI] [PMC free article] [PubMed] [Google Scholar]
- 22.Lindholm H, Brolin F, Jonsson C, Jacobsson H. The relation between the blood glucose level and the FDG uptake of tissues at normal PET examinations. EJNMMI Res. 2013;3:50. doi: 10.1186/2191-219X-3-50. [DOI] [PMC free article] [PubMed] [Google Scholar]
- 23.Rosica D, Cheng SC, Hudson M, Sakellis C, Van den Abbeele AD, Kim CK, Jacene HA. Effects of hyperglycemia on fluorine-18-fluorodeoxyglucose biodistribution in a large oncology clinical practice. Nucl Med Commun. 2018;39:417–422. doi: 10.1097/MNM.0000000000000829. [DOI] [PubMed] [Google Scholar]
- 24.Sarikaya I, Albatineh AN, Sarikaya A. Revisiting weight-normalized SUV and lean-body-mass-normalized SUV in PET studies. J Nucl Med Technol. 2020;48:163–167. doi: 10.2967/jnmt.119.233353. [DOI] [PubMed] [Google Scholar]
- 25.Zasadny KR, Wahl RL. Standardized uptake values of normal tissues at PET with 2-[fluorine 18]fluoro-2-deoxy-D-glucose: variations with body weight and a method for correction. Radiology. 1993;189:847–850. doi: 10.1148/radiology.189.3.8234714. [DOI] [PubMed] [Google Scholar]
- 26.Iozzo P, Geisler F, Oikonen V, Mäki M, Takala T, Solin O, Ferrannini E, Knuuti J, Nuutila P 18F-FDG PET Study. Insulin stimulates liver glucose uptake in humans: an 18F-FDG PET study. J Nucl Med. 2003;44:682–9. [PubMed] [Google Scholar]
- 27.Roy FN, Beaulieu S, Boucher L, Bourdeau I, Cohade C. Impact of intravenous insulin on 18F-FDG PET in diabetic cancer patients. J Nucl Med. 2009;50:178–83. doi: 10.2967/jnumed.108.056283. [DOI] [PubMed] [Google Scholar]
- 28.Honka MJ, Latva-Rasku A, Bucci M, Virtanen KA, Hannukainen JC, Kalliokoski KK, Nuutila P. Insulin-stimulated glucose uptake in skeletal muscle, adipose tissue and liver: a positron emission tomography study. Eur J Endocrinol. 2018;178:523–531. doi: 10.1530/EJE-17-0882. [DOI] [PMC free article] [PubMed] [Google Scholar]
- 29.Lin CY, Ding HJ, Lin CC, Chen CC, Sun SS, Kao CH. Impact of age on FDG uptake in the liver on PET scan. Clin Imaging. 2010;34:348–50. doi: 10.1016/j.clinimag.2009.11.003. [DOI] [PubMed] [Google Scholar]
- 30.Elyse G, Crystal B, Dana O, Medhat O. Liver SUV in whole body 18F FDG-PET/CT: stability and correlation with age and gender. J Nucl Med. 2010;51:2125. [Google Scholar]
- 31.Viner M, Mercier G, Hao F, Malladi A, Subramaniam RM. Liver SULmean at FDG PET/CT: interreader agreement and impact of placement of volume of interest. Radiology. 2013;267:596–601. doi: 10.1148/radiol.12121385. [DOI] [PubMed] [Google Scholar]
- 32.Domachevsky L, Bernstine H, Nidam M, Stein D, Goldberg N, Stern D, Goldberg N, Stern D, Abadi-Korek I, Groshar D. Hepatic 18F-FDG uptake measurements on PET/MR: impact of volume of interest location on repeatability. Contrast Media Mol Imaging. 2017;2017:8639731. doi: 10.1155/2017/8639731. [DOI] [PMC free article] [PubMed] [Google Scholar]
- 33.Chirindel A, Alluri KC, Tahari AK, Chaudhry M, Wahl RL, Lodge MA, Subramaniam RM. Liver standardized uptake value corrected for lean body mass at FDG PET/CT: effect of FDG uptake time. Clin Nucl Med. 2015;40:e17–22. doi: 10.1097/RLU.0000000000000446. [DOI] [PMC free article] [PubMed] [Google Scholar]
- 34.Martins-Filho SN, Alves V. The strengths and weaknesses of gross and histopathological evaluation in hepatocellular carcinoma: a brief review. Surg Exp Pathol. 2019;2:23. [Google Scholar]
- 35.Edmondson HA, Steiner PE. Primary carcinoma of the liver: a study of 100 cases among 48,900 necropsies. Cancer. 1954;7:462–503. doi: 10.1002/1097-0142(195405)7:3<462::aid-cncr2820070308>3.0.co;2-e. [DOI] [PubMed] [Google Scholar]
- 36.World Health Organization. Classification of tumours by International Agency for Research on Cancer, WHO Classification of Tumours of the Digestive System: 2010, Volume 3, 4th edition. Lyon: International Agency for Research on Cancer; 2010. [Google Scholar]
- 37.Bernstine H, Braun M, Yefremov N, Lamash Y, Carmi R, Stern D, Steinmetz A, Sosna J, Groshar D. FDG PET/CT early dynamic blood flow and late standardized uptake value determination in hepatocellular carcinoma. Radiology. 2011;260:503–10. doi: 10.1148/radiol.11102350. [DOI] [PubMed] [Google Scholar]
- 38.Lin WY, Tsai SC, Hung GU. Value of delayed 18F-FDG-PET imaging in the detection of hepatocellular carcinoma. Nucl Med Commun. 2005;26:315–21. doi: 10.1097/00006231-200504000-00003. [DOI] [PubMed] [Google Scholar]
- 39.Wu B, Zhao Y, Zhang Y, Tan H, Shi H. Does dual-time-point 18F-FDG PET/CT scan add in the diagnosis of hepatocellular carcinoma? Hell J Nucl Med. 2017;20:79–82. doi: 10.1967/s002449910511. [DOI] [PubMed] [Google Scholar]
- 40.Izuishi K, Yamamoto Y, Mori H, Kameyama R, Fujihara S, Masaki T, Suzuki Y. Molecular mechanisms of [18F]fluorodeoxyglucose accumulation in liver cancer. Oncol Rep. 2014;31:701–6. doi: 10.3892/or.2013.2886. [DOI] [PubMed] [Google Scholar]
- 41.Torizuka T, Tamaki N, Inokuma T, Magata Y, Sasayama S, Yonekura Y, Tanaka A, Yamaoka Y, Yamamoto K, Konishi J. In vivo assessment of glucose metabolism in hepatocellular carcinoma with FDG-PET. J Nucl Med. 1995;36:1811–7. [PubMed] [Google Scholar]
- 42.Seo S, Hatano E, Higashi T, Nakajima A, Nakamoto Y, Tada M, Tamaki N, Iwaisako K, Kitamura K, Ikai I, Uemoto S. P-glycoprotein expression affects 18F-fluorodeoxyglucose accumulation in hepatocellular carcinoma in vivo and in vitro. Int J Oncol. 2009;34:1303–1312. [PubMed] [Google Scholar]
- 43.Lee JW, Paeng JC, Kang KW, Kwon HW, Suh KS, Chung JK, Lee MC, Lee DS. Prediction of tumor recurrence by 18F-FDG PET in liver transplantation for hepatocellular carcinoma. J Nucl Med. 2009;50:682–7. doi: 10.2967/jnumed.108.060574. [DOI] [PubMed] [Google Scholar]
- 44.Chen R, Li J, Zhou X, Liu J, Huang G. Fructose-1,6-Bisphosphatase 1 reduces 18F FDG uptake in hepatocellular carcinoma. Radiology. 2017;284:844–853. doi: 10.1148/radiol.2017161607. [DOI] [PubMed] [Google Scholar]
- 45.Li YC, Yang CS, Zhou WL, Li HS, Han YJ, Wang QS, Wu HB. Low glucose metabolism in hepatocellular carcinoma with GPC3 expression. World J Gastroenterol. 2018;24:494–503. doi: 10.3748/wjg.v24.i4.494. [DOI] [PMC free article] [PubMed] [Google Scholar]
- 46.Ho CL, Yu SC, Yeung DW. 11C-acetate PET imaging in hepatocellular carcinoma and other liver masses. J Nucl Med. 2003;44:213–21. [PubMed] [Google Scholar]
- 47.Talbot JN, Fartoux L, Balogova S, Nataf V, Kerrou K, Gutman F, Huchet V, Ancel D, Grange JD, Rosmorduc O. Detection of hepatocellular carcinoma with PET/CT: a prospective comparison of 18F-fluorocholine and 18F-FDG in patients with cirrhosis or chronic liver disease. J Nucl Med. 2010;5:1699–706. doi: 10.2967/jnumed.110.075507. [DOI] [PubMed] [Google Scholar]
- 48.Abdelmonem E, Shaban IN. Can fluorine-18-fluorodeoxyglucose positron emission tomography/computed tomography detect hepatocellular carcinoma and its extrahepatic metastases? The Egyptian Journal of Radiology and Nuclear Medicine. 2018;1:196–201. [Google Scholar]
- 49.Koroglu R, Koksal I, Gezer F, Kahraman A, Kekilli E. A (18)F-FDG PET/CT screening study of a hepatocellular carcinoma patient with diffuse (18)F-FDG uptake into the portal vein and its intrahepatic branches. World J Nucl Med. 2016;15:68–70. doi: 10.4103/1450-1147.167590. [DOI] [PMC free article] [PubMed] [Google Scholar]
- 50.Ho CL, Chen S, Yeung DW, Cheng TK. Dual-tracer PET/CT imaging in evaluation of metastatic hepatocellular carcinoma. J Nucl Med. 2007;48:902–9. doi: 10.2967/jnumed.106.036673. [DOI] [PubMed] [Google Scholar]
- 51.Lin CY, Chen JH, Liang JA, Lin CC, Jeng LB, Kao CH. 18F-FDG PET or PET/CT for detecting extrahepatic metastases or recurrent hepatocellular carcinoma: a systematic review and meta-analysis. Eur J Radiol. 2012;81:2417–22. doi: 10.1016/j.ejrad.2011.08.004. [DOI] [PubMed] [Google Scholar]
- 52.Katyal S, Oliver JH 3rd, Peterson MS, Ferris JV, Carr BS, Baron RL. Extrahepatic metastases of hepatocellular carcinoma. Radiology. 2000;216:698–703. doi: 10.1148/radiology.216.3.r00se24698. [DOI] [PubMed] [Google Scholar]
- 53.Chotipanich C, Kunawudhi A, Promteangtrong C, Tungsuppawattanakit P, Sricharunrat T, Wongsa P. Diagnosis of hepatocellular carcinoma using C11 choline PET/CT: comparison with F18 FDG, ContrastEnhanced MRI and MDCT. Asian Pac J Cancer Prev. 2016;17:3569–73. [PubMed] [Google Scholar]
- 54.Paudyal B, Oriuchi N, Paudyal P, Higuchi T, Nakajima T, Endo K. Expression of glucose transporters and hexokinase II in cholangiocellular carcinoma compared using [18F]-2-fluro-2-deoxy-D-glucose positron emission tomography. Cancer Sci. 2008;99:260–6. doi: 10.1111/j.1349-7006.2007.00683.x. [DOI] [PMC free article] [PubMed] [Google Scholar]
- 55.Sacks A, Peller PJ, Surasi DS, Chatburn L, Mercier G, Subramaniam RM. Value of PET/CT in the management of primary hepatobiliary tumors, part 2. AJR Am J Roentgenol. 2011;197:W260–5. doi: 10.2214/AJR.11.6995. [DOI] [PubMed] [Google Scholar]
- 56.Breitenstein S, Apestegui C, Clavien PA. Positron emission tomography (PET) for cholangiocarcinoma. HPB (Oxford) 2008;10:120–1. doi: 10.1080/13651820801992583. [DOI] [PMC free article] [PubMed] [Google Scholar]
- 57.Mar WA, Shon AM, Lu Y, Yu JH, Berggruen SM, Guzman G, Ray CE Jr, Miller F. Imaging spectrum of cholangiocarcinoma: role in diagnosis, staging, and posttreatment evaluation. Abdom Radiol (NY) 2016;41:553–67. doi: 10.1007/s00261-015-0583-9. [DOI] [PubMed] [Google Scholar]
- 58.Sainani NI, Shyn PB, Tatli S, Morrison PR, Tuncali K, Silverman SG. PET/CT-guided radiofrequency and cryoablation: is tumor fluorine-18 fluorodeoxyglucose activity dissipated by thermal ablation? J Vasc Interv Radiol. 2011;22:354–60. doi: 10.1016/j.jvir.2010.11.027. [DOI] [PubMed] [Google Scholar]
- 59.Kwee SA, Sato MM, Kuang Y, Franke A, Custer L, Miyazaki K, Wong LL. [18F]Fluorocholine PET/CT imaging of liver cancer: radiopathologic correlation with tissue phospholipid profiling. Mol Imaging Biol. 2017;19:446–455. doi: 10.1007/s11307-016-1020-3. [DOI] [PMC free article] [PubMed] [Google Scholar]
- 60.Maeda T, Tateishi U, Hasegawa T, Ojima H, Arai Y, Sugimura K. Primary hepatic angiosarcoma on coregistered FDG PET and CT images. AJR Am J Roentgenol. 2007;188:1615–7. doi: 10.2214/AJR.05.0830. [DOI] [PubMed] [Google Scholar]
- 61.Oe A, Habu D, Kawabe J, Torii K, Kawamura E, Kotani J, Hayashi T, Sakaguchi H, Shiomi S. A case of diffuse hepatic angiosarcoma diagnosed by FDG-PET. Ann Nucl Med. 2005;19:519–21. doi: 10.1007/BF02985582. [DOI] [PubMed] [Google Scholar]
- 62.Mahajan S, Kalra S, Chawla M, Dougall P. Detection of diffuse infiltrative primary hepatic lymphoma on FDG PET-CT: hallmarks of hepatic superscan. World J Nucl Med. 2016;15:142–4. doi: 10.4103/1450-1147.167581. [DOI] [PMC free article] [PubMed] [Google Scholar]
- 63.Seshadri N, Ananthasivan R, Kavindran R, Srikanth G, Chandra S. Primary hepatic (extranodal) lymphoma: utility of [(18)F]fluorodeoxyglucose-PET/CT. Cancer Imaging. 2010;10:194–7. doi: 10.1102/1470-7330.2010.0028. [DOI] [PMC free article] [PubMed] [Google Scholar]
- 64.McLoney ED, Isaacson AJ, Keating P. The role of PET imaging before, during, and after percutaneous hepatic and pulmonary tumor ablation. Semin Intervent Radiol. 2014;31:187–92. doi: 10.1055/s-0034-1373793. [DOI] [PMC free article] [PubMed] [Google Scholar]
- 65.Goshen E, Davidson T, Zwas ST, Aderka D. PET/CT in the evaluation of response to treatment of liver metastases from colorectal cancer with bevacizumab and irinotecan. Technol Cancer Res Treat. 2006;5:37–43. doi: 10.1177/153303460600500105. [DOI] [PubMed] [Google Scholar]
- 66.Rust E, Hubele F, Marzano E, Goichot B, Pessaux P, Kurtz JE, Imperiale A. Nuclear medicine imaging of gastro-entero-pancreatic neuroendocrine tumors. The key role of cellular differentiation and tumor grade: from theory to clinical practice. Cancer Imaging. 2012;12:173–84. doi: 10.1102/1470-7330.2012.0026. [DOI] [PMC free article] [PubMed] [Google Scholar]
- 67.Tan TH, Lee BN, Hassan SZ. Diagnostic value of (68)Ga-DOTATATE PET/CT in liver metastases of neuroendocrine tumours of unknown origin. Nucl Med Mol Imaging. 2014;48:212–5. doi: 10.1007/s13139-013-0258-9. [DOI] [PMC free article] [PubMed] [Google Scholar]
- 68.Hellman RS, Krasnow AZ, Sudakoff GS. Positron emission tomography for staging and assessment of tumor response of hepatic malignancies. Semin Intervent Radiol. 2006;23:21–32. doi: 10.1055/s-2006-939838. [DOI] [PMC free article] [PubMed] [Google Scholar]
- 69.Sarikaya I, Yeung HW, Erdi Y, Larson SM. Respiratory artefact causing malpositioning of liver dome lesion in right lower lung. Clin Nucl Med. 2003;28:943–4. doi: 10.1097/01.rlu.0000093095.28642.2b. [DOI] [PubMed] [Google Scholar]
- 70.Evans J, Willyard CE, Sabih DE. Cavernous hepatic hemangiomas. In: StatPearls [Internet] Treasure Island (FL): StatPearls Publishing; 2021. [PubMed] [Google Scholar]
- 71.Shimada K, Nakamoto Y, Isoda H, Saito H, Arizono S, Shibata T, Togashi K. FDG PET for giant cavernous hemangioma: important clue to differentiate from a malignant vascular tumor in the liver. Clin Nucl Med. 2010;35:924–6. doi: 10.1097/RLU.0b013e3181f9de11. [DOI] [PubMed] [Google Scholar]
- 72.Domínguez ML, Rayo JI, Serrano J, Sánchez R, Infante JR, García L, Durán C. Incidental finding of multiple cavernous angiomas on FDG PET/CT. Clin Nucl Med. 2011;36:957–8. doi: 10.1097/RLU.0b013e31821a2bdd. [DOI] [PubMed] [Google Scholar]
- 73.Sollaku S, Frantellizzi V, Casciani E, Gualdi G, Liberatore M, et al. The rare case of positive fdg-positron emission tomography for giant cavernous hemangioma of the liver. Br J Res. 2017;4:19. [Google Scholar]
- 74.Hsee LC, McCall JL, Koea JB. Focal nodular hyperplasia: what are the indications for resection? HPB (Oxford) 2005;7:298–302. doi: 10.1080/13651820500273624. [DOI] [PMC free article] [PubMed] [Google Scholar]
- 75.Kurtaran A, Becherer A, Pfeffel F, Müller C, Traub T, Schmaljohann J, Kaserer K, Raderer M, Schima W, Dudczak R, Kletter K, Virgolini I. 18F-fluorodeoxyglucose (FDG)-PET features of focal nodular hyperplasia (FNH) of the liver. Liver. 2000;20:487–90. doi: 10.1034/j.1600-0676.2000.020006487.x. [DOI] [PubMed] [Google Scholar]
- 76.Aznar DL, Ojeda R, Garcia EU, Aparici F, Sánchez PA, Flores D, Martínez C, Sopena R. Focal nodular hyperplasia (FNH): a potential cause of false-positive positron emission tomography. Clin Nucl Med. 2005;30:636–7. doi: 10.1097/01.rlu.0000174209.49753.a5. [DOI] [PubMed] [Google Scholar]
- 77.Thomeer MG, Broker M, Verheij J, Doukas M, Terkivatan T, Bijdevaate D, De Man RA, Moelker A, IJzermans JN. Hepatocellular adenoma: when and how to treat? Update of current evidence. Therap Adv Gastroenterol. 2016;9:898–912. doi: 10.1177/1756283X16663882. [DOI] [PMC free article] [PubMed] [Google Scholar]
- 78.Stephenson JA, Kapasi T, Al-Taan O, Dennison AR. Uptake of (18) FDG by a hepatic adenoma on positron emission tomography. Case Reports Hepatol. 2011;2011:276402. doi: 10.1155/2011/276402. [DOI] [PMC free article] [PubMed] [Google Scholar]
- 79.Lim D, Lee SY, Lim KH, Chan CY. Hepatic adenoma mimicking a metastatic lesion on computed tomography-positron emission tomography scan. World J Gastroenterol. 2013;19:4432–6. doi: 10.3748/wjg.v19.i27.4432. [DOI] [PMC free article] [PubMed] [Google Scholar]
- 80.Sanli Y, Bakir B, Kuyumcu S, Ozkan ZG, Gulluoglu M, Bilge O, Turkmen C, Mudun A. Hepatic adenomatosis may mimic metastatic lesions of liver with 18F-FDG PET/CT. Clin Nucl Med. 2012;37:697–8. doi: 10.1097/RLU.0b013e3182443ced. [DOI] [PubMed] [Google Scholar]
- 81.Delbeke D, Martin WH, Sandler MP, Chapman WC, Wright JK Jr, Pinson CW. Evaluation of benign vs malignant hepatic lesions with positron emission tomography. Arch Surg. 1998;133:510–5. doi: 10.1001/archsurg.133.5.510. [DOI] [PubMed] [Google Scholar]
- 82.Xia Q, Feng Y, Wu C, Huang G, Liu J, Chen T, Sun X, Song S, Tong L, Ni Y. Differentiation between malignant and benign solitary lesions in the liver with (18)FDG PET/CT: accuracy of age-related diagnostic standard. J Cancer. 2015;6:40–7. doi: 10.7150/jca.10422. [DOI] [PMC free article] [PubMed] [Google Scholar]
- 83.Miyazaki Y, Nawa Y, Nakase K, Kohashi S, Kadohisa S, Hiraoka A, Miyagawa M, Yasukawa M, Hara M. FDG-PET can evaluate the treatment for fungal liver abscess much earlier than other imagings. Ann Hematol. 2011;90:1489–90. doi: 10.1007/s00277-011-1204-5. [DOI] [PubMed] [Google Scholar]
- 84.Cavailloles FA, Mure A, Nasser H, Lecapitaine AL, Granier F. Multiple liver amoebic abscesses detected on FDG PET/CT. Clin Nucl Med. 2014;39:79–80. doi: 10.1097/RLU.0b013e31828e98ad. [DOI] [PubMed] [Google Scholar]
- 85.Aksoy SY, Özdemir E, Sentürk A, Türkölmez S. A case of sarcoidosis diagnosed by positron emission tomography/computed tomography. Indian J Nucl Med. 2016;31:198–200. doi: 10.4103/0972-3919.183608. [DOI] [PMC free article] [PubMed] [Google Scholar]
- 86.Makis W, Palayew M, Rush C, Probst S. Disseminated multi-system sarcoidosis mimicking metastases on 18F-FDG PET/CT. Mol Imaging Radionucl Ther. 2018;27:91–95. doi: 10.4274/mirt.29200. [DOI] [PMC free article] [PubMed] [Google Scholar]
- 87.Oh M, Baek S, Lee SO, Yu E, Ryu JS. A case of acute Q fever hepatitis diagnosed by F-18 FDG PET/CT. Nucl Med Mol Imaging. 2012;46:125–8. doi: 10.1007/s13139-012-0130-3. [DOI] [PMC free article] [PubMed] [Google Scholar]
- 88.Kwak JJ, Tirumani SH, Van den Abbeele AD, Koo PJ, Jacene HA. Cancer immunotherapy: imaging assessment of novel treatment response patterns and immune-related adverse events. Radiographics. 2015;35:424–37. doi: 10.1148/rg.352140121. [DOI] [PubMed] [Google Scholar]
- 89.Shejul Y, Chhajed PN, Basu S. 18F-FDG PET and PET/CT in diagnosis and treatment monitoring of pyrexia of unknown origin due to tuberculosis with prominent hepatosplenic involvement. J Nucl Med Technol. 2014;42:235–7. doi: 10.2967/jnmt.113.132985. [DOI] [PubMed] [Google Scholar]
- 90.Keramida G, Hunter J, Dizdarevic S, Peters AM. Heterogeneity of intrahepatic fat distribution determined by (18)F-FDG PET and CT. Ann Nucl Med. 2016;30:200–6. doi: 10.1007/s12149-015-1045-8. [DOI] [PubMed] [Google Scholar]
- 91.Lin CY, Lin WY, Lin CC, Shih CM, Jeng LB, Kao CH. The negative impact of fatty liver on maximum standard uptake value of liver on FDG PET. Clin Imaging. 2011;35:437–41. doi: 10.1016/j.clinimag.2011.02.005. [DOI] [PubMed] [Google Scholar]
- 92.Bural GG, Torigian DA, Burke A, Houseni M, Alkhawaldeh K, Cucchiara A, Basu S, Alavi A. Quantitative assessment of the hepatic metabolic volume product in patients with diffuse hepatic steatosis and normal controls through use of FDG-PET and MR imaging: a novel concept. Mol Imaging Biol. 2010;12:233–9. doi: 10.1007/s11307-009-0258-4. [DOI] [PubMed] [Google Scholar]
- 93.Hong SP, Noh TS, Moon SH, Cho YS, Lee EJ, Choi JY, Kim BT, Lee KH. Hepatic glucose uptake is increased in association with elevated serum γ-glutamyl transpeptidase and triglyceride. Dig Dis Sci. 2014;59:607–13. doi: 10.1007/s10620-013-2957-6. [DOI] [PubMed] [Google Scholar]
- 94.Harisankar CN. Focal fat sparing of the liver: a nonmalignant cause of focal FDG uptake on FDG PET/CT. Clin Nucl Med. 2014;39:359–61. doi: 10.1097/RLU.0b013e31829b2657. [DOI] [PubMed] [Google Scholar]
- 95.Alonso A, Marsal S, Julià A. Analytical methods in untargeted metabolomics: state of the art in 2015. Front Bioeng Biotechnol. 2015;3:23. doi: 10.3389/fbioe.2015.00023. [DOI] [PMC free article] [PubMed] [Google Scholar]
- 96.Yang Y, Li C, Nie X, Feng X, Chen W, Yue Y, Tang H, Deng F. Metabonomic studies of human hepatocellular carcinoma using high-resolution magic-angle spinning 1H NMR spectroscopy in conjunction with multivariate data analysis. J Proteome Res. 2007;6:2605–14. doi: 10.1021/pr070063h. [DOI] [PubMed] [Google Scholar]
- 97.Beyoğlu D, Imbeaud S, Maurhofer O, Bioulac-Sage P, Zucman-Rossi J, Dufour JF, Idle JR. Tissue metabolomics of hepatocellular carcinoma: tumor energy metabolism and the role of transcriptomic classification. Hepatology. 2013;58:229–38. doi: 10.1002/hep.26350. [DOI] [PMC free article] [PubMed] [Google Scholar]
- 98.Qi SW, Tu ZG, Peng WJ, Wang LX, Ou-Yang X, Cai AJ, Dai Y. 1H NMR-based serum metabolic profiling in compensated and decompensated cirrhosis. World J Gastroenterol. 2012;18:285–90. doi: 10.3748/wjg.v18.i3.285. [DOI] [PMC free article] [PubMed] [Google Scholar]
- 99.Martínez-Granados B, Morales JM, Rodrigo JM, Del Olmo J, Serra MA, Ferrández A, Celda B, Monleón D. Metabolic profile of chronic liver disease by NMR spectroscopy of human biopsies. Int J Mol Med. 2011;27:111–17. doi: 10.3892/ijmm.2010.563. [DOI] [PubMed] [Google Scholar]


