

Abstract
Background
Microscopic diagnosis of Giemsa-stained thick and thin blood films has remained the standard laboratory method for diagnosing malaria. High quality performance of microscopists that examine blood slides in health facilities remains critically important.
Materials and methods
A cross-sectional study was conducted to assess the performance of 107 malaria microscopists working at 23 malaria rechecking laboratories in Ethiopia. A set of 12 blood film slides was distributed to each microscopist. Data was collected and exported to SPSS version 20 for analysis. Chi-square, sensitivity, specificity, percent agreement, and kappa scores were calculated to assess performance in detecting and identification of Plasmodium species.
Results
The mean age of the participants was 30 ± 5 yrs and most of them (54; 50.5%) were working at regional reference laboratories. Overall, the sensitivity of participants in detecting and identifying malaria parasite species was 96.8% and 56.7%, respectively. The overall agreement on detection and identification of malaria species was 96.8% (Kappa = 0.9) and 64.8% (Kappa = 0.33), respectively. The least accurately identified malaria parasite species was P. malariae (3/107; 2.8%) followed by P. ovale (35/107; 32.7%). Participants working at hospital laboratories had the highest percentage (72.3 %, Kappa=0.51) of accurate species identification. Study participants that had participated in malaria microscopy and quality assurance trainings were significantly better at quantifying parasite densities (P<0.001).
Conclusion
The accuracy of parasite identification and quantification differed strongly between participants and expert microscopists. Therefore, regular competency assessment and training for malaria microscopists should be mandatory to assure proper diagnosis and management of malaria in Ethiopia.
1 Introduction
Malaria is a mosquito-borne infectious disease of humans and other animals caused by parasitic protozoans of the genus Plasmodium [1,2]. In humans, malaria is caused by P. falciparum, P. malariae, P. ovale, P. vivax or P. knowlesi [3]. Globally, an estimated 3.2 billion people in 97 countries and territories are at risk of being infected with malaria and developing disease, and 1.2 billion are at high risk. According to the latest estimates, 214 million cases of malaria occurred globally in 2015 and resulted in 438,000 deaths. Of these, 90% of all occurred in sub-Saharan Africa followed by the WHO Southeast Asia Region (7%) and the WHO Eastern Mediterranean Region (2%) [4]. Every minute a child on the African continent dies due to malaria [5]. In Ethiopia, malaria remains the leading cause of morbidity and mortality. Approximately 75% of the country is malarious, and 60% of the Ethiopian population (totalling 96.6 million in 2014) is at risk of malaria [6-8].
Correct diagnosis of malaria is vital to determine disease prevalence and incidence in order to evaluate the impact of malaria control interventions [9]. Training and competency assessment in malaria microscopy using already trained personnel and validated slides are important for evaluating, improving and maintaining high performance in malaria microscopy, and is also an opportunity to provide continuing education [10,11]. Many rechecking laboratories were established in different regions of Ethiopia to recheck the blood film slides examined at microscopic sites. Some of the rechecking laboratories are providing only referral services, so that they are not providing routine services on malaria microscopy. The competency status of the malaria microscopists that are working at rechecking laboratories is not known. Therefore this study aimed to assess the performance of malaria microscopists working at Malaria External Quality Assessment (EQA) Rechecking Laboratories in Ethiopia in terms of parasite detection, parasite species identification, stage identification and parasite quantification using light microscopy.
2 Materials and methods
2.1 Study setting and participants
The study was conducted from February to May, 2015. Ethiopia is administratively structured with nine regional states and two city administration [12]. A total of 23 malaria rechecking laboratories were included in the study (Figure 1). All microscopists working at the malaria EQA rechecking laboratories were invited to participate in this study.
Figure 1.
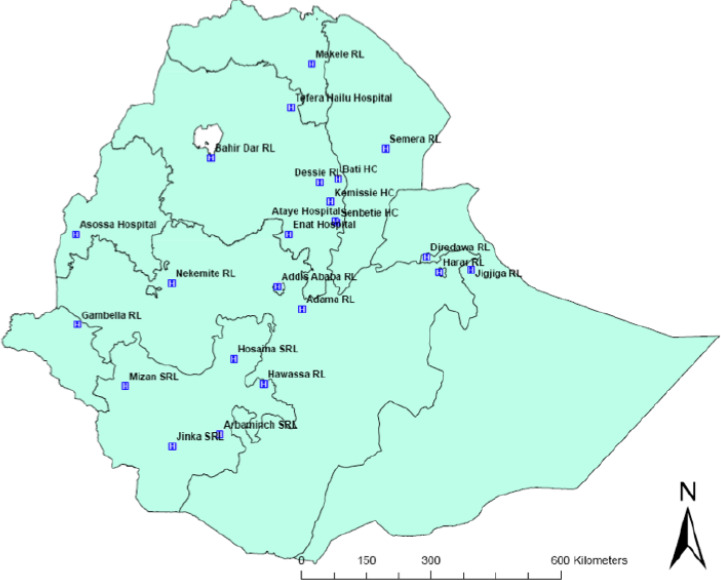
Malaria rechecking study sites in Ethiopia.
2.2 Slide preparation and validation
Whole blood (3-5 ml) was collected in EDTA tubes from volunteers above 18 years of age. A total of 200 blood film slides and Dried Blood Spot (DBS) were prepared from each donor. Six and two microliters were used to prepare a thick and thin blood film, respectively. Both thick and thin blood films were prepared on a single slide. The thin blood film was fixed with absolute methanol. After drying, both thin and thick films were stained for 30-45 minutes with 3% Giemsa working solution. Blood film for microscopic diagnosis of malaria was made semi-permanent by cover slip using Poly mount (toluene based, Cat. # 08381) and a cover glass. Six malaria microscopy experts (microscopists certified as level 1 by WHO after the examination of WHO AFRO external competency assessment) were involved in the validation process and each of them read 2 blood film slides from each donor. Discordant results among validators on species identification were verified by Polymerase Chain Reaction (PCR).
2.3 Administration of blood film slides
After validation, two sets of blood film (BF) slides with different values were given to study participants. The first set comprised a total of 10 BF slides; 2 negative slides, 8 positive slides (3 P. falciparum slides with different densities, 2 BF slides with P. vivax, 1 Mixed species slide of P. falciparum and P. vivax, 1 BF slide with P. malariae, and 1 BF slide with P. ovale). These BF slides were used for assessment of parasites detection, stage and species identification. The second set contained 2 positive slides; 1 P. falciparum BF slide with a parasite density of 1891 parasites/μL (with a range of 1419-2363 parasites/μL) and 1 P. falciparum BF slide with a parasite density of 50,659 parasites/μL (with a range of 37990-63323 parasites/μL) were used for the assessment of quantification performance. Based on WHO recommendation, quantification results that deviated ±25% from the mean calculated by expert readers was considered as correct quantification result. A total of 120 minutes (10 minutes per BF slide) were allocated for the exercise [13].
2.4 Questionnaire
A structured and standardised questionnaire, which was used to obtain information about participating facilities and microscopists, was distributed amongst the participants. The questionnaire addressed components like age, sex, educational background, type of health facility, in service training, work experience, routine practice of the professional, and number of slides rechecked per person. The data was collected by those that had good experience in malaria microscopy at Ethiopian public health institute laboratories.
2.5 Data management and quality assurance
The quality of the blood film slides was checked by reference readers against WHO standards before distribution to malaria microscopists, and the results were critically assessed for completeness. Pre-testing of each questionnaire type was done with 5% of the study population. Intensive supervision was done during data collection.
2.6 Statistical analysis
Data was collected and entered into Microsoft Excel sheets and exported to software SPSS version 20 for analysis. Chi -square (for categorical data), sensitivity, specificity, percent agreement, and kappa scores were calculated to assess laboratory professionals’ performance in detecting and identification Plasmodium species. Based on WHO classification, microscopists were considered as: ‘In training’ - when the agreement with the expert reader in detection with species identification of malaria parasite was less than 70%; ‘Advanced’ - when the agreement was greater than or equal to 70% but less than 80%; ‘Reference’ - when the agreement was greater than or equal to 80% but less 90%; and ‘Expert’ - when the agreement was greater than or equal to 90% [13]. Kappa values were calculated to determine the strength of an agreement. Based on the calculation the strength was classified as: < 0.20 slight agreement, 0.21–0.40 fair agreement, 0.41–0.60 moderate agreement, 0.61–0.80 substantial agreement, or 0.81–0.99 almost perfect agreement [14]. A percent agreement score >80% is a passing point for external quality assessment based on WHO and national guidelines [13,15].
2.7 Ethical clearance
This study was done after obtaining approval from the ethical clearance committee of Addis Ababa University College of Health Sciences, Department of Medical Laboratory Sciences, departmental research and ethics review committee. Information about the study was provided to all malaria microscopists involved in the study and to all concerned bodies at the study sites. All participants were assured about the confidentiality, protection and anonymity of the data. Written informed consent was obtained from voluntary study participants before conducting the study.
3 Results
From a total of 129 malaria microscopists that were engaged in rechecking blood film slides, 107 (83%) participated in the study. The mean age (± SD) of the participants was 30 ± 5 yrs and 90 (84.1%) were men (Table 1).
Table 1.
Characteristic of malaria microscopists working on malaria microscopy at malaria EQA rechecking laboratories in Ethiopia (n=107).
| Characteristic | n | % |
|---|---|---|
| Age (years) | ||
| 20-30 | 68 | 63.6 |
| 31-40 | 37 | 34.6 |
| >41 | 2 | 1.9 |
| Sex | ||
| Male | 90 | 84.1 |
| Female | 17 | 15.9 |
| Educational status | ||
| Diploma | 25 | 23.4 |
| Degree | 63 | 58.9 |
| MSc and above | 19 | 17.8 |
| Experience with malaria microscopy | ||
| < 2 Years | 4 | 3.7 |
| 2-5 Years | 43 | 40.2 |
| > 5 Years | 60 | 56.1 |
| Place of work | ||
| Health centre laboratory | 16 | 15.0 |
| Hospital laboratory | 22 | 20.5 |
| Sub-regional laboratory | 15 | 14.0 |
| Regional reference laboratory | 54 | 50.5 |
| Previous participation in malaria microscopy and QA training | ||
| Yes | 83 | 77.6 |
| No | 24 | 22.4 |
| Number of BF slides rechecked per year | ||
| ≤150 | 56 | 52.3 |
| 151-300 | 39 | 36.4 |
| 301-450 | 6 | 5.6 |
| ≥451 | 6 | 5.6 |
Based on WHO classification, 78 (72.9%) of the participants were ‘in training’ with respect to species identification. Only 11(10.3%) participants quantified both BF slides correctly while 34 (31.8%) used a non-recommended quantification system (Table 2). From a total of 1070 blood film slides that were distributed for detection, 1036 (96.8%) were correctly reported for the presence or absence of malaria parasites and from a total of 856 positive blood film slides only 486 (56.8%) were reported correctly in terms of species identification. Of 214 BF slides that were distributed for quantification, only 63(29.4%) were quantified correctly.
Table 2.
Overall performance in terms of parasite species identification, stage identification and parasite quantification according to WHO classification (n=107).
| Performance classification | Frequency | % |
|---|---|---|
| % Agreement on species identification | ||
| ≥ 90 (expert) | 0 | 0 |
| ≥ 80 - 90 (reference) | 10 | 9.3 |
| ≥ 70 - 80 (advanced) | 19 | 17.8 |
| < 70 (in training) | 78 | 72.9 |
| % Agreement on stage identification | ||
| ≥ 90 | 33 | 30.8 |
| ≥ 80 - 90 | 35 | 32.7 |
| ≥ 70 - 80 | 27 | 25.2 |
| < 70 | 12 | 11.2 |
| Performance on parasite quantification | ||
| Quantified both BF slides correctly | 11 | 10.3 |
| Quantified one BF slide correctly | 45 | 42.0 |
| Missed both | 17 | 15.9 |
| Used non-recommended quantification system | 34 | 31.8 |
The overall agreement on detection of malaria parasites was 96.8% (Kappa = 0.9), which is ‘perfect agreement’ while on identification of malaria species it was 64.8% (Kappa = 0.33) which is a ‘fair agreement’ (Table 3). False positive rate (negative BF slides reported as positive) and false negative rate (positive slides reported as negative) were 0.84% (7/836) and 11.5% (27/234), respectively.
Table 3.
Overall sensitivity, specificity and agreement between participants and expert accuracy in detecting and identifying parasite species.
| Participant reader | Expert reader | Sensitivity | Specificity | Agreement | Kappa | |||
|---|---|---|---|---|---|---|---|---|
| Positive | Negative | Total | ||||||
| Parasite detection | Positive | 829 | 7 | 836 | 96.8% | 96.7% | 96.8% | 0.9 |
| Negative | 27 | 207 | 234 | |||||
| Total | 856 | 214 | 1070 | |||||
| Species identification | Positive | 486 | 7 | 493 | 56.7% | 96.7% | 64.8% | 0.33 |
| Negative | 370 | 207 | 577 | |||||
| Total | 856 | 214 | 1070 | |||||
The performance of participants in species identification showed that 80.1% of BF slides with P. falciparum but only 2.8% of BF slides with P. malariae were identified correctly (Figure 2). A total of 64 (61.5%) BF slides with P malariae were identified wrongly as P. falciparum, 42 (58.3%) BF slides with P. ovale were identified wrongly as P. vivax, and 37 (34.6%) of cases with mixed (P. falciparum and P. vivax) BF slides were reported only partially correctly as P. falciparum.
Figure 2.
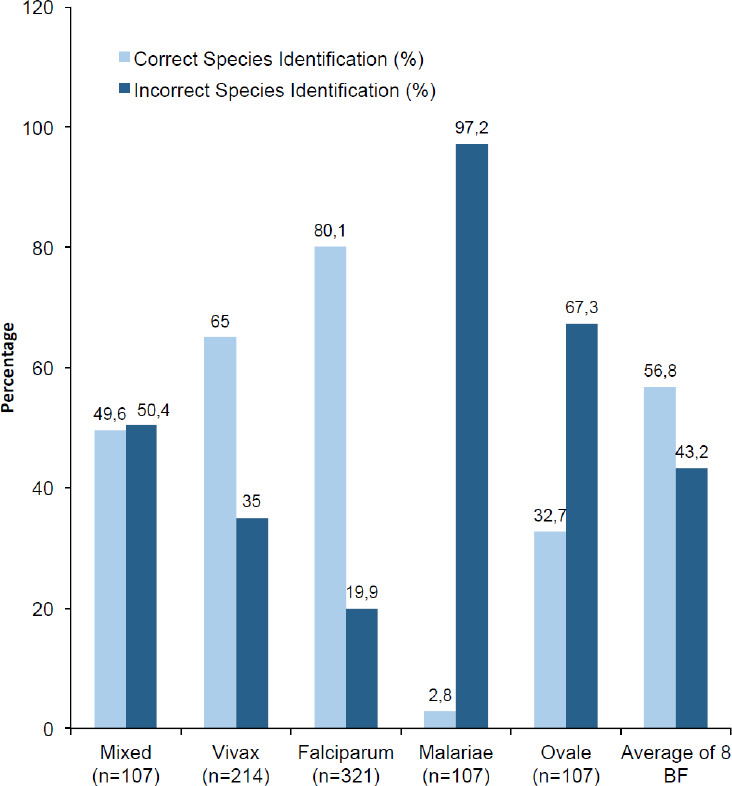
Accuracy of malaria microscopists in determining malaria parasite species (8 different known positive BF slides).
Out of 107 participants, 97 (90.7%) scored <80% overall, which indicates failure based on WHO and national guidelines [13,15]. The number of participants that scored a pass mark (≥80%) was higher among participants with MSc level education (6; 31.6%), or participants with more than 5 years work experience (9; 15%) followed by 2-5 years experience (1 participant; 2.3%), respectively (P=0.75). The number of participants that scored ≥80% was higher among participants that had received malaria microscopy and QA training 10 (12.1%) while all participants that had not received training on malaria microscopy and QA scored below 80% (P=0.074).
Participants working at hospital laboratories had the highest percentage agreement with expert readings (72.3%, Kappa=0.51) while regional reference laboratories had the lowest (61.7%, Kappa=0.46; Table 4).
Table 4.
Agreement between participants (n=107) and expert reader in identification of malaria species, grouped by type of health facility.
| Variable | Participant reader | Expert reader | Sensitivity | Specificity | Agreement | Kappa | |||
|---|---|---|---|---|---|---|---|---|---|
| Positive | Negative | Total | |||||||
| Type of health facility | Regional reference laboratory | Positive | 230 | 5 | 235 | 53.2% | 95.4% | 61.7% | 0.46 |
| Negative | 202 | 103 | 305 | ||||||
| Total | 432 | 108 | 540 | ||||||
| Sub regional laboratory | Positive | 66 | 0 | 66 | 55.0% | 100% | 64% | 0.47 | |
| Negative | 54 | 30 | 84 | ||||||
| Total | 120 | 30 | 150 | ||||||
| Hospital laboratory | Positive | 115 | 0 | 115 | 65.3% | 100% | 72.3% | 0.51 | |
| Negative | 61 | 44 | 105 | ||||||
| Total | 176 | 44 | 220 | ||||||
| Health centre laboratory | Positive | 75 | 2 | 77 | 58.6% | 93.8% | 65.6% | 0.49 | |
| Negative | 53 | 30 | 83 | ||||||
| Total | 128 | 32 | 160 | ||||||
Quantification performance of malaria microscopists working at sub-regional laboratories was 73.3% which was higher than malaria microscopists performance from other malaria rechecking laboratories (P=0.003). Study participants that participated in malaria microscopy and QA training had a better performance on quantification than those who had not received training (P<0.001) (Table 5).
Table 5.
Relationship between quantification performance of malaria microscopists (n=107) and work experience, educational status, types of health facility and training.
| Variables | Quantified at least one BF slide (%) | Missed both BF slides (%) | Chi-Square | df | p-value |
|---|---|---|---|---|---|
| Educational Status | |||||
| Diploma | 11 (10.3) | 14 (13.1) | 1.0 | 2 | 0.607 |
| Degree | 34 (31.8) | 29 (27.0) | |||
| MSc or higher | 11 (10.3) | 8 (7.5) | |||
| Work Experience (years) | |||||
| < 2 | 2 (1.9) | 2 (1.9) | 0.4 | 2 | 0.823 |
| 2-5 | 21 (19.6) | 22 (20.6) | |||
| > 5 | 33 (30.8) | 27 (25.2) | |||
| Place of Work | |||||
| Health centre laboratory | 6 (5.6) | 10 (9.3) | 14.2 | 3 | 0.003 |
| Hospital laboratory | 5 (4.7) | 17 (15.9) | |||
| Sub regional laboratory | 11 (10.3) | 4 (3.7) | |||
| Regional reference laboratory | 34 (31.8) | 20 (18.7) | |||
| Participation in malaria microscopy and QA training | |||||
| Yes | 54 (50.5) | 29 (27.1) | 24.0 | 1 | <0.001 |
| No | 2 (1.9) | 22 (20.5) |
4 Discussion
Malaria remains a leading cause of morbidity in Ethiopia [7]. Microscopy of Giemsa-stained thick and thin blood films is the gold standard method for diagnosis of malaria. Competency assessment is one of the methods to verify microscopists’ competency to perform laboratory tests and produce accurate, reliable and timely results. In the current study an agreement between participants and malaria microscopy expert readers in the detection of malaria parasites was 96.8% (Kappa=0.9) which was relatively higher when compared with the study conducted in Hawassa town, Ethiopia which was 88% (Kappa=0.67) [16]. Based on WHO recommendation 78 (72.9%) participants were ‘in training’ in the current study while only 17 (23.6%) were rated as ‘in training” in the study conducted in Hawassa town [16]. The reason for this may be lack of providing routine service; which is used to develop diagnostic skills for malaria parasite detection and identification, and/or lack of regular training on malaria microscopy.
Both the sensitivity (96.8%) and specificity (96.7%) of microscopists in this study were higher than in the study conducted in Hawassa town which was 82% and 96.5% [16], in USA it was 92% and 90% [17], and in a study from Zambia it was 88% and 91% [18], respectively. The higher sensitivity in the current study regarding the detection of parasites indicates that there was a low rate of false negative results, which means that misdiagnoses of true infections was low. This can help an individual to take appropriate treatment in line with malaria.
Overall, strength of agreement in identification of different species of malaria in the current study (Kappa = 0.33) was lower than the study conducted in North Gondar (Kappa = 0.47) [19] and Hawassa town (Kappa=0.63) [16]. The number of participants that failed to correctly speciate P. falciparum (19.9%) in the current finding was slightly higher than a similar study conducted in Hawassa, where this was about 18% [20] but lower than a survey conducted in Canada 27% [21]. Blood film slides with P.ovale which were identified correctly (32.7%) was higher than the study conducted in North Gondar, northwest Ethiopia in which no microscopist correctly identified P. ovale [22]. Low performance on species identification may be due to the fact that some participants did not spend sufficient time to examine the slides, or possibly due to lack of regular training. Lack of correct species identification may lead to incorrect administration of first line treatment. For example the recommended first-line treatment of all clinically and parasitologically-diagnosed uncomplicated P. falciparum malaria in Ethiopia is an artemisinin-based combination therapy (ACT) called artemether-lumefantrine (AL) while the first line treatment for P. vivax is oral chloroquine [6]. Correct species identification can be used to treat an individual with an appropriate first line drug and used to prevent drug resistance.
In our study, the false positivity rate (negative BF slides reported as positive) was 0.8% which was lower than the study conducted in Canada (2.0%) [21], 6.9% reported in Hawassa town [16], 7% reported in USA [17], 12% reported in Hawassa, Ethiopia [20], and 19% reported in Democratic Republic of Congo [23]. These false positive results could lead to unnecessary treatment with antimalarial drug or a delayed diagnosis of the true cause of illness and misleading the clinician from considering other causes of fever and disease. The false negativity rate (positive slides reported as negative) in our study was 11.5% which was higher than 10.1% reported in Democratic Republic of Congo [23] and 3% reported in USA [17]. False negativity can lead to delayed treatment, development of serious complications and possibly death or exposure to unnecessary treatment with other (non anti-malaria) drugs.
Quantification performance of malaria microscopists working at sub-regional laboratories was 73.3%, which was higher than malaria microscopist performance from other malaria rechecking laboratories (P=0.003).This might be because most participants that were working at sub-regional laboratories were trained on malaria microscopy and QA training. Study participants that were trained on malaria microscopy and QA performed significantly better on quantification (P<0.001). Correctly-quantified blood film slides in our study were 31.3%, which was lower than 81% of correct quantification reported from the USA [17]. Participants that used a non-recommended quantification (+) system in this study was 31.8%, which was lower than the study conducted in Democratic Republic of Congo in which 68.6% of the participants used this quantification system [23]. Parasite quantification using non-recommended system may be due to lack of updated information (lack of training), or lack of awareness of the advantage of the quantitative system over a semi quantitative (+) system, or it might be due to lack of commitment to adhere to specified time for counting parasite with the recommended quantification system. This is important because measuring parasite density can be used to monitor patient response to treatment and to study drug efficacy.
5 Conclusions
Even though the performance of participants was good in detection of malaria using microscopy their agreement with expert microscopists identification of different malaria species and the quantification of parasite densities were very low. Most participants did not identify P. malariae and P.ovale correctly. The ability to identify true positives was lower amongst participants that worked at regional reference laboratories. Participants that were not trained on malaria microscopy displayed very poor performance in parasite quantification. Quantification performance of microscopists working at health centre or hospital laboratories was very low. Therefore, to fill the identified gaps, all stakeholders at all levels have to work on the implementation of regular competency assessments and implement training policy. Demonstration BF slides used for malaria microscopy training have to comprise P. malariae and P.ovale. Regions which are using or which are going to use health centre and hospital laboratories as rechecking sites have to evaluate the performance of laboratories using all external quality assessment methods and have to conduct competency assessment for malaria microscopists that are working at those rechecking sites.
7 Acknowledgements
We would like to acknowledge Ms.Tawabech Lema, Ms.Tsehay Orlando, and staff of Hydas World Health for the preparation of panel slides and validation of blood film slides. In addition we would like to acknowledge Dr. Tesfay Abreha for his technical and material support. We thank the Ethiopian Public Health Institute and Addis Ababa University, College of Health Sciences, for financial support. Last but not least we thank the study participants and drivers for their cooperation and support.
6 Competing interests
The authors declare that they have no competing interests.
References
- 1.World Health Organization. Malaria Fact sheet N°94. http://www.who.int/mediacentre/factsheets/fs094/en/. Accessed 9 June 2017.
- 2.Alemu A, Muluye D, Mihret M, Adugna M et al. Ten year trend analysis of malaria prevalence in Kola Diba, North Gondar, Northwest Ethiopia. Parasit. Vectors. 2012;5:173. doi: 10.1186/1756-3305-5-173. [DOI] [PMC free article] [PubMed] [Google Scholar]
- 3.Collins WE. Plasmodium knowlesi. A malaria parasite of monkeys and humans. Ann. Rev. Entomol. 2012;57:107–121. doi: 10.1146/annurev-ento-121510-133540. [DOI] [PubMed] [Google Scholar]
- 4.World Health Organization. World Malaria report 2015. http://www.who.int/malaria/publications/world-malaria-report-2015/report/en/. Accessed 9 June 2017.
- 5.Ilombe G, Maketa V, Mavoko HM, da Luz RI et al. Performance of HRP2-based rapid test in children attending the health centre compared to asymptomatic children in the community. Malar. J. 2014;13:308. doi: 10.1186/1475-2875-13-308. [DOI] [PMC free article] [PubMed] [Google Scholar]
- 6.Ethiopian Federal Ministry of Health. Ethiopian Health and Nutrition Research Institute. Manual for the Laboratory Diagnosis of Malaria. Vol.1. Addis Ababa; Ethiopia: 2012. [Google Scholar]
- 7.Federal Democratic Republic of Ethiopia Ministry of Health. National Malaria Strategic Plan 2014 – 2020. Addis Ababa; Ethiopia: 2014. Vol.1. [Google Scholar]
- 8.Index Mundi. Ethiopia Demographics Profile 2014. http.//www.indexmundi.com/ethiopia/#Demographics. Accessed 9 June 2017.
- 9.Long GE. Requirements for diagnosis of malaria at different levels of the laboratory network in Africa. Am. J. Clin. Pathol. 2009;131:858–860. doi: 10.1309/AJCPVX71BXWOVWBY. [DOI] [PubMed] [Google Scholar]
- 10.Sharp SE, Elder BL. Competency Assessment in the Clinical Microbiology Laboratory. Clin. Microbiol. Rev. 2004;17:681–694. doi: 10.1128/CMR.17.3.681-694.2004. [DOI] [PMC free article] [PubMed] [Google Scholar]
- 11.McCaskey L, Larocco M. Competency testing in clinical microbiology. Lab. Med. 1995;26:343–349. [Google Scholar]
- 12.Ethiopian Central Statistical Agency and ICF International. Ethiopia Demographic and Health Survey 2011. Addis Ababa; Ethiopia.: 2012. [Google Scholar]
- 13.Word Health Organization. Informal Consultation on Quality Control of Malaria Microscopy. WHO Headquarters; Geneva, Switzerland: 2006. [Google Scholar]
- 14.Viera AJ, Garrett JM. Understanding Inter observer Agreement. The Kappa Statistic. Res. Series. 2005;37:360–365. [PubMed] [Google Scholar]
- 15.Ethiopian Federal Ministry of Health. Ethiopian Health and Nutrition Research Institute. Malaria Laboratory Diagnosis External Quality Assessment Scheme Guidelines. Addis Ababa; Ethiopia: 2009. Vol.1. [Google Scholar]
- 16.Ayalew F, Tilahun B, Taye B. Performance evaluation of laboratory professionals on malaria microscopy in Hawassa Town, Southern Ethiopia. BMC Res. Notes. 2014;7:839. doi: 10.1186/1756-0500-7-839. [DOI] [PMC free article] [PubMed] [Google Scholar]
- 17.Prescott WR, Jordan RG, Grobusch MP, Chinchilli VM et al. Performance of a malaria microscopy image analysis slide reading device. Malar. J. 2012;11:155. doi: 10.1186/1475-2875-11-155. [DOI] [PMC free article] [PubMed] [Google Scholar]
- 18.Barat L, Chipipa J, Kolczak M, Sukwa T. Does the availability of blood slide microscopy for malaria at health centers improve the management of person with fever in Zambia? Am. J. Trop. Med. Hyg. 1999;60:1024–1030. doi: 10.4269/ajtmh.1999.60.1024. [DOI] [PubMed] [Google Scholar]
- 19.Mitiku K, Mengistu G, Gelaw B. The reliability of blood film examination for malaria at the peripheral health unit. Ethiop. J. Health Dev. 2003;17:197–204. [Google Scholar]
- 20.Bereket Z, Girmay A, Tigist G, Endalish K et al. External Quality assessment of malaria microscopy in Hawassa health facilities, Southern Ethiopia. Clin. Med. Res. 2015;4:63–68. [Google Scholar]
- 21.Thomson S, Lohmann RC, Crawford L, Dubash R et al. External quality assessment in the examination of blood films for malarial parasites within Ontario, Canada. Arch. Pathol. Lab. Med. 2000;124:57–60. doi: 10.5858/2000-124-0057-EQAITE. [DOI] [PubMed] [Google Scholar]
- 22.Alemu A, Fuehrer HP, Getnet G, Kassu A et al. Comparison of Giemsa microscopy with nested PCR for the diagnosis of malaria in North Gondar, north-west Ethiopia. Malar. J. 2014;13:174. doi: 10.1186/1475-2875-13-174. [DOI] [PMC free article] [PubMed] [Google Scholar]
- 23.Mukadi P, Gillet P, Lukuka A, Atua B et al. External quality assessment of malaria microscopy in the Democratic Republic of the Congo. Malar. J. 2011;10:308. doi: 10.1186/1475-2875-10-308. [DOI] [PMC free article] [PubMed] [Google Scholar]