

Abstract
There is a need for new approaches and endpoints in oncology drug development, particularly with the advent of immunotherapies and the multiple drug combinations under investigation. Tumor dynamics modeling, a key component to oncology “model-informed drug development,” has shown a growing number of applications and a broader adoption by drug developers and regulatory agencies in the past years to support drug development and approval in a variety of ways. Tumor dynamics modeling is also being investigated in personalized cancer therapy approaches. These models and applications are reviewed and discussed, as well as the limitations and issues open for further investigations. A close collaboration between stakeholders like clinical investigators, statisticians, and pharmacometricians is warranted to advance clinical cancer therapeutics.
Introduction
Model-based analysis is an established field supporting discovery, development, and optimal use of drugs by quantitatively integrating multiple data sources and predicting the outcomes of various “what if” scenarios at the basic research, clinical trials, and real-world patient levels.
In oncology, tumor dynamics is the primary early marker of efficacy. Anticancer treatments work through decreasing tumor burden over time (tumor dynamics) whether by shrinking the tumor, slowing growth, or both resulting in an improvement of patient’s symptoms and prolongation of overall survival (OS). Classical endpoints in oncology clinical trials summarize longitudinal tumor data (by both categorizing and integrating over time) into a single outcome measure (responder/nonresponder) using criteria like RECIST (1). Derived endpoints: objective response rate (ORR), progression-free survival (PFS) are used to support early decisions and design of late-stage clinical trials. However, this approach has long been challenged (2), far too many phase III trials fail to achieve their endpoint (3) and an increased scrutiny needs to be given to how go/no-go decisions are made. There is a need for new approaches and endpoints in oncology drug development (4), particularly with the advent of immunotherapies, to capture the unique patterns of tumor responses to these treatments that exert effects via immune modulation. Multiple versions of the RECIST criteria have been proposed (e.g., iRECIST; ref. 5 and imRECIST; ref. 6) and tumor dynamic models could be more informative by considering time dependencies in the continuous data.
The pioneer of modern pharmacometrics, Prof. L.B. Sheiner envisioned the drug development process as a series of learn-confirm cycles with model-based analyses and simulations at the core of the learning process (7). Sheiner’s vision led to the concept of model-informed drug development (MIDD) that is being evaluated and promoted by regulatory agencies, pharmaceutical industry, academic scientists, and clinicians. MIDD is a key element of the “new product development toolkit” suggested by the FDA in its Critical Path Initiative (8) and recently as part of PDUFA VI (9, 10). The FDA jointly with the International Society of Pharmacometrics held the first PDUFA VI public workshop on MIDD for Oncology Products in 2018 (11). A similar momentum is seen in Europe under the auspices of the European Medicines Agency, which classified model-based approaches according to their impact on regulatory decisions (low, medium, and high; refs. 12, 13). The American Society of Clinical Pharmacology and Therapeutics highlighted quantitative pharmacology applications in translational medicine, drug development, and therapeutic use (14).
The goal of this article is to introduce tumor dynamics modeling approaches and illustrate and discuss their impact in MIDD with focus on clinical development, regulatory review, and personalized therapy.
Measures of tumor burden
One of the challenges in connecting tumor dynamics to outcomes is the limited ability to efficiently quantify the tumor abundance from clinical imaging. Tumor burden is typically assessed by the sum of the longest diameters of target lesions (SLD; ref. 1). These assessments also account for nontarget lesions or new lesions in the definition of disease progression to provide estimates of degrees of treatment response (1). Target lesions are valuable, provided they represent a meaningful fraction of the tumor burden and the breadth of the biology of metastases. Other criteria are available for specific tumor types based on the sum of the product of the diameters and FDG-PET in lymphomas (15) or in brain tumor (16).
Another approach consists in analyzing CT scans to derive serial volumetric measurements of measurable lesions instead of the simplified estimate of the longest diameters (17). Volumetric assessments are expected to outperform unidimensional measurements from RECIST as they are more sensitive to changes in dynamics. Moving forward quantitative image–based radiomics features may be integrated to improve predictivity of the models (18).
Markers to specific tumors like the prostate cancer antigen, the M-protein, or CA-125 are well accepted surrogates of total tumor burden for dynamics modeling (19, 20, 21).
Finally, plasma cell–free DNA (22) and circulating tumor DNA (23) dynamic data might offer new insights in the time course of response and resistance development with the appearance of mutant clones.
Tumor dynamic models
The structure of tumor dynamic models depend on available data (the more data, the more complex or mechanistic the model can be) and on the goal of the model (according to the parsimony principle, the model should be as complex as needed but not more). A number of recent reviews are available (24–28).
The simplest mathematical functions that can be used to fit tumor dynamics data typically account for tumor regression and tumor regrowth with exponential or linear functions (19, 29). Models can incorporate mechanistic complexities like loss of effect (resistance) with time when tumor regrowth is observed during treatment (30, 31), delay in regression (32), fraction of sensitive/resistant cells (33–35). As published, these models do not explicitly account for dose or exposure intensity. They can be used to predict OS under the same treatment conditions as studied but these models cannot be used to predict outcome for unstudied dose or schedules.
Exposure driven models incorporate the effect of varying dose or systemic exposure over time on model parameters for example, cell kill (tumor regression; ref. 36), tumor growth (37), or on specific tumor components like proliferative tumor tissue compartment (38). Combination treatments can be handled (39) although estimation of the contribution of each component in the combination can be challenging if appropriate data are not available (e.g., single-agent data for the different drugs being combined; ref. 37). These models incorporate disease-specific parameters (e.g., tumor growth rate, TGR) and treatment-specific one (e.g., exposure-driven cell kill) and therefore may be leveraged to predict outcome in unstudied conditions (36). An example of such model is illustrated in Fig. 1.
Figure 1.
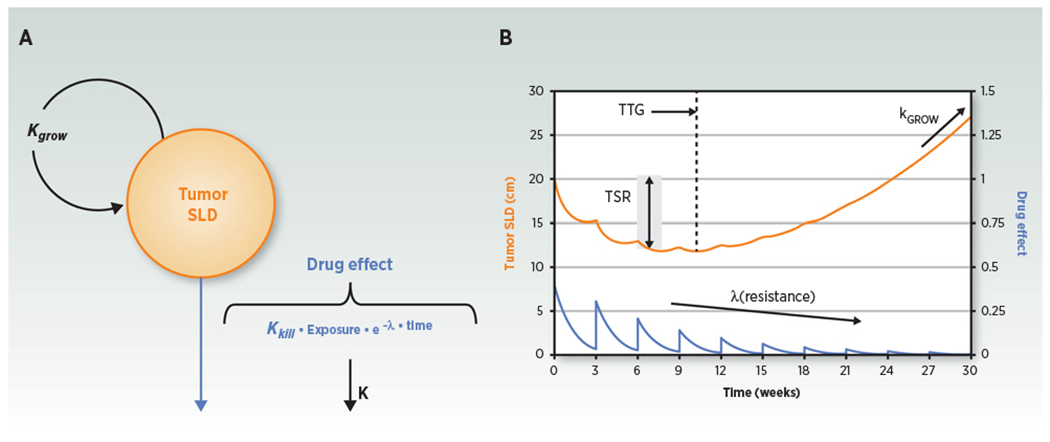
Tumor dynamic model structure and representative plot. A, Compartmental representation of the model. Kgrow, TGRconstant; exposure, drug exposure metric; K, drug exposure elimination rate constant; Kkill, tumor kill rate constant; λ, drug resistance parameter that explain on-treatment reduction of drug effect over time. B, Model-predicted tumor SLD (orange curve) and drug effect (blue curve) time courses for a once every 3 week drug treatment. TSR, tumor size ratio from baseline, typically assessed after 1 or 2 treatment cycles (6–8 weeks).TSR, TTG, Kgrow, and tumor SLD time course are metrics that can be assessed as predictors for survival (adapted from ref. 25). Figure reprinted with permission from Bender and colleagues (Population pharmacokinetic-pharmacodynamic modelling in oncology: a tool for predicting clinical response, Br J Clin Pharmacol 2015; copyright John Wiley and Sons).
Other posttreatment dynamics responses can also be integrated like tumor marker (40) mechanism of action (MOA)-related biomarkers that could be linked to tumor dynamics, such as soluble VEGFR (VEGFR-2 or VEGFR-3) for VEGFR inhibitors sunitinib or axitinib (41–43) or IL18 for the checkpoint inhibitor atezolizumab (44).
Models linking tumor dynamics to outcome
Model based estimates of early tumor growth inhibition (TGI) metrics or model-predicted time course of tumor dynamics have been shown to predict OS, the outcome of primary interest, and the primary endpoint in most of the late-stage (phase III) studies. TGI metrics such as change in tumor size from baseline [tumor size ratio (TSR)] at an early timepoint (e.g., week 6 or 8 depending on the treatment cycle), time to tumor (re)growth (TTG), TGR (see Fig. 1), or CA-125 elimination rate (KELIM) have been used in a variety of tumor types and treatments with various MOA (21, 24–26). The time that tumor size reaches 120% of baseline has also been recently proposed as a measure of treatment benefit that avoids paradoxical effects seen with RECIST time to disease progression (45). Tumor dynamics is taken as a biomarker of drug effect; the TGI-OS link is assumed to be disease-specific but treatment independent. The treatment effect is seen on tumor dynamics, however, the optimum TGI metric (early TSR, TTG, TGR etc.) might depend on the MOA, for example, when progression is merely stabilized as opposed to tumor burden actively reduced, as well as of the disease, for example, indolent disease. The most robust way to show that a given TGI metric captures OS benefit independent of treatment is to show that the TGI-OS model is able to simulate OS hazard ratio (HR) in a randomized study, while treatment effect is not in the model (e.g., ref. 30). For example, differences in TGR predicted the OS benefit (i.e., HR) of atezolizumab compared with docetaxel in previously treated non-small cell lung cancer (NSCLC) while there was no difference in RECIST endpoints (ORR and PFS) or in TSR or TTG (46). Treatment independence is indeed difficult to assess and requires external validations to show that a model developed with data from a treatment is able to predict the outcome for other treatments, ideally with different MOAs. Evidence of treatment independence of TGI-OS models was first provided by Wang and colleagues (29), where a common model was able to predict OS HRs versus control based on week 6 TSR for a variety of approved treatments in NSCLC. Recently, a model, based on nivolumab data in advanced melanoma, predicted OS distributions for ipilimumab-treated patients (47). This point is key to support a wider implementation of this approach and use of an established TGI-OS model to predict outcome of a novel investigational therapy. More recently, the model-predicted time course of tumor dynamics has been used to drive the hazard of death and predict OS (32, 41, 43, 48, 49) in two-stage or joint models.
Figure 2 (adapted from ref. 50) highlights how early treatment-specific tumor dynamics data can be leveraged to predict late OS outcome using disease-specific (historic or public domain) TGI-OS models.
Figure 2.
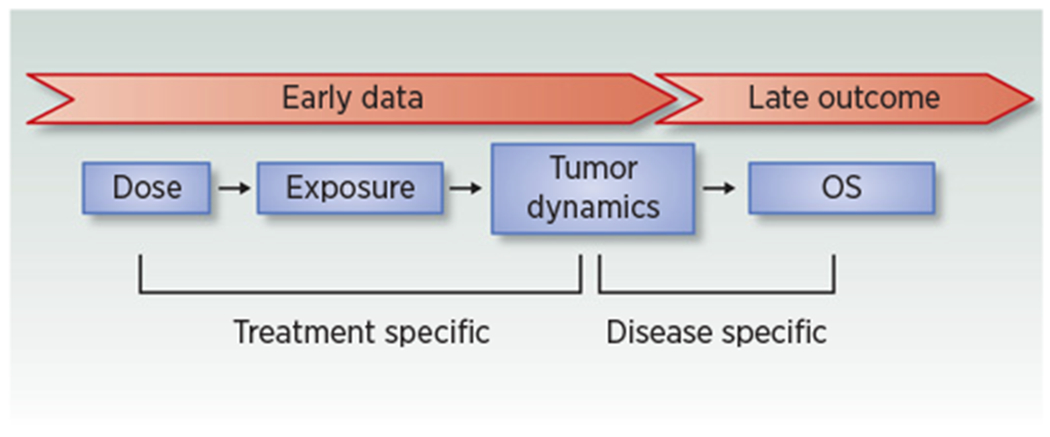
Tumor growth inhibition as a biomarker to predict OS in oncology (adapted from ref. 50). Early data: tumor dynamic data in phase I, II, interim phase III studies (e.g., at time of PFS readout) but also patient’s follow-up at the point of care. Late outcome: OS. Figure reprinted with permission from Bruno and colleagues (Model-based drug development in oncology: what’s next?, Clin Pharmacol Ther 2013; copyright John Wiley and Sons).
A limited number of investigations compared SLD with volumetric-based tumor dynamics predictions of OS. Schindler and colleagues (51) found that volumetric time course was the best predictor of OS in imatinib-treated patients with gastrointestinal stromal tumors, while SLD and volumetric assessments-based estimates of TTG had similar performance in predicting OS HR in patients with colorectal cancer treated with chemotherapy–aflibercept combination (52).
Clinical Development and Regulatory Decisions
There is a variety of ways in which tumor dynamics modeling and model-based TGI metrics can inform seamless clinical development strategies and decisions ranging from simple tumor dynamic comparisons to clinical trial simulations. The impact examples summarized in Table 1 illustrate case studies from early first-in-human to regulatory decisions and postapproval changes in labels.
Table 1.
Summary of case studies with tumor dynamic modeling to inform drug development.
| Question | Data | Process | Findings | Use | References |
|---|---|---|---|---|---|
| Early selection of combinations. | PI3Ka/TORC1/2 inhibitors (TAK-117/TAK-228), single agents, and combination: preclinical efficacy, clinical safety. | Response surface of growth inhibition translated to clinical. Maximum tolerated exposure curve. | No predicted antitumor effect benefit of the combination once the clinical toxicity interaction between the agents was accounted for. In randomized study NCT02724020 in patients with mRCC, TAK-117/TAK-228 combination did not demonstrate improved efficacy versus TAK-228 single agent or everolimus (54). | R | 53 |
| Axitinib-avelumab combination in mRCC. phase Ib study (N = 53). Historic sunitinib data. | Estimates of cell kill rate and week 8 TSR. | Combination better than sunitinib single agent. Supported go decision. Confirmed in phase III (56). | R | 55 | |
| TGI metrics as exploratory endpoints in early POC or phase II studies. | Phase II or phase III studies with a variety of treatments in patients with RCC. | Week 8 TSR-OS model. Simulation of OS HR vs. effect size on week 8 TSR for an investigational treatment vs. sunitinib. | Quantitative estimates of week 8 TSR effect required to meet target product profile OS HR (e.g., 20% week 8 TSR difference from sunitinib for a 0.80 OS HR). | R | 57 |
| Phase IIb and III trials in mCRPC from the Project Data Sphere. | Estimates of regression and growth rates. Correlation with OS. Resampling of data to mimic small size studies. | Differences in growth rate explain OS benefit. Small study size (<50 patients) achieved >80% power to detect a difference in median growth rate (treatment benefit). | R | 35 | |
| Phase II and III trials of atezolizumab single agent in NSCLC. | Growth rate-OS model. Simulation of OS HR vs. effect size on growth rate for investigational combinations with atezolizumab. | Quantitative estimates of effect on growth required to meet target product profile OS HR: (e.g., 35% decrease in growth rate for a 0.75 OS HR). | R | 58 | |
| Phase III studies with various treatment in ovarian cancer. | CA-125 KELIM-based TGI-OS model. KELIM ratio correlates with PFS and OS HR. | A 59% increase in KELIM would be required to obtain a 50% OS benefit with the addition of a new drug. | R | 21 | |
| Phase III clinical trial simulation and design. | Phase II capecitabine and phase III 5-FU control arm in CRC. | Exposure-driven TGI and week 6 TSR-OS models. | Successful simulation of OS distributions in an independent phase III of capecitabine vs. 5-FU. | R | 36 |
| Phase II motesanib data in NSCLC. | Estimated week 8 TSR. Simulated ongoing phase III of motesanib + chemotherapy using a public-domain week 8 TSR-OS model (29). | Successfully simulated the phase III study HR based on phase II data. | R | 59 | |
| Phase II and III studies of atezolizumab vs. docetaxel in NSCLC. | Growth rate–based TGI-OS model. Difference in growth rate explains OS benefit. Phase III study simulations. | Phase III outcome (OS HR) simulated conditional on tumor dynamic 40 weeks after first patient in based on the phase II TGI-OS model. | R | 46 | |
| Phase I/II durvalumab data in metastatic urothelial carcinoma. | Covariate effects on TGI and tumor dynamic-OS models. Dropout model. | Simulated tumor response and OS in covariate subgroups (by, e.g., tumor burden, liver metastasis, and PD-L1 expression) to inform patient selection, enrichment strategies to optimize trial designs. | R | 32 | |
| Dose rationale | Pembrolizumab phase I and III data in melanoma. | Exposure-tumor dynamic modeling and simulations. | Maximal response for pembrolizumab achieved at 2 mg/kg Q3W. Supported approval of 2 mg/kg in patients with ipilimumab naïve melanoma while the 2 mg/kg dose was investigated in a ipilimumab refractory melanoma patient population. | R | 34 |
| Pembrolizumab phase I data in NSCLC. | Exposure-tumor dynamic-safety modeling and simulations. | Maximal response for pembrolizumab achieved at 2 mg/kg Q3W. Supported approval of 2 mg/kg further confirmed in phase III (61). | R | 60 | |
| Regulatory decisions | Lenvatinib-everolimus combination phase III data in mRCC. | The approved daily dose of 18 mg lenvatinib resulted in high rate of dose modifications due to drug toxicity. Simulated alternative dosing regimen with an exposure-tumor dynamics model. | 14 mg lenvatinib with option of uptitration capable of preserving efficacy (overlapping tumor dynamics) compared with the approved dose, while safety profile could be improved. Confirmatory postmarketing trial ongoing. | P | 62 |
| Postapproval optimization of dosing scheduling to update drug label. | Checkpoint inhibitors phase I, II, and III data in a range of tumor types. | PK and exposure-tumor dynamics modeling and simulations and “exposure-matching” approaches. | Supported label extensions for the use of flat dosing (nivolumab and pembrolizumab) or extensions of dosing interval (Q2W to Q4W for nivolumab, Q3W to Q2W or Q4W for atezolizumab, and Q3W to Q6W for pembrolizumab). | P | 63–66 |
| Vismodegib phase II and III data in locally advanced or metastatic basal cell carcinoma. | High incidence of dose interruptions due to adverse events. PK and exposure-tumor dynamics modeling and simulations. | Simulations showed that up to 8-week vismodegib dosing interruptions would preserve efficacy. The “Dosage and Administration” section of vismodegib label (USPI) was modified accordingly. | P | 67 |
Abbreviations: 5-FU, 5-fluorouracil; mRCC, metastatic renal cell carcinoma; P, prospectively applied to inform decisions; PK, pharmacokinetic; Q2W, every 2 weeks; Q3W, every 3 weeks; Q4W, every 4 weeks; Q6W, every 6 weeks; R, retrospective analysis to support future use of model-based methods; RCC, renal cell carcinoma.
Figure 3 illustrates the link between effect size on TGR (% decrease from control) based on tumor dynamic data and effect size on OS (HR vs. control) simulated using a TGI-OS model based on historic data (58) for a hypothetical investigational combination versus single-agent control. Such simulations support the use of TGR as an exploratory endpoint in early proof-of-concept (POC) or phase II studies. A POC study may be designed to demonstrate (or rule out) the effect on TGR that would meet the desired target profile of the investigational treatment (HR compared with control) providing an alternative to ORR or PFS-based designs. A similar approach has recently been described on the basis of CA-125 KELIM estimate in first-line ovarian cancer (21).
Figure 3.
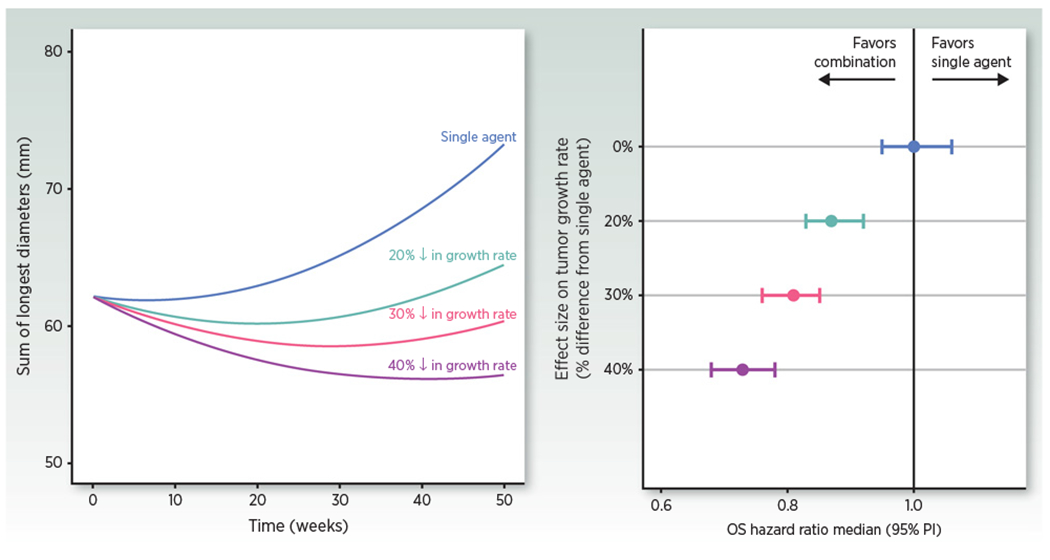
Simulations of typical tumor dynamic profiles following single agent (parameters from ref. 46) or combination with a hypothetical agent that would reduce growth rate by 20%-40% (left) and of the associated expected OS HR in randomized studies of the combination versus single agent as a virtual control (5,000 patients per arm replicated 500 times simulated with the TGI-OS model; ref. 58; right).
Personalized Therapy
Patient-specific mathematical models of glioma growth and invasion have been used to connect changes in tumor dynamics, treatment response, and outcomes (38, 68). Simulations of the models can be used as a virtual control of predicted growth, without treatment or with treatments for which models exist. Using this virtual control as a baseline against which to assess treatment response provides a dynamic measure of treatment response, referred to as “days gained” (69, 70). This novel response metric has been used to identify treatment response that predicts OS even when standard response criteria failed to correlate with outcomes.
Characterizing the association between tumor dynamics and survival can also be relevant to improve patient-level follow-up. While the use of a multivariate model to predict an outcome is not a novel concept and typically relies on patient’s baseline characteristics, predictions can be improved upon by incorporating on-treatment response data from the individual patient. The knowledge of parameter distributions in a historic patient population can be used as “prior information” in a Bayesian setting to improve the prediction of a new individual and to allow identifying early the risk of progression. This prediction can be updated during follow-up when more data become available in an approach, often referred to as “dynamic predictions.” Several methodologic approaches exist for dynamic predictions such as joint models that have been extensively explored in the statistical literature (71). Desmée and colleagues (48, 72) implemented this concept in the context of tumor dynamic models. This approach was also used in the context of immunotherapy with atezolizumab in metastatic urothelial cancer (49). First, the association between tumor size and OS was characterized in a model developed on data from a phase II clinical trial. Both TTG and the instantaneous change in tumor size were the best on-treatment predictors of survival. Using a phase III study validation dataset, ROC analysis determined that the model predicted individual survival probability using 3- or 6-month tumor size follow-up better than a model using only information available at treatment initiation. Including tumor size kinetics in a relevant statistical framework improves the prediction of survival probability during immunotherapy treatment, and may be useful to identify most-at-risk patients in “real-time” allowing the use of patient-level data as it accumulates. An online calculator has recently been proposed to support treatment decisions based on CA-125 kinetics to early identify patients with unfavorable KELIM during first-line platinum-based ovarian cancer chemotherapy (21).
Discussion
Tumor dynamics modeling is a key component to oncology MIDD and has shown a growing number of applications and a broader adoption in the past years to support drug development in a variety of ways. Nevertheless the approach is still in the early days and there is room for more systematic prospective implementation to impact study design (phase II and III) and key decisions (end of phase II or interim phase III before OS is mature at time of PFS read-out) to achieve a transformative impact in drug development. This would entail extensive cross-molecule and cross-institution (academia/industry/regulatory) validation of the approach, similar to what has been done in other therapeutic areas (see ref. 73), to build confidence in using tumor dynamic metrics as coprimary or secondary endpoints and possibly as confirmatory evidence for early registration. The combination of virtual controls and simulations (such as in Fig. 3) provides quantitative estimates of expected effect size that can complement usual power calculations, often based on wishful thinking, to estimate the probability of success of late-stage clinical trials. The newly implemented Pilot Meeting Program for MIDD by FDA (74) should be leveraged to achieve this goal.
Limitations of tumor dynamics modeling need be mentioned and are the subject of active research. The tumor dynamic models developed so far have generally ignored complexities or specific data issues and there are a number of open questions to be addressed moving forward:
Reproducibility and precision (or lack thereof) of tumor size measurements may be have an impact on TGI metrics estimates (75). In that respect, tumor markers, as laboratory measurements when available, have better reproducibility and precision.
In typical clinical trials, only one pretreatment scan (baseline) is available. This precludes any assessment of change in posttreatment growth rate (such as hyper-progression; ref. 76). Comparison of pre- and on-treatment dynamics may allow a more powerful assessment of treatment effect in small cohorts in early exploratory studies of new investigational treatments in patient-level paired comparisons as described in another setting (untreated virtual controls; ref. 69). Similarly the first scan is typically obtained at the end of cycle 2 (6 or 8 weeks), earlier as well as more dense assessments would definitely help modeling the dynamics. In that respect tumor markers’ marker data may be easier to obtain. Optimized sampling designs may be feasible in small exploratory POC studies.
Clinical trial patients may not have any post-baseline tumor assessment (5%–30% of intent-to-treat population depending on the disease) often due to early dropout. The information on tumor dynamics is consequently limited and resulting inferences could be biased as these patients likely have more aggressive disease. These patients need to be accounted for in clinical trial simulations (e.g., ref. 29).
It is not uncommon for tumor metastases in different organs to behave differently. Within-patient between-lesion variability in tumor dynamics has only been investigated in a few studies, albeit using different approaches not necessarily based on tumor dynamics modeling, with conflicting results. In tumor dynamics modeling–based investigations, between-lesions variability was small (or even nonidentifiable) compared with interpatient variability (31, 51, 52). However, in an investigation using a nonparametric machine learning–based approach, lesion dynamics was found to depend on anatomic locations (77). Claret and colleagues (52) found that although between-lesions variability was small, TTG of the fastest progressing lesion best predicted OS. Additional resolution may be obtained by modeling individual lesions dynamics and the clinical relevance of this approach needs to be investigated.
Similarly, the appearance of new lesions as well as nontarget lesion progressions are generally ignored by tumor dynamics modeling and the predictivity of the models may be improved if they account for these competing risk (78). The importance of new lesions depends on their number, their location, and the rate at which they are growing. Finally, signs or symptoms of clinical progression (e.g., weight loss, worsening pain, declining performance status, and worsening ascites) as longitudinal data may be considered to increase the predictive power of the OS models.
The use and benefit of more precise assessment of tumor burden through volumetric assessments are also being actively investigated (17). It is expected that a more precise and sensitive assessment of tumor burden will improve the predictivity of the models, particularly when small cohorts are considered.
In clinical studies, OS can be confounded with postprogression cross-over or use of nonprotocol subsequent therapies. Given that tumor dynamics is typically observed until progression, tumor dynamic models have the potential to predict true (unconfounded) treatment effect for an investigational treatment. However, TGI-OS models could be biased in situations where OS is impacted by subsequent therapies. This issue has to be mitigated on a case by case basis depending on the goal of the modeling and the available data.
Models have most of the time been developed using clinical trial data and there is a need to develop metrics of efficacy that can be successfully applied to real-world data, such as those provided by electronic health records (79).
These limitations notwithstanding, tumor dynamic modeling can be of value to assess the efficacy of new therapeutic modalities like immunotherapy-based dendritic cell vaccination for neoadjuvant chemotherapy in early breast cancer (80) or intratumoral treatments. Assessment of efficacy in terms of individual lesion size reductions is particularly important for the intratumoral administration of oncolytic viruses (81). The changes in lesion size of injected lesions characterize local efficacy, while the changes in noninjected lesions (abscopal effect) characterize systemic efficacy (82), and is an important determinant of clinical benefit in advanced malignancies in which reduction of metastatic, in many cases noninjectable, lesions is key. In addition, in some clinical scenarios, the injected dose is distributed in multiple lesions, which should be considered in the assessment of efficacy and dose–exposure–response analysis.
Applications to personalized therapy based on model-predicted tumor size trajectories are an emerging application that is still being investigated. The joint modeling of tumor dynamics and OS is statistically complex but appealing to perform dynamic predictions of the risk of death and possibly contribute to personalized therapy. Up to now, these models have only considered baseline prognostic factors as covariates. On-treatment patient status (prognostic) is indeed evolving too (e.g., albumin level, inflammatory markers, and cachexia). Future models will have to integrate multiple dynamic markers, as well as, their interplay to provide individualized predictions of the range of likely outcomes due to a modification to treatment parameters such as dose and schedule. Indeed, computer-based optimization of patient outcome considering both tumor size dynamics and safety may in the future be used to inform real-time treatment modifications to deliver the best possible outcomes to patients suffering from cancer.
In conclusion, close collaboration between clinical investigators, pharmacometricians, and statisticians is warranted “to interconnect mathematical models of disease and therapy to advance cancer care” to achieve the full potential of MIDD and model-based personalized therapy (83).
Acknowledgments
The authors are indebted to Mathilde Marchand (Certara Consulting Services), Amit Roy (Bristol-Myers Squibb), and Laurent Claret (Genentech-Roche) for discussions and insights in preparing this article, as well as to Brendan Bender (Genentech-Roche) for helping with Fig. 1. The authors thank the reviewers for their helpful comments that contributed to improve the article. This article is dedicated to Dr. Laurent Claret who passed away from cancer on September 17, 2019. Dr. Claret was a pioneer in tumor dynamic modeling, survival predictions, and simulations of oncology clinical trials.
Footnotes
Disclosure of Potential Conflicts of Interest
R. Bruno is an employee of Roche-Genentech. D. Bottino is an employee of Millennium Pharmaceuticals, a wholly owned subsidiary of Takeda Pharmaceuticals, Inc. D.P. de Alwis is an employee of and holds ownership interest in Merck & Co., Inc. J. Guedj reports receiving other commercial research support from Roche. J. Zheng is an employee of Pfizer. Y. Zheng is an employee of AstraZeneca. J.Y. Jin is an employee of Genentech. No potential conflicts of interest were disclosed by the other authors.
Reprints and Subscriptions To order reprints of this article or to subscribe to the journal, contact the AACR Publications Department at pubs@aacr.org.
References
- 1.Therasse P, Arbuck SG, Eisenhauer EA, Wanders J, Kaplan RS, Rubinstein L, et al. New guidelines to evaluate the response to treatment in solid tumors. European Organization for Research and Treatment of Cancer, National Cancer Institute of the United States, National Cancer Institute of Canada. J Natl Cancer Inst 2000;92:205–16. [DOI] [PubMed] [Google Scholar]
- 2.Michaelis LC, Ratain MJ. Measuring response in a post-RECIST world: from black and white to shades of grey. Nat Rev Cancer 2006;6:409–14. [DOI] [PubMed] [Google Scholar]
- 3.Kola I, Landis J. Can the pharmaceutical industry reduce attrition rates? Nat Rev Drug Discov 2004;3:711–5. [DOI] [PubMed] [Google Scholar]
- 4.Smoragiewicz M, Bogaerts J, Calvo E, Marabelle A, Perrone A, Seymour L, et al. Task force on methodology for the development of innovative cancer therapies. Design and conduct of early clinical studies of immunotherapy agent combinations: recommendations from the task force on methodology for the development of innovative cancer therapies. Ann Oncol 2018;29:2175–82. [DOI] [PubMed] [Google Scholar]
- 5.Seymour L, Bogaerts J, Perrone A, Ford R, Schwartz LH, Mandrekar S, et al. iRECIST: guidelines for response criteria for use in trials testing immunotherapeutics. Lancet Oncol 2017;18:e143–e52. [DOI] [PMC free article] [PubMed] [Google Scholar]
- 6.Hodi FS, Ballinger M, Lyons B, Soria JC, Nishino M, Tabernero J, et al. Immune-modified response evaluation criteria in solid tumors (imRECIST): refining guidelines to assess the clinical benefit of cancer immunotherapy. J Clin Oncol 2018;36:850–58. [DOI] [PubMed] [Google Scholar]
- 7.Sheiner LB. Learning VS confirming in clinical drug development. Clin Pharmacol Ther 1997;61:275–91. [DOI] [PubMed] [Google Scholar]
- 8.Food and Drug Administration Critical Path Initiative white paper: Innovation/Stagnation: Challenge and Opportunity on the Critical Path to New Medical Products, 2004. https://www.who.int/intellectualproperty/documents/en/FDAproposals.pdf.
- 9.U.S. Food and Drug Administration (FDA). PDUFA reauthorization performance goals and procedures fiscal years 2018 through 2022. Available from: https://www.fda.gov/downloads/ForIndustry/UserFees/PrescriptionDrugUserFee/UCM511438.pdf.
- 10.Wang Y, Zhu H, Madabushi R, Liu Q, Huang SM, Zineh I. Model-informed drug development: current US regulatory practice and future considerations. Clin Pharmacol Ther 2019;105:899–911. [DOI] [PubMed] [Google Scholar]
- 11.Bruno R, Jin JY, Maxfield K, Milligan L, Liu C, Wang Y, et al. Proceedings of a workshop: US food and drug administration-international society of pharmacometrics model-informed drug development in oncology. Clin Pharmacol Ther 2019;106:81–3. [DOI] [PubMed] [Google Scholar]
- 12.Manolis E, Rohou S, Hemmings R, Salmonson T, Karlsson M, Milligan PA. The role of modeling and simulation in development and registration of medicinal products: output from the EFPIA/EMA modeling and simulation workshop. CPT Pharmacometrics Syst Pharmacol 2013;2:e31. [DOI] [PMC free article] [PubMed] [Google Scholar]
- 13.EFPIA MID3 Workgroup, Marshall SF, Burghaus R, Cosson V, Cheung SY, Chenel M, et al. Good practices in model-informed drug discovery and development: practice, application, and documentation. CPT Pharmacometrics Syst Pharmacol 2016;5:93–122. [DOI] [PMC free article] [PubMed] [Google Scholar]
- 14.Nayak S, Sander O, Al-Huniti N, de Alwis D, Chain A, Chenel M, et al. Getting innovative therapies faster to patients at the right dose: impact of quantitative pharmacology towards first registration and expanding therapeutic use. Clin Pharmacol Ther. 2018;103:378–83. [DOI] [PMC free article] [PubMed] [Google Scholar]
- 15.Cheson BD, Pfistner B, Juweid ME, Gascoyne RD, Specht L, Horning SJ, et al. Revised response criteria for malignant lymphoma. J Clin Oncol 2007;25:579–86. [DOI] [PubMed] [Google Scholar]
- 16.Chukwueke UN, Wen PY. Use of the response assessment in neuro-oncology (RANO) criteria in clinical trials and clinical practice. CNS Oncol 2019;8:CNS28. [DOI] [PMC free article] [PubMed] [Google Scholar]
- 17.Dercle L, Connors DE, Tang Y, Adam SJ, Gönen M, Hilden P, et al. Vol-PACT: a foundation for the NIH public-private partnership that supports sharing of clinical trial data for the development of improved imaging biomarkers in oncology. JCO Clin Cancer Inform 2018;2:1–12. [DOI] [PMC free article] [PubMed] [Google Scholar]
- 18.Himoto Y, Veeraraghavan H, Zheng J, Zamarin D, Snyder A, Capanu M, et al. Computed tomography–derived radiomic metrics can identify responders to immunotherapy in ovarian cancer. JCO Precision Oncol 2019August15 [Epub ahead of print]. [DOI] [PMC free article] [PubMed] [Google Scholar]
- 19.Stein WD, Gulley JL, Schlom J, Madan RA, Dahut W, Figg WD, et al. Tumor regression and growth rates determined in five intramural NCI prostate cancer trials: the growth rate constant as an indicator of therapeutic efficacy. Clin Cancer Res 2011;17:907–17. [DOI] [PMC free article] [PubMed] [Google Scholar]
- 20.Jonsson F, Ou Y, Claret L, Siegel D, Jagannath S, Vij R, et al. A tumor growth inhibition model based on M-protein levels in subjects with relapsed/refractory multiple myeloma following single-agent carfilzomib use. CPT Pharmacometrics Syst Pharmacol 2015;4:711–9. [DOI] [PMC free article] [PubMed] [Google Scholar]
- 21.Colomban O, Tod M, Leary A, Ray-Coquard I, Lortholary A, Hardy-Bessard AC, et al. Early modeled longitudinal CA-125 kinetics and survival of ovarian cancer patients: a GINECO AGO MRC CTU study. Clin Cancer Res 2019;25:5342–50. [DOI] [PubMed] [Google Scholar]
- 22.Khan KH, Cunningham D, Werner B, Vlachogiannis G, Spiteri I, Heide T, et al. Longitudinal liquid biopsy and mathematical modeling of clonal evolution forecast time to treatment failure in the PROSPECT-C Phase II colorectal cancer clinical trial. Cancer Discov 2018;8:1270–85. [DOI] [PMC free article] [PubMed] [Google Scholar]
- 23.Raja R, Kuziora M, Brohawn PZ, Higgs BW, Gupta A, Dennis PA, et al. Early Reduction in ctDNA predicts survival in patients with lung and bladder cancer treated with durvalumab. Clin Cancer Res 2018;24:6212–22. [DOI] [PubMed] [Google Scholar]
- 24.Bruno R, Mercier F, Claret L. Evaluation of tumor size response metrics to predict survival in oncology clinical trials. Clin Pharmacol Ther 2014;95:386–93. [DOI] [PubMed] [Google Scholar]
- 25.Bender BC, Schindler E, Friberg LE. Population pharmacokinetic-pharmacodynamic modelling in oncology: a tool for predicting clinical response. Br J Clin Pharmacol 2015;79:56–71. [DOI] [PMC free article] [PubMed] [Google Scholar]
- 26.Ribba B, Holford NH, Magni P, Trocóniz I, Gueorguieva I, Girard P, et al. A review of mixed-effects models of tumor growth and effects of anticancer drug treatment used in population analysis. CPT Pharmacometrics Syst Pharmacol 2014;3:e113. [DOI] [PMC free article] [PubMed] [Google Scholar]
- 27.Mould DR, Walz AC, Lave T, Gibbs JP, Frame B. Developing exposure/response models for anticancer drug treatment: special considerations. CPT Pharmacometrics Syst Pharmacol 2015;4:e00016. [DOI] [PMC free article] [PubMed] [Google Scholar]
- 28.Ait-Oudhia S, Mager DE. Array of translational systems pharmacodynamic models of anti-cancer drugs. J Pharmacokinet Pharmacodyn 2016;43:549–65. [DOI] [PubMed] [Google Scholar]
- 29.Wang Y, Sung C, Dartois C, Ramchandani R, Booth BP, Rock E, et al. Elucidation of relationship between tumor size and survival in non-small cell lung cancer patients can aid early decision making in clinical drug development. Clin Pharmacol Ther 2009;86:167–74. [DOI] [PubMed] [Google Scholar]
- 30.Claret L, Gupta M, Han K, Joshi A, Sarapa N, He J, et al. Evaluation of tumor size response metrics to predict overall survival in Western and Chinese patients with first-line metastatic colorectal cancer. J Clin Oncol 2013;31:2110–4. [DOI] [PubMed] [Google Scholar]
- 31.Mistry HB, Helmlinger G, Al-Huniti N, Vishwanathan K, Yates J. Resistance models to EGFR inhibition and chemotherapy in non-small cell lung cancer via analysis of tumour size dynamics. Cancer Chemother Pharmacol 2019;84:51–60. [DOI] [PMC free article] [PubMed] [Google Scholar]
- 32.Zheng Y, Narwal R, Jin C, Baverel PG, Jin X, Gupta A, et al. Population modeling of tumor kinetics and overall survival to identify prognostic and predictive biomarkers of efficacy for durvalumab in patients with urothelial carcinoma. Clin Pharmacol Ther 2018;103:643–52. [DOI] [PMC free article] [PubMed] [Google Scholar]
- 33.Hokanson JA, Brown BW, Thompson JR, Drewinko B, Alexanian R. Tumor growth patterns in multiple myeloma. Cancer 1977;39:1077–84. [DOI] [PubMed] [Google Scholar]
- 34.Chatterjee MS, Elassaiss-Schaap J, Lindauer A, Turner DC, Sostelly A, Freshwater T. Population pharmacokinetic/pharmacodynamic modeling of tumor size dynamics in pembrolizumab-treated advanced melanoma. CPT Pharmacometrics Syst Pharmacol 2017;6:29–39. [DOI] [PMC free article] [PubMed] [Google Scholar]
- 35.Wilkerson J, Abdallah K, Hugh-Jones C, Curt G, Rothenberg M, Simantov R, et al. Estimation of tumour regression and growth rates during treatment in patients with advanced prostate cancer: a retrospective analysis. Lancet Oncol 2017;18:143–54. [DOI] [PubMed] [Google Scholar]
- 36.Claret L, Girard P, Hoff PM, Van Cutsem E, Zuideveld KP, Jorga K, et al. Model-based prediction of phase III overall survival in colorectal cancer on the basis of phase II tumor dynamics. J Clin Oncol 2009;27:4103–8. [DOI] [PubMed] [Google Scholar]
- 37.Tham LS, Wang L, Soo RA, Lee SC, Lee HS, Yong WP, et al. A pharmacodynamic model for the time course of tumor shrinkage by gemcitabine + carboplatin in non-small cell lung cancer patients. Clin Cancer Res 2008;14:4213–8. [DOI] [PubMed] [Google Scholar]
- 38.Ribba B, Kaloshi G, Peyre M, Ricard D, Calvez V, Tod M, et al. A tumor growth inhibition model for low-grade glioma treated with chemotherapy or radiotherapy. Clin Cancer Res 2012;18:5071–80. [DOI] [PubMed] [Google Scholar]
- 39.Frances N, Claret L, Bruno R, Iliadis A. Tumor growth modeling from clinical trials reveals synergistic anticancer effect of the capecitabine and docetaxel combination in metastatic breast cancer. Cancer Chemother Pharmacol 2011;68:1413–9. [DOI] [PubMed] [Google Scholar]
- 40.Wilbaux M, Hénin E, Oza A, Colomban O, Pujade-Lauraine E, Freyer G, et al. Prediction of tumour response induced by chemotherapy using modelling of CA-125 kinetics in recurrent ovarian cancer patients. Br J Cancer 2014;110:1517–24. [DOI] [PMC free article] [PubMed] [Google Scholar]
- 41.Hansson EK, Amantea MA, Westwood P, Milligan PA, Houk BE, French J, et al. PKPD Modeling of VEGF, sVEGFR-2, sVEGFR-3, and sKIT as predictors of tumor dynamics and overall survival following sunitinib treatment in GIST. CPT Pharmacometrics Syst Pharmacol 2013;2:e84. [DOI] [PMC free article] [PubMed] [Google Scholar]
- 42.Ait-Oudhia S, Mager DE, Pokuri V, Tomaszewski G, Groman A, Zagst P, et al. Bridging sunitinib exposure to time-to-tumor progression in hepatocellular carcinoma patients with mathematical modeling of an angiogenic biomarker. CPT Pharmacometrics Syst Pharmacol 2016;5:297–304. [DOI] [PMC free article] [PubMed] [Google Scholar]
- 43.Schindler E, Amantea MA, Karlsson MO, Friberg LE. A pharmacometric framework for axitinib exposure, efficacy, and safety in metastatic renal cell carcinoma patients. CPT Pharmacometrics Syst Pharmacol 2017;6:373–82. [DOI] [PMC free article] [PubMed] [Google Scholar]
- 44.Netterberg I, Li CC, Molinero L, Budha N, Sukumaran S, Stroh M, et al. A PK/PD analysis of circulating biomarkers and their relationship to tumor response in atezolizumab-treated non-small cell lung cancer patients. Clin Pharmacol Ther 2019;105:486–95. [DOI] [PMC free article] [PubMed] [Google Scholar]
- 45.Johnson K, Gomez A, Burton J, White D, Chakravarty A, Schmid A, et al. Directional inconsistency between response evaluation criteria in solid tumors (RECIST) time to progression and response speed and depth. Eur J Cancer 2019;109:196–203. [DOI] [PubMed] [Google Scholar]
- 46.Claret L, Jin JY, Ferté C, Winter H, Girish S, Stroh M, et al. A model of overall survival predicts treatment outcomes with atezolizumab versus chemotherapy in non-small cell lung cancer based on early tumor kinetics. Clin Cancer Res 2018;24:3292–98. [DOI] [PubMed] [Google Scholar]
- 47.Roy A FDA-ISoP public workshop: model informed drug development (MIDD) for oncology products. Silver Spring, MD: FDA. 2018February1; Available from: https://www.fda.gov/Drugs/NewsEvents/ucm589449.htm. [Google Scholar]
- 48.Desmée S, Mentré F, Veyrat-Follet C, Sébastien B, Guedj J. Using the SAEM algorithm for mechanistic joint models characterizing the relationship between nonlinear PSA kinetics and survival in prostate cancer patients. Biometrics 2017;73:305–12. [DOI] [PMC free article] [PubMed] [Google Scholar]
- 49.Tardivon C, Desmée S, Kerioui M, Bruno R, Wu B, Mentré F, et al. Association between tumor size kinetics and survival in urothelial carcinoma patients treated with atezolizumab: implication for patient’s follow-up. Clin Pharmacol Ther 2019April15 [Epub ahead of print]. [DOI] [PubMed] [Google Scholar]
- 50.Bruno R, Mercier F, Claret L. Model-based drug development in oncology: what’s next? Clin Pharmacol Ther 2013;93:303–5. [DOI] [PubMed] [Google Scholar]
- 51.Schindler E, Krishnan SM, Mathijssen R, Ruggiero A, Schiavon G, Friberg LE. Pharmacometric modeling of liver metastases’ diameter, volume, and density and their relation to clinical outcome in imatinib-treated patients with gastrointestinal stromal tumors. CPT Pharmacometrics Syst Pharmacol 2017;6:449–57. [DOI] [PMC free article] [PubMed] [Google Scholar]
- 52.Claret L, Pentafragka C, Karovic S, Zhao B, Schwartz LH, Maitland ML, et al. Comparison of tumor size assessments in tumor growth inhibition-overall survival models with second-line colorectal cancer data from the VELOUR study. Cancer Chemother Pharmacol 2018;82:49–54. [DOI] [PubMed] [Google Scholar]
- 53.Bottino D, Patel M, Kadakia E, Zhou J, Patel C, Neuwirth R, et al. Dose optimization for anticancer drug combinations: maximizing therapeutic index via clinical exposure-toxicity/preclinical exposure-efficacy modeling. Clin Cancer Res 2019;25:6633–43. [DOI] [PubMed] [Google Scholar]
- 54.Choueiri TK, Porta C, Suarez C, Hainsworth J, Voog E, Duran I, et al. Randomised phase 2 study of sapanisertib (TAK-228/MLN0128) ± TAK-117 versus everolimus in patients with VEGF-targeted therapy-refractory metastatic clear cell renal cell carcinoma. In Fourteenth European International Kidney Cancer Symposium; 2019 March 29–30; Dubrovnik, Croatia. [Google Scholar]
- 55.Zheng J FDA-ISoP public workshop: model informed drug development (MIDD) for oncology products. Silver Spring, MD: FDA. 2018February1; Available from: https://www.fda.gov/Drugs/NewsEvents/ucm589449.htm. [Google Scholar]
- 56.Motzer RJ, Penkov K, Haanen J, Rini B, Albiges L, Campbell MT, et al. Avelumab plus axitinib versus sunitinib for advanced renal-cell carcinoma. N Engl J Med 2019;380:1103–15. [DOI] [PMC free article] [PubMed] [Google Scholar]
- 57.Claret L, Mercier F, Houk BE, Milligan PA, Bruno R. Modeling and simulations relating overall survival to tumor growth inhibition in renal cell carcinoma patients. Cancer Chemother Pharmacol 2015;76:567–73. [DOI] [PubMed] [Google Scholar]
- 58.Bruno R, Claret L, Jin YJ, Girish S. Applications of tumor growth inhibition-overall survival models to support atezolizumab combination studies. FDA-ISoP public workshop: model informed drug development (MIDD) for oncology products. Silver Spring, MD: FDA. 2018February1; Available from: https://www.fda.gov/Drugs/NewsEvents/ucm589449.htm. [Google Scholar]
- 59.Claret L, Lu JF, Bruno R, Hsu CP, Hei YJ, Sun YN. Simulations using a drug-disease modeling framework and phase II data predict phase III survival outcome in first-line non-small-cell lung cancer. Clin Pharmacol Ther 2012;92:631–4. [DOI] [PubMed] [Google Scholar]
- 60.Chatterjee M, Turner DC, Felip E, Lena H, Cappuzzo F, Horn L, et al. Systematic evaluation of pembrolizumab dosing in patients with advanced non-small-cell lung cancer. Ann Oncol 2016;27:1291–8. [DOI] [PMC free article] [PubMed] [Google Scholar]
- 61.Herbst RS, Baas P, Kim DW, Felip E, Pérez-Gracia JL, Han JY, et al. Pembrolizumab versus docetaxel for previously treated, PD-L1-positive, advanced [ISP CHK]non-small-cell lung cancer (KEYNOTE-010): a randomised controlled trial. Lancet 2016;387:1540–50. [DOI] [PubMed] [Google Scholar]
- 62.Liu C FDA-ISoP public workshop: model informed drug development (MIDD) for oncology products. Silver Spring, MD: FDA. 2018February1; Available from: https://www.fda.gov/Drugs/NewsEvents/ucm589449.htm. [Google Scholar]
- 63.Zhao X, Suryawanshi S, Hruska M, Feng Y, Wang X, Shen J, et al. Assessment of nivolumab benefit-risk profile of a 240-mg flat dose relative to a 3-mg/kg dosing regimen in patients with advanced tumors. Ann Oncol 2017;28:2002–8. [DOI] [PMC free article] [PubMed] [Google Scholar]
- 64.Freshwater T, Kondic A, Ahamadi M, Li CH, de Greef R, de Alwis D, et al. Evaluation of dosing strategy for pembrolizumab for oncology indications. J Immunother Cancer 2017;5:43. [DOI] [PMC free article] [PubMed] [Google Scholar]
- 65.Bi Y, Liu J, Furmanski B, Zhao H, Yu J, Osgood C, et al. Model-informed drug development approach supporting approval of the 4-week (Q4W) dosing schedule for nivolumab (Opdivo) across multiple indications: a regulatory perspective. Ann Oncol 2019;30:644–51. [DOI] [PubMed] [Google Scholar]
- 66.Morrissey KM, Marchand M, Patel H, Zhang R, Wu B, Chan HP, et al. Alternative dosing regimens for atezolizumab: an example of model-informed drug development in the postmarketing setting. Cancer Chemother Pharmacol 2019;84:1257–67. [DOI] [PMC free article] [PubMed] [Google Scholar]
- 67.Chanu P, Musib L, Wang X, Cheeti S, Lu T, Girish S, et al. Modifying “dosage and administration” section of vismodegib label (USPI) based on modeling & simulation. In American Conference on Pharmacometrics: ACoP 9; 2018 Oct 8–10; San Diego, CA. [Google Scholar]
- 68.Wang CH, Rockhill JK, Mrugala M, Peacock DL, Lai A, Jusenius K, et al. Prognostic significance of growth kinetics in newly diagnosed glioblastomas revealed by combining serial imaging with a novel biomathematical model. Cancer Res 2009;69:9133–40. [DOI] [PMC free article] [PubMed] [Google Scholar]
- 69.Neal ML, Trister AD, Cloke T, Sodt R, Ahn S, Baldock AL, et al. Discriminating survival outcomes in patients with glioblastoma using a simulation-based, patient-specific response metric. PLoS One 2013;8:e51951. [DOI] [PMC free article] [PubMed] [Google Scholar]
- 70.Neal ML, Trister AD, Ahn S, Baldock AL, Bridge CA, Guyman L, et al. Response classification based on a minimal model of glioblastoma growth is prognostic for clinical outcomes and distinguishes progression from pseudoprogression. Cancer Res 2013;73:2976–86. [DOI] [PMC free article] [PubMed] [Google Scholar]
- 71.Rizopoulos D Joint models for longitudinal and time-to-event data: with applications in R. Chapman and Hall-CRC Biostatistics Series. London, New York: CRC Press, Taylor & Francis Group, Boca Raton, 2012. [Google Scholar]
- 72.Desmée S, Mentré F, Veyrat-Follet C, Sébastien B, Guedj J. Nonlinear joint models for individual dynamic prediction of risk of death using Hamiltonian Monte Carlo: application to metastatic prostate cancer. BMC Med Res Methodol 2017;17:105. [DOI] [PMC free article] [PubMed] [Google Scholar]
- 73.Arnerić SP, Kern VD, Stephenson DT. Regulatory-accepted drug development tools are needed to accelerate innovative CNS disease treatments. Biochem Pharmacol 2018;151:291–306. [DOI] [PubMed] [Google Scholar]
- 74.US Food and Drug Administration (FDA). Pilot meetings program for modelinformed drug development approaches. Fed Reg 2018;83:16868–70. [Google Scholar]
- 75.Li CH, Bies RR, Wang Y, Sharma MR, Karovic S, Werk L, et al. Comparative effects of CT Imaging measurement on RECIST end points and tumor growth kinetics modeling. Clin Transl Sci 2016;9:43–50. [DOI] [PMC free article] [PubMed] [Google Scholar]
- 76.Champiat S, Dercle L, Ammari S, Massard C, Hollebecque A, Postel-Vinay S, et al. Hyperprogressive disease is a new pattern of progression in cancer patients treated by anti-PD-1/PD-L1. Clin Cancer Res 2017;23:1920–8. [DOI] [PubMed] [Google Scholar]
- 77.Terranova N, Girard P, Ioannou K, Klinkhardt U, Munafo A. Assessing similarity among individual tumor size lesion dynamics: the CICIL methodology. CPT Pharmacometrics Syst Pharmacol 2018;7:228–36. [DOI] [PMC free article] [PubMed] [Google Scholar]
- 78.Zecchin C, Gueorguieva I, Enas NH, Friberg LE. Models for change in tumour size, appearance of new lesions and survival probability in patients with advanced epithelial ovarian cancer. Br J Clin Pharmacol 2016;82:717–27. [DOI] [PMC free article] [PubMed] [Google Scholar]
- 79.Griffith SD, Tucker M, Bowser B, Calkins G, Chang CJ, Guardino E, et al. Generating real-world tumor burden endpoints from electronic health record data: comparison of RECIST, radiology-anchored, and clinician-anchored approaches for abstracting real-world progression in non-small cell lung cancer. Adv Ther 2019;36:2122–36. [DOI] [PMC free article] [PubMed] [Google Scholar]
- 80.Solans BP, LópezDíaz de Cerio A, Elizalde A, Pina LJ, Inogés S, Espinís J, et al. Assessing the impact of the addition of dendritic cell vaccination to neoadjuvant chemotherapy in breast cancer patients: a modelbased characterization approach. Br J Clin Pharmacol 2019;85:1670–83. [DOI] [PMC free article] [PubMed] [Google Scholar]
- 81.Aznar MA, Tinari N, Rullán AJ, Sánchez-Paulete AR, Rodriguez-Ruiz ME, Melero I. Intratumoral delivery of immunotherapy-act locally, think globally. J Immunol 2017;198:31–9. [DOI] [PubMed] [Google Scholar]
- 82.Frank MJ, Reagan PM, Bartlett NL, Gordon LI, Friedberg JW, Czerwinski DK. In situ vaccination with a TLR9 agonist and local low-dose radiation induces systemic responses in untreated indolent lymphoma. Cancer Discov 2018;8:1258–69. [DOI] [PMC free article] [PubMed] [Google Scholar]
- 83.Maitland ML, O’Cearbhaill RE, Gobburu J. Cancer clinical investigators should converge with pharmacometricians. Clin Cancer Res 2019;25:5182–4. [DOI] [PMC free article] [PubMed] [Google Scholar]