Abstract
Many rare syndromes can be well described and delineated from other disorders by a combination of characteristic symptoms. These phenotypic features are best documented with terms of the Human Phenotype Ontology (HPO), which are increasingly used in electronic health records (EHRs), too. Many algorithms that perform HPO-based gene prioritization have also been developed; however, the performance of many such tools suffers from an over-representation of atypical cases in the medical literature. This is certainly the case if the algorithm cannot handle features that occur with reduced frequency in a disorder. With Cada, we built a knowledge graph based on both case annotations and disorder annotations. Using network representation learning, we achieve gene prioritization by link prediction. Our results suggest that Cada exhibits superior performance particularly for patients that present with the pathognomonic findings of a disease. Additionally, information about the frequency of occurrence of a feature can readily be incorporated, when available. Crucial in the design of our approach is the use of the growing amount of phenotype–genotype information that diagnostic labs deposit in databases such as ClinVar. By this means, Cada is an ideal reference tool for differential diagnostics in rare disorders that can also be updated regularly.
INTRODUCTION
Deep phenotyping of patients with suspected rare genetic disorders by HPO terminology has become the de facto standard and is the prerequisite for several algorithms that prioritize potential disease genes (1–12). A general review of the diagnosis methods for rare diseases was done by Schaaf et al. (13). Since most of the current approaches are still heavily based on disease annotations and not case annotations, many of these tools have become a victim of their own success if they do not take into consideration how frequently a clinical feature occurs: an entry in OMIM evolves over time and accumulates also clinical features that occur rarely. A novel disease-gene-association for a monogenic disorder usually requires three or more unrelated patients with a similar phenotype and mutations in the same gene for a publication in a peer-reviewed journal. After this initial report, often a follow-up study is published a few months or years later that delineates additional clinical features of patients with a disease-causing mutation in the same gene. Ideally, such a paper distinguishes between cardinal symptoms of the disorder and those that occur less frequently. Additional case reports are usually just published for patients with an atypical presentation, while most characteristic cases will rather be submitted to databases such as ClinVar (14).
In early algorithms for semantic similarity searches, such as the Phenomizer, the specificity of a term is reflected by its information content (IC). IC is defined as the negative natural logarithm of the frequency a term has been used to annotate different diseases (3). This approach, however, results in comparable similarity scores for a disease, no matter whether a patient presents with the two pathognomonic findings present in almost all individuals with this disease, or two rarely occurring features of similar IC.
From 2019, the HPO project also adds metadata to disease annotations, which includes the frequency of a clinical feature within a specific disease; however, these data, especially on the gene annotation level, is still highly incomplete and inconsistent in its methodology. Nevertheless, gene prioritization algorithms stand to benefit significantly from this information and should be ready to include such frequency data, as it is further improved in the future (15).
Shen et al. (16) showed that graph embeddings of HPO worked well for comparing phenotypes. We extend this approach to also include Case Annotations, as well as Disease Annotations (Cada). With this, we obtain a graph which can be embedded to perform gene prioritization. Compared to previous methods, this graph based approach has the advantage of being weighable with frequency information.
MATERIALS AND METHODS
Human Phenotype Ontology
The Human Phenotype Ontology (h) provides a standardized and controlled vocabulary of human phenotypic abnormalities. In Hpo, phenotypic terms are arranged in a directed acyclic graph (DAG) and are related to their parent terms by ‘is_a’ relationships. In our study, we used the HPO released on 27 March 2020, containing 14 586 human phenotypic terms and 18 416 hierarchical relationships between these terms.
Genotype–phenotype annotations
The Hpo team also provides an annotation file that provides links between related genes and Hpo terms. This mapping is based on data mining of resources such as OMIM, Orphanet and DECIPHER. The annotations follow the true-path rule: genes associated with a specific Hpo term are also associated with all its parent terms in HPO. In detail, 4315 disease-causing genes and 169 281 unique gene-Hpo term associations are included in our study.
ClinVar
ClinVar is a public database that archives clinical reports about the effect of genetic variants on the human phenotype. A ClinVar submission consists of a variant, a condition, for which the variant was interpreted, and an assertion of the clinical significance, as well as additional supporting evidence. (14). An increasing number of submitters also add HPO terms as such supporting evidence, or if the disease is not known as associated conditions.
Clinical cases
In total, we compiled 4714 clinical cases with a molecularly confirmed diagnosis representing 1350 different disease genes. Each case consists of a causal gene and phenotypic features, which could also easily be reformated into a Phenopacket (15). A total of 2137 of these cases were extracted from electronic patient records of our clinical collaborators. A total of 2577 cases were generated from suitable ClinVar submissions. That is, variants that were classified as ‘pathogenic’ or ‘likely pathogenic’, and associated with HPO terms. Additionally, since ClinVar submissions are variant-based instead of case-based, we merged variants in recessive genes from the same submitter that were characterized by the same phenotypic features assuming compound heterozygosity.
Encoding the data
Comparing nominal data is difficult as there is no mathematical basis to predict similarity. For many problems in the past, embedding the data into a vector space has proven as a good way to allow for statistical computation on nominal data (17). For the purpose to measure the similarity between phenotypes and genes, we embedded the nominal data encoded in Hpo and the associated gene for each phenotype. There are several methods of embedding an ontology into a vector space; however, it is worth noting that Hpo only utilizes one type of edge and therefore can also be read as a simple graph, with edge pairs instead of triples. Shen et al. (16) showed that this approach worked well for embedding Hpo.
As opposed to Shen et al., we also add in gene–phenotype associations and obtain a graph G with two types of nodes. VP, the set of phenotypes present in Hpo and VG, the set of disease-causing genes. There are two sets of edges in the graph, phenotype to phenotype edges EPP⊆{(p1, p2)|p1, p2 ∈ VP} and phenotype to gene edges EPG⊆{(p, g)|p ∈ VP, g ∈ VG}. So the Graph encoding all relationships is G = (VP∪VG, EPP∪EPG).
With this definition, we are now able to read in a case C, which usually consists of a list of phenotypes PC⊂VP and the diagnosed disease causing gene gC ∈ VG as a set of edges EC = {(p, gC)|p ∈ PC}. Easily allowing us to extend our graph G by the information present in the case (see Figure 1).
Figure 1.
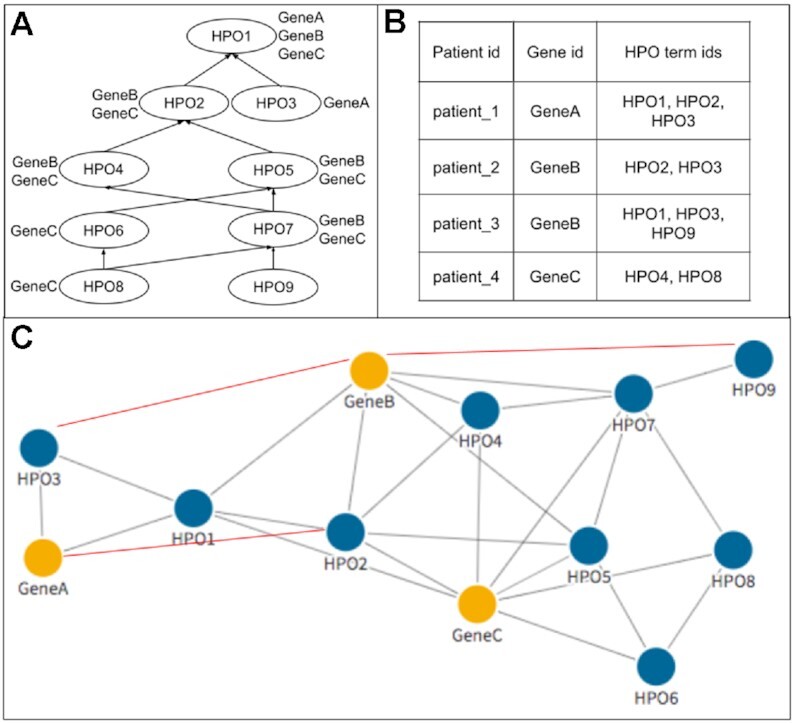
General workflow of encoding the data into the graphs. Panel (A) shows the DAG structure and gene–phenotype annotations, including those appearing due to the true-path rule, from HPO. These data were converted into G0, represented by the nodes and gray edges in (C). The network was then further extended by data from clinical cases in (B), represented by red edges. For example, patient_3 is cause for a new edge between GeneB and HPO9.
Embedding the data into a vector space
With the data represented as a graph, G0, we used Node2Vec to create the vector space embedding (18). For this purpose, Node2Vec first starts (weighted) random walks on the graph G0 from each of the nodes. These random walks are interpreted as words that can be embedded into an Euclidean space using a SkipGram neural network, which is an essential part of the Word2Vec method (17). More specifically, we aim to maximize the probability of a node  ’s context R within a contextual window of length c:
 |
(1) |
Here ri denotes the i-th word (i.e. node sequence) generated by a random walk. p(rj∣ri) is the output of the SkipGram neural network that is defined with a softmax function
 |
where  are vector representations of words ri and rj in the hidden layer. Notably, the SkipGram neural network is trained with one-hot vector encoding of word pairs as input. The network aims for learning the probability of observing word rj in the context (i.e. in the ‘neighborhood’) of ri by maximizing ∑
 L(
L( ) over all nodes
  in the graph G0. We refer to (17) for more details about SkipGram.
To train the Node2Vec model, we split the 4714 patients into a training, validation and test sets with the ratios 60%, 20% and 20%. Hence, the training, validation and test set has 2828, 943 and 943 cases, respectively. Note that G0 does not contain any case data initially. The graph is only constructed from the hierarchical relationships of HPO terms and the gene–phenotype annotations in HPO. Later, additional genotype–phenotype associations from the training cases were added gradually into G0. We will denote with e.g. Gp that  of the training cases were added into the graph. The Node2Vec model was trained on G0, G25, G75 and G100, where hyperparameter optimization was performed for each of them using the validation set. The Optuna (19) library was used for a Bayesian hyperparameter optimization. A detailed list of tuned hyperparameters can be found in the Supplementary Data.
Using Edge Confidences
In principle, each gene-to-phenotype association could be weighted by its absolute or relative frequency of occurrence. This can be implemented by a weighting function  : EPG → [0, x]. If x ≤ 1, the weight represents the probability that a certain clinical feature occurs in a patient with a certain genetic disorder (relative phenotype prevalence). If x > 1, the weight represents the number of patients with a certain genetic disorder that have been observed to exhibit a certain feature (absolute phenotype prevalence). Since relative phenotype prevalences for patients with a certain genetic disorder are typically unknown on the population level, we here tested the later weighting scheme (i.e. counting number of cases) (20). However, we would like to point out that our approach is flexible enough to also incorporate a relative phenotype prevalence scheme. Accordingly, for a given node
  the probability to reach any direct neighbor q during a one-step random walk is then
 |
where N( ) denotes the neigborhood of node
  and
and  vq the weight of the edge (
 , q).
, q).
Link prediction
Node2Vec learns a function  that embeds nodes into a vector space. The problem of causal gene prioritization can be interpreted as a link prediction task between phenotype and gene nodes. This can be achieved by measuring the similarity of putative disease genes to phenotypes in the vector space via the dot product. Hence, for any new case C with a set of phenotypes PC⊂VP, a ranking of genes g can be achieved via:
 |
Therefore, we can rank genes for each case and compute a topN accuracy for the test set. TopN accuracy rates are the most common metrics to evaluate gene prioritization tools, which are defined by the proportion of testing cases where the correct disease-causing gene is within the topN prioritized genes. Specifically, top 1, top 5, top 10, top 50 and top 100 were used in our study as the evaluation metrics.
RESULTS
Robustness of the randomized aspects
As the embedding method is based on random walks, the graph embeddings obtained from Node2Vec will be slightly different each time they are created. Therefore, each experiment was repeated with 10 different embeddings obtained from the same graph. Results comparing topN accuracies are average results of these 10 embeddings and have error margins (signified by error bars in figures) associated with them. However, the error margins for this method were vanishingly small and around 1% for each topN accuracy. This shows that the method, despite its randomization, is highly robust.
Effects of adding case data
Even without using our weighting scheme, adding the case data into our graph G0 before the embedding improves topN accuracy significantly for validation cases (Figure 2). The model from unweighted G100 achieves the best validation results. A detailed table of validation accuracy across five graph structure can be found in the Supplementary Data.
Figure 2.
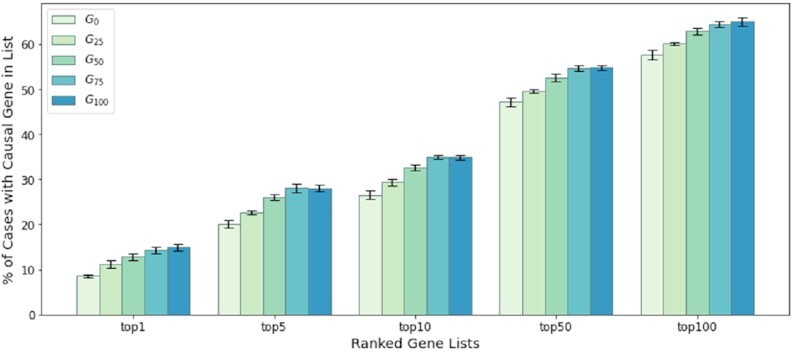
Validation accuracy with standard errors during the graph extension. The initial graph G0 was only based on HPO-term hierarchical relationships and gene–phenotype annotations from HPO. G25, G50, G75, G100 indicate graph structures that include 25%, 50%, 75% and 100% of the additional case data of the training set. The standard errors are computed from 10 repeated embeddings per graph.
Similarly, the weighted graph models were also validated through the same approach, among which the weighted G100 model achieves the best validation results. To test the performance of unweighted and weighted models, we evaluated the G0, unweighted G100 and weighted G100 models with the testing set of 943 patients. Figure 3 shows that all topN accuracy rates improve around 7–10% by introducing new associations from case annotations. Moreover, by adding the very simple weighting scheme we propose, the results further improve 3–4%.
Figure 3.
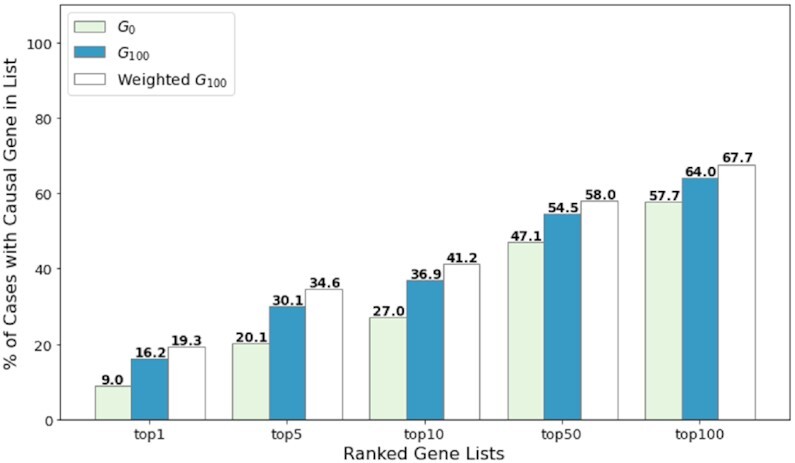
Performance comparison of unweighted and weighted models. The performance of unweighted G0, G100 and weighted G100 models was assessed on 943 testing patients by topN accuracy metrics.
Generalization to independent data sets
In order to test how well Cada generalizes to before unseen data, we applied the model from the unweighted G100 to the largest data set (Set 4) provided by the Phen2Gene study (4). Five cases were removed from the data set, as their provided files do not contain any phenotype information. Nine other cases were further removed, as the disease-causing genes were not known to Cada, and which were used to test Phen2Gene’s discovery capabilities. In the end, the data set we tested on contains 142 cases with 66 unique disease-causing genes. As seen in Figure 4, Cada has comparable results on this before unseen data set. Whilst a direct comparison is not possible due to the removed cases, Cada generally outperforms Phen2Gene on this data set (Phen2Gene reports 32.1 and 47.4 for top 10 and top 50 accuracy, respectively).
Figure 4.
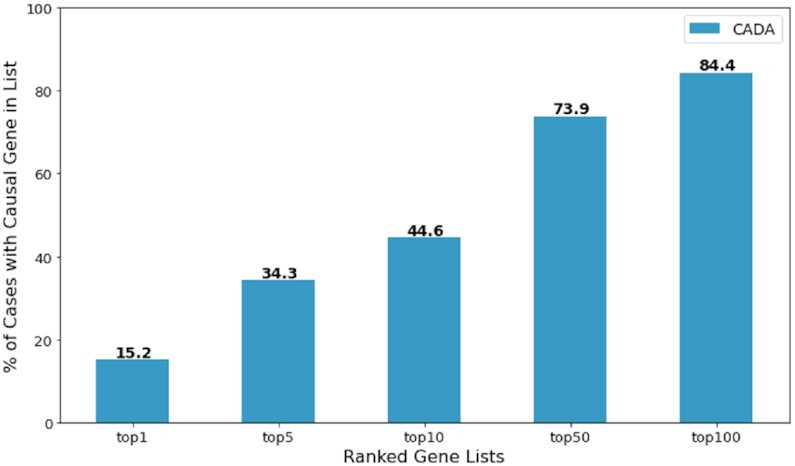
Cada’s topN accuracy on a independent data set from Phen2Gene test set 4.
Comparison to other methods
Since the weighting scheme is purely heuristic, we used the model trained from unweighted G100 as the final model to compare with other gene prioritization tools on our test data. The test set contains 943 cases with 529 unique disease-causing genes. However, the restrictions some of the other tools have made a direct comparison difficult. Gado (7), for instance, can only handle a subset of the phenotypes present in HPO. Thus, it was unable to recognize phenotypic features for around 200 of our test cases. AMELIE requires a pre-selected list of at most 1000 genes to prioritize, representing less than one-fourth of the 4315 known disease-causing genes we collected. Only Phen2Gene had directly comparable capabilities to Cada. Therefore, we compared our model to Phen2Gene and where phenotypes and a list of 1000 pre-selected genes from all known disease-causing genes in HPO were provided (Figure 5A). The target casual gene was guaranteed to be included in the provided gene list and the rest are selected uniformly at random. Additionally, we compared Cada to Phen2Gene, where only phenotypes were provided (Figure 5B).
Figure 5.
Performance comparison on testing patients to other prioritization tools. (A) Based on phenotypes and a pre-selected 1000 gene list, Cada was compared with AMELIE and Phen2Gene. (B) Based on phenotypes alone, Cada was compared with Phen2Gene.
The comparison tests show that Cada outperforms the other tools even with the unweighted setup under both tasks on our test cases. With further improvements when adding in our experimental weighting scheme, the advantage of Cada will be more noticeable. However, Phen2Gene also has further capabilities of identifying potential new disease causing genes. Whilst this would not affect performance in the setup, where a list of 1000 genes was given, it will make the prioritization task naturally harder for Phen2Gene in the general setup without providing any candidate gene.
Performance comparison for gene frequency groups
To further study how the frequency of a gene affects its performance by our model, disease-causing genes in case annotations were classified into three groups based on their frequencies in our case data: high-frequency (frequency ≥ 20), medium-frequency (5 ≤ frequency ≤ 19) and low-frequency (frequency ≤ 4).
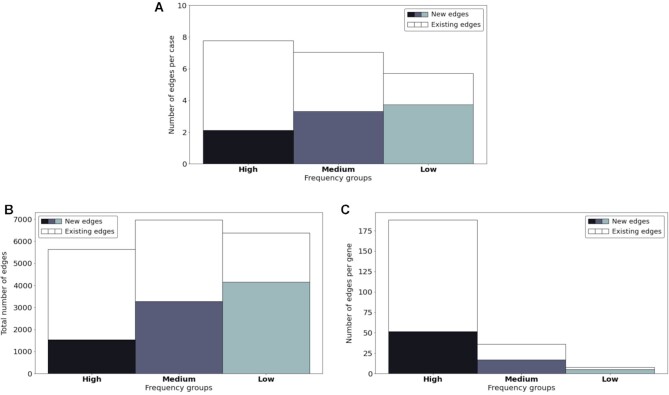
In total, the 2828 training cases cover 1033 different disease-causing genes. The number of genes in the above-defined three frequency groups and their corresponding case numbers among these training cases are shown in Table 1. For the graph extension process, Figure 6A presents the overall distribution of introduced associations from the training set among the three frequency groups. Divided by the number of training cases and genes in Table 1, the overall distribution was converted to the average distribution of a case (Figure 6B) and a gene (Figure 6C) within the three frequency groups.
Table 1.
The sum of genes and cases within the three frequency groups in the training set
| Gene frequency groups | Number of genes | Number of training cases |
|---|---|---|
| High | 30 | 725 |
| Medium | 193 | 988 |
| Low | 810 | 1115 |
Figure 6.
Introduced associations within the three frequency groups. (A) The overall distribution of introduced associations. (B) The average distribution of introduced associations per case. (C) The average distribution of introduced associations per gene.
The performance of test patients was also evaluated accordingly within the above-mentioned groups before and after the graph extension. As illustrated in Figure 7, the bars show the accuracy of the G100 model with white markers indicating the one from the G0 model. The significant improvement for genes in the high frequency group might result from the forming of abundant new edges on them during the process, as shown in Figure 6C.
Figure 7.
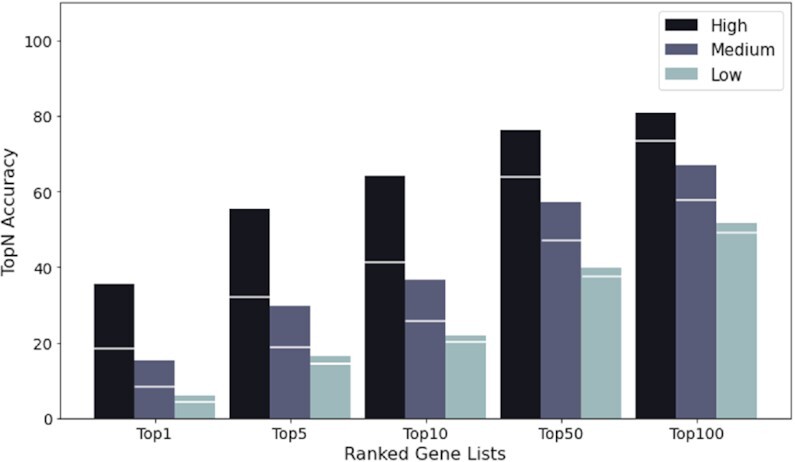
Performance improvement of the three frequency groups during the graph extension. The bars show the accuracy of the G100 model with white markers indicating the accuracy of the G0 model.
DISCUSSION
Cada’s underlying design is highly modular. The graph structure is created independently from its embedding strategy as well as the prioritization computation. Therefore, it is possible to improve single modules of Cada, easily improving the total performance. We will discuss in the following, how some of these improvements might look.
As genotype–phenotype knowledge databases such as ClinVar grow steadily, new case data can be easily and regularly incorporated into the graph. Even if the data set contains a small fraction of incorrect gene–phenotype edges, our results still show that the overall submission quality is high enough to improve Cada’s prioritization ability. A comparison with case data that has been curated from the literature indicates that the distribution of the number HPO-terms used per patient is comparable (21). Furthermore, with updates to HPO, Cada is also expected to cover a larger range of disease-causing genes in the future.
Whilst already obtaining comparable results to current tools without weighting the graph, the potential of weighting edges with frequency information is an advantage of this graph-based approach. Even with a very simple heuristic weighting scheme, we were able to improve results significantly. With Hpo currently working on adding frequency information to their database and resources like Orphanet conducting research into frequencies there is high potential for improving this method with a more sophisticated weighting scheme.
Another promising avenue is the rapidly developing field of graph embeddings. Node2Vec was the current most suitable embedding tool we used; however, this is a rapidly evolving field, as it has many applications even far beyond medical research. With the current setup for Cada the graph embedding tool can easily be replaced in the future if more promising tools are published.
Robinson, et al. recently introduced a framework for estimating posttest probabilities based on likelihood ratios for genotype–phenotype data (22). By this means, the contribution of each phenotypic feature to a suggested diagnosis can be computed, which is particularly helpful for the clinical interpretation of the results. While LIRICAL is working by default with disease prevalences as pretest probability, it has also been suggested that other priors e.g. the output of Cada, could be used to refine the output.
In future research we would like to extend the underlying Graph used by Cada with gene–gene links to allow for discovery capabilities similar to Phen2Gene.
The code for Cada, can be found here https://github.com/Chengyao-Peng/CADA. This code can be used to process a single case in seconds on a regular laptop via commandline, allowing for large scale reprocessing of cases.
Furthermore, we’re making this tool available to anyone via a web interface at https://cada.gene-talk.de/webservice/. This version will be updated with new ClinVar cases on a regular basis, and is therefore expected to improve over time.
DATA AVAILABILITY
The Data used in this paper can be found at https://github.com/Chengyao-Peng/CADA.
Supplementary Material
Contributor Information
Chengyao Peng, Institute for Genomic Statistics, University Bonn, 53129 Bonn, Germany.
Simon Dieck, Institute for Genomic Statistics, University Bonn, 53129 Bonn, Germany.
Alexander Schmid, Institute for Genomic Statistics, University Bonn, 53129 Bonn, Germany.
Ashar Ahmad, Fraunhofer SCAI, Department of Bioinformatics, 53757 Sankt Augustin, Germany.
Alexej Knaus, Institute for Genomic Statistics, University Bonn, 53129 Bonn, Germany.
Maren Wenzel, Genetikum Counseling Center, 70173 Stuttgart, Germany.
Laura Mehnert, Genetikum Counseling Center, 70173 Stuttgart, Germany.
Birgit Zirn, Genetikum Counseling Center, 70173 Stuttgart, Germany.
Tobias Haack, Institute of Medical Genetics and Applied Genomics, University Tübingen, 72076 Tübingen, Germany.
Stephan Ossowski, Institute of Medical Genetics and Applied Genomics, University Tübingen, 72076 Tübingen, Germany.
Matias Wagner, Institute for Human Genetics, Technical University Munich, 81675 Munich, Germany.
Theresa Brunet, Institute for Human Genetics, Technical University Munich, 81675 Munich, Germany.
Nadja Ehmke, Institute for Medical Genetics, Charité University Medicine, 13353 Berlin, Germany.
Magdalena Danyel, Institute for Medical Genetics, Charité University Medicine, 13353 Berlin, Germany.
Stanislav Rosnev, GeneTalk GmbH, 53129 Bonn, Germany.
Tom Kamphans, GeneTalk GmbH, 53129 Bonn, Germany.
Guy Nadav, FDNA Inc, FL 33325 Sunrise, USA.
Nicole Fleischer, FDNA Inc, FL 33325 Sunrise, USA.
Holger Fröhlich, Fraunhofer SCAI, Department of Bioinformatics, 53757 Sankt Augustin, Germany; Bonn-Aachen International Center for IT, University Bonn, 53115 Bonn, Germany.
SUPPLEMENTARY DATA
Supplementary Data are available at NARGAB Online.
FUNDING
Institutionally funded.
Conflict of interest statement. None declared.
REFERENCES
- 1.Köhler S., Doelken S.C., Mungall C.J., Bauer S., Firth H.V., Bailleul-Forestier I., Black G.CM., Brown D.L., Brudno M., Campbell J.et al.. The Human Phenotype Ontology project: linking molecular biology and disease through phenotype data. Nucleic Acid Res. 2014; 42:966–974. [DOI] [PMC free article] [PubMed] [Google Scholar]
- 2.Yang H., Robinson P.N., Wang K.. Phenolyzer: phenotype-based prioritization of candidate genes for human diseases. Nat. Methods. 2015; 12:841–843. [DOI] [PMC free article] [PubMed] [Google Scholar]
- 3.Köhler S., Schulz M.H., Krawitz P., Bauer S., Dölken S., Ott C.E., Mundlos C., Horn D., Mundlos S., Robinson P.N.. Clinical diagnostics in human genetics with semantic similarity searches in ontologies. Am. J. Hum. Genet. 2009; 85:457–464. [DOI] [PMC free article] [PubMed] [Google Scholar]
- 4.Zhao M., Havrilla J.M., Fang L., Chen Y., Peng J., Liu C., Wu C., Sarmady M., Botas P., Isla J.et al.. Phen2Gene: rapid phenotype-driven gene prioritization for rare diseases. NAR Genomics Bioinform. 2020; 2:lqaa032. [DOI] [PMC free article] [PubMed] [Google Scholar]
- 5.Birgmeier J., Haeussler M., Deisseroth C.A., Steinberg E.H., Jagadeesh K.A., Ratner A.J., Guturu H., Wenger A.M., Diekhans M.E., Stenson P.D.et al.. AMELIE speeds Mendelian diagnosis by matching patient phenotype and genotype to primary literature. Sci. Transl. Med. 2020; 12:544. [DOI] [PMC free article] [PubMed] [Google Scholar]
- 6.Singleton M.V., Guthery S.L., Voelkerding K.V., Chen K., Kennedy B., Margraf R.L., Durtschi J., Eilbeck K., Reese M.G., Jorde L.B.et al.. Phevor combines multiple biomedical ontologies for accurate identification of disease-causing alleles in single individuals and small nuclear families. Am. J. Hum. Genet. 2014; 94:599–610. [DOI] [PMC free article] [PubMed] [Google Scholar]
- 7.Deelen P., van Dam S., Herkert J.C., Karjalainen J.M., Brugge H., Abbott K.M., van Diemen C.C., van der Zwaag P.A., Gerkes E.H., Zonneveld-Huijssoon E.et al.. Improving the diagnostic yield of exome- sequencing by predicting gene-phenotype associations using large-scale gene expression analysis. Nat. Commun. 2019; 10:2837. [DOI] [PMC free article] [PubMed] [Google Scholar]
- 8.Stelzer G., Plaschkes I., Oz-Levi D., Alkelai A., Olender T., Zimmerman S., Twik M., Belinky F., Fishilevich S., Nudel R.et al.. VarElect: the phenotype-based variation prioritizer of the GeneCards Suite. BMC Genomics. 2016; 17:444. [DOI] [PMC free article] [PubMed] [Google Scholar]
- 9.Javed A., Agrawal S., Ng P.C.. Phen-Gen: combining phenotype and genotype to analyze rare disorders. Nat. Meth. 2014; 11:935–937. [DOI] [PubMed] [Google Scholar]
- 10.Boudellioua I., Kulmanov M., Schofield P.N., Gkoutos G.V., Hoehndorf R.. DeepPVP: phenotype-based prioritization of causative variants using deep learning. BMC Bioinform. 2019; 20:65. [DOI] [PMC free article] [PubMed] [Google Scholar]
- 11.Rao A., Joseph T., Saipradeep V.G., Kotte S., Sivadasan N., Srinivasan R.. PRIORI-T: A tool for rare disease gene prioritization using MEDLINE. PLoS ONE. 2020; 15:e0231728. [DOI] [PMC free article] [PubMed] [Google Scholar]
- 12.Godard P., Page M.. PCAN: phenotype consensus analysis to support disease-gene association. BMC Bioinform. 2016; 17:518. [DOI] [PMC free article] [PubMed] [Google Scholar]
- 13.Schaaf J., Sedlmayr M., Schaefer J., Storf H.. Diagnosis of Rare Diseases: a scoping review of clinical decision support systems. Orphanet. J. Rare. Dis. 2020; 15:263. [DOI] [PMC free article] [PubMed] [Google Scholar]
- 14.Landrum M.J., Lee J.M., Benson M., Brown G.R., Chao C., Chitipiralla S., Gu B., Hart J., Hoffman D., Jang W.et al.. ClinVar: improving access to variant interpretations and supporting evidence. Nucleic Acid Res. 2018; 46:1062–1067. [DOI] [PMC free article] [PubMed] [Google Scholar]
- 15.Köhler S., Carmody L., Vasilevsky N., Jacobsen J.O.B., Danis D., Gourdine J., Gargano M., Harris N.L., Matentzoglu N., McMurry J.A.et al.. Expansion of the Human Phenotype Ontology (HPO) knowledge base and resources. Nucleic Acids Res. 2019; 47:1018–1027. [DOI] [PMC free article] [PubMed] [Google Scholar]
- 16.Shen F., Peng S., Fan Y., Wen A., Liu S., Wang Y., Wang L., Liu H.. HPO2Vec+: Leveraging heterogeneous knowledge resources to enrich node embeddings for the Human Phenotype Ontology. J. Biomed. Inform. 2019; 96:103246. [DOI] [PMC free article] [PubMed] [Google Scholar]
- 17.Mikolov T., Chen K., Corrado G., Dean J., Bengio Y., LeCun Y.. Efficient estimation of word representations in vector space. Proceedings of the International Conference on Learning Representations, 2013. 2013; 12:Scottsdale, Arizona, USA: 1–12. [Google Scholar]
- 18.Grover A., Leskovec J., Krishnapuram B., Shah M.. node2vec: Scalable feature learning for networks. Proceedings of the 22nd ACM SIGKDD international conference on Knowledge discovery and data mining, 2016. 2016; San Francisco: 855–864. [DOI] [PMC free article] [PubMed] [Google Scholar]
- 19.Akiba T., Sano S., Yanase T., Ohta T., Koyama M., Teredesai A., Kumar V.. Optuna: A Next-generation Hyperparameter Optimization Framework. Proceedings of the 25rd ACM SIGKDD International Conference on Knowledge Discovery and Data Mining, 2019. 2019; Anchorage, AK, USA: 2623–2631. [Google Scholar]
- 20.Pavlov M., Ichise R.. Finding experts by link prediction in co-authorship networks. FEWS. 2007; 290:42–55. [Google Scholar]
- 21.Hsieh T.C., Mensah M.A., Pantel J.T.PEDIA consortium . PEDIA: prioritization of exome data by image analysis. Genet. Med. 2019; 21:2807–2814. [DOI] [PMC free article] [PubMed] [Google Scholar]
- 22.Robinson P., Ravanmehr V., Jacobsen J., Danis D., Zhang X., Carmody L., Gargano M., Thaxton C., Reese J., Holtgrewe M.et al.. Interpretable clinical genomics with a likelihood ratio paradigm. Am. J. Hum. Genet. 2020; 107:403–417. [DOI] [PMC free article] [PubMed] [Google Scholar]
Associated Data
This section collects any data citations, data availability statements, or supplementary materials included in this article.
Supplementary Materials
Data Availability Statement
The Data used in this paper can be found at https://github.com/Chengyao-Peng/CADA.


