

Abstract
Longitudinal analyses of the innate immune system, including the earliest time points, are essential to understand the immunopathogenesis and clinical course of coronavirus disease (COVID-19). Here, we performed a detailed characterization of natural killer (NK) cells in 205 patients (403 samples; days 2 to 41 after symptom onset) from four independent cohorts using single-cell transcriptomics and proteomics together with functional studies. We found elevated interferon (IFN)-α plasma levels in early severe COVD-19 alongside increased NK cell expression of IFN-stimulated genes (ISGs) and genes involved in IFN-α signaling, while upregulation of tumor necrosis factor (TNF)-induced genes was observed in moderate diseases. NK cells exert anti-SARS-CoV-2 (severe acute respiratory syndrome coronavirus 2) activity but are functionally impaired in severe COVID-19. Further, NK cell dysfunction may be relevant for the development of fibrotic lung disease in severe COVID-19, as NK cells exhibited impaired anti-fibrotic activity. Our study indicates preferential IFN-α and TNF responses in severe and moderate COVID-19, respectively, and associates a prolonged IFN-α-induced NK cell response with poorer disease outcome.
Keywords: NK cells, COVID-19, scRNA-seq, proteomics, severe, moderate, type 1 IFN, TNF, lung fibrosis, antiviral
Graphical abstract
The importance of NK cells in the innate response to viral infection provides rationale for deeper understanding of their role in COVID-19. Here, Krämer et al. utilize longitudinal analysis of NK cells to show early TNF and IFN-α signatures associated with moderate and severe COVID-19, respectively, and NK cell functional impairment in severe disease.
Introduction
The clinical presentation of severe acute respiratory syndrome coronavirus 2 (SARS-CoV-2) infection is highly variable, ranging from asymptomatic to severe courses of coronavirus disease (COVID-19) (Huang et al., 2020; Wang et al., 2020a; Zhou et al., 2020). Besides epidemiological factors and certain comorbidities (Bennett et al., 2021; Williamson et al., 2020), an imbalanced immune response underlies the clinical manifestation of COVID-19. Patients with severe disease, in particular, present with elevated blood plasma levels of numerous cytokines and chemokines (Chen et al., 2020; Giamarellos-Bourboulis et al., 2020), as well as a dysregulated type I interferon (IFN) response (Blanco-Melo et al., 2020; Hadjadj et al., 2020; Yao et al., 2021). Further characteristics of severe COVID-19 are high frequencies of circulating CD14hiCD16hi monocytes, decreased CD14loCD16hi monocytes (Hadjadj et al., 2020; Schulte-Schrepping et al., 2020; Su et al., 2020), proliferating, type I IFN-activated HLAlo-suppressive monocytes, and emergency granulopoiesis. Metabolically hyperactive plasmablasts, IFN-activated circulating megakaryocytes, and erythropoiesis are increased in critically ill patients (Bernardes et al., 2020; Stephenson et al., 2021). T and B cell compartments are also altered in severe COVID-19 (Huang et al., 2020; Braun et al., 2020; Grifoni et al., 2020; Ni et al., 2020; Schulien et al., 2021).
Despite many studies on important aspects of the immunopathology of COVID-19, our understanding of this disease is still incomplete. For example, the role of natural killer (NK) cells, a heterogeneous family of innate immune cells, has not been sufficiently studied. Although there is clear evidence for their role in acute viral infections (Björkström et al., 2011; Blom et al., 2016; Kokordelis et al., 2014), data on NK cells in SARS-CoV-2 infection are sparse (Maucourant et al., 2020; Rajaram et al., 2020). A COVID-19 vaccine study demonstrated an anti-Spike-dependent NK cell response in vaccinated macaques (Yu et al., 2020), suggesting that NK cells exert functions against SARS-CoV-2-infected cells. Accordingly, a potential therapeutic benefit of NK cells in COVID-19 is currently being investigated in clinical trials (ClinicalTrials.gov: NCT04797975, NCT04634370, and NCT04280224). On the other hand, NK cells can potentially exacerbate the extent of lung injury in viral respiratory infections (Rajaram et al., 2020).
COVID-19 has been associated with NK cell activation, increased frequency of CD57+ adaptive NK cells (Maucourant et al., 2020; Varchetta et al., 2020), impaired cytolytic activity (Osman et al., 2020), reduced peripheral NK cells (Giamarellos-Bourboulis et al., 2020; Jiang et al., 2020; Wang et al., 2020b; Wilk et al., 2020), and increased intra-pulmonary NK cell frequencies (Chua et al., 2020, Liao et al., 2020, Xu et al., 2020). However, due to heterogeneous study populations, including patients under high-dose steroid therapy, the lack of longitudinal analyses, and limited functional characterizations, the exact effects of SARS-CoV-2 infection on NK cells and their role in antiviral immune responses and the immunopathogenesis of COVID-19 still need to be clarified.
Here, we performed a detailed longitudinal characterization of NK cells in COVID-19 patients of different severities by combining single-cell transcriptomics and proteomics in four independent cohorts with comprehensive functional analyses, including studying NK cell activity against SARS-CoV-2-infected cells.
We demonstrate that NK cells in early severe COVID-19 display signs of a strong IFN-α response with increased expression of IFN-stimulated genes (ISGs) and genes related to IFN-α signaling, whereas in early moderate disease, NK cells were characterized by a tumor necrosis factor (TNF) imprint. This differential gene expression pattern was specific for the first week after onset of symptoms and also enabled us to discriminate between patients with fatal outcomes of COVID-19 and those who finally recovered. Moreover, we demonstrate an impaired anti-SARS-CoV2 NK cell activity, which was particularly prominent and prolonged in severe COVID-19. In summary, our data link persistent NK cell dysfunction, induced by an exaggerated IFN-α response, with an unfavorable disease course and thereby support a role for NK cells in the immunopathogenesis of COVID-19.
Results
Multi-center study to determine NK cell molecular phenotype and function
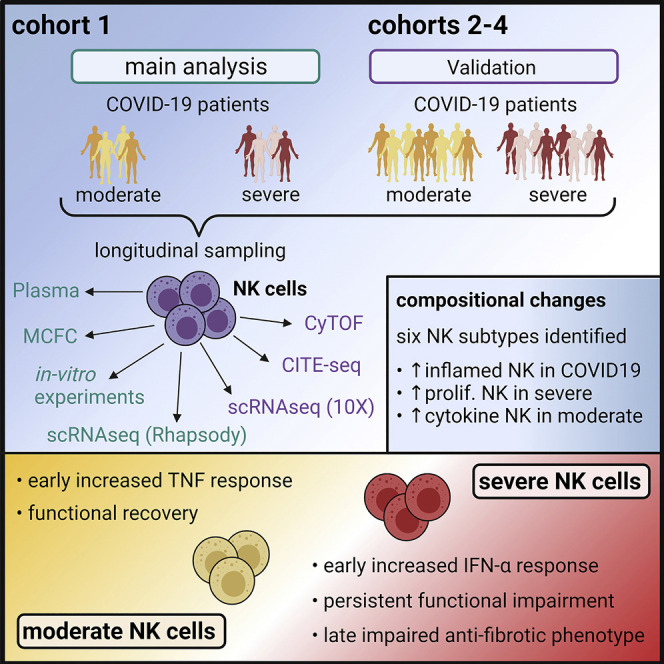
To assess the impact of SARS-CoV-2 infection on the function and composition of the NK cell pool, we analyzed longitudinally collected peripheral blood samples in a multi-center setting. Samples collected in Bonn (cohort 1) were analyzed on the cellular level by multi-color flow cytometry and a micro-well-based single-cell RNA sequencing (scRNA-seq) approach, while plasma levels of soluble factors were studied using a bead-based digital and planar-array ultrasensitive immunoassays. For cohorts 2 and 3, collected in Berlin and Kiel, respectively, as well as for the fourth cohort, assembled from two large cohorts carried out in the UK (Stephenson et al., 2021) and the US (Su et al., 2020), scRNA-seq was performed using a droplet-based platform. Cohort 2 samples were additionally analyzed by mass cytometry, cytometry by time of flight (CyTOF) (Figures 1A and 1B; Table S1). Patients treated with dexamethasone were excluded from the analyses to avoid immunotherapy-induced biases in the results. A total of 205 patients and 81 controls, including 8 donors with flu-like symptoms, were studied.
Figure 1.

Multi-center study to determine NK cell molecular phenotype and function
(A) Overview of the study design.
(B) Overview of longitudinal patient distribution.
(C) Absolute numbers of total NK cells and NK cells subsets in cohort 1.
(D) Absolute numbers of total NK cells and CD56dim NK cells in cohort 2.
(E) Pearson correlation between numbers of absolute and CD56dim NK cells and serum CRP levels.
(F) Frequency of NK cells positive for active caspase-3 or CD95 in cohort 1.
(G) Detection of CD95 and active caspase-3 in control NK cells co-incubated without or with nucleocapsid.
Kruskal-Wallis (KW) test corrected for multiple comparison by controlling the false discovery rate (FDR; Benjamini, Krieger, Yekutieli [BKY]); ∗p < 0.05, ∗∗p < 0.01, ∗∗∗p < 0.01.
For n, see Table S6.
In both cohorts 1 and 2, COVID-19 was associated with a decreased absolute number of circulating NK cells (Figures 1C and 1D). Longitudinal analysis in cohort 1 demonstrated a similar loss of NK cells in both moderate and severe diseases in week 1. In contrast, from week 2 onward, patients with moderate disease showed a normalization of NK cell counts, while severe COVID-19 was characterized by persistent NK cell depletion (Figure S1A). Percentages of CD56bright and CD56dim NK cells did not differ between study groups (Figures S1B and S1C). Correlation analysis demonstrated that the numbers of total and CD56dim NK cells negatively correlated with C-reactive protein (CRP), an acute-phase protein reflecting the intensity of inflammation (Figure 1E). COVID-19 was associated with an increased NK cell expression of the apoptosis marker active caspase-3 and CD95 (Figure 1F). SARS-CoV-2 nucleocapsid protein induced active caspase-3 expression and a dose-dependent increase in CD95 (Figure 1G). In summary, our findings indicate that COVID-19 significantly affects the NK cell compartment.
COVID-19-specific composition of the circulating NK cell compartment
In order to gain a more detailed insight into COVID-19-induced alterations of the NK cell pool, we assessed transcriptional changes of NK cells in the blood by scRNA-seq analysis. In cohort 1, NK cell transcriptomes were extracted from COVID-19 peripheral blood mononuclear cell (PBMC) scRNA-seq data (Schulte-Schrepping et al., 2020) derived from 64 samples from 17 COVID-19 patients (8 moderate and 9 severe) collected between days 2 and 25 after symptom onset, and 13 sex- and age-matched controls. Uniform Manifold Approximation and Projection (UMAP) visualization of the NK cells in cohort 1 revealed transcriptional alterations in diseased NK cells. Density coloring stratified for cells from controls or moderate or severe COVID-19 patients showed differential two-dimensional distribution (Figure 2 A). To investigate these disease-relevant differences, differentially expressed genes (DEGs) were calculated for severity groups (Figure 2B). Hierarchical clustering of the DEGs revealed 5 different gene modules with specific patterns according to the disease groups. Gene enrichment analysis of the severe COVID-19-related module 3 and the moderate COVID-19-related modules 4 and 5 revealed enrichment in the Hallmark terms “IFN-α response” and “TNF signaling,” respectively (Table S3), indicating that these pathways are discriminators for severe and moderate COVID-19 NK cells on the transcriptional level.
Figure 2.

COVID-19-specific composition of the circulating NK cell compartment
(A) Cell frequency density by disease severity overlaid on the UMAP of cohort 1 (scRNA-seq).
(B) Heatmap of DEGs calculated based on the possible severity comparisons for all NK cells (scRNA-seq, cohort 1). Multiple comparison adjustment (Benjamini-Hochberg) and FDR cutoff of 5%. Hierarchical clustering of gene modules and functional enrichment using the Kyoto Encyclopedia of Genes and Genomes (KEGG) and Hallmark databases (Table S3).
(C) UMAP of NK cells from cohort 1 (scRNA-seq; 10,927 cells). NK subtypes defined by cluster marker expression and reference-based NK annotations (Table S2).
(D) Selected marker genes for each identified NK subtype from (C).
(E) Heatmap showing the proportion of each severity group for identified NK subtypes of cohort 1 (scRNA-seq).
(F) Cell frequency density plot by disease severity overlaid on the UMAP of cohort 1 (flow cytometric [FC] data) of controls (left top panel), moderate COVID-19 (middle top panel), and severe COVID-19 (left lower panel) patients. Phenograph clustering (middle lower panel) and NK cell subsets based on scRNA-seq data overlaid on the UMAP (right panel; alignment in Figures S2D and S2E).
(G) Box and whisker plots of identified NK subtypes in cohort 1 (FC data). KW and Dunn’s multiple comparison test (not significant [ns]: p > 0.05, ∗p ≤ 0.05, ∗∗p ≤ 0.01, ∗∗∗p ≤ 0.001, ∗∗∗∗p ≤ 0.0001).
(H) Cell frequency density plot by disease severity overlaid on the UMAP of cohort 2 (CyTOF) of controls (left top panel), flu-like-illness (second top panel), moderate COVID-19 (third top panel), and severe COVID-19 (left lower panel) patients. Phenograph clustering (middle lower panel) and NK cell subsets based on scRNA-seq data overlaid on the UMAP (right panel; alignment in Figures S2F and S2G).
(I) Box and whisker plots of identified NK subtypes in cohort 2 (CyTOF). KW with multiple comparison by controlling FDR (BKY) was performed; ns: p > 0.05, ∗p ≤ 0.05, ∗∗p ≤ 0.01, ∗∗∗p ≤ 0.001.
For n, see Table S6.
To further explore the transcriptional heterogeneity within the NK cell compartment, we performed a clustering analysis of the single-cell transcriptomes, identifying 6 distinct subtypes (Figure 2C). Comparison to previously published NK scRNA-seq signatures (Smith et al., 2020) and cluster marker expression revealed these 6 subtypes comprised inflamed CD56dim (high IFN-related genes); proliferating CD56dim (MKI67); cytokine CD56dim (CCL4, CCL3, IFNG); HLAhiCD56dim (HLA-DP, HLA-DR); CD56dim (FCGR3A); and CD56bright (NCAM1) NK cells (Figure 2D; Table S2). NK cell transcriptomes from the other 3 cohorts (cohorts 2–4) (Bernardes et al., 2020; Schulte-Schrepping et al., 2020), which were comprised of 49 samples from 18 COVID-19 patients and 22 control donors, 20 samples from 10 COVID-19 patients, and 5 control donors as well as 201 samples from 110 COVID-19 patients and 39 control donors, respectively (Figures 1A and 1B; Tables S1 and S6), resulted in 3 validation datasets of 6,964, 15,369, and 97,764 single-cell NK transcriptomes, respectively. Peripheral NK cell subtypes identified in cohort 1 were similarly found in cohorts 2–4, validating the subtype annotation (Figures S2A and S2B).
Next, we analyzed the distribution of NK cell subtypes across different disease severities (Figures 2E and S2C). In severe COVID-19 patients, both inflamed and proliferating CD56dim NK cells were strongly overrepresented compared to moderate COVID-19. The fraction of cytokine CD56dim NK cells was enriched in samples derived from patients with moderate disease. All these subtypes were rather low in controls, emphasizing their strong disease association. CD56dim NK cells represented the main NK cell population in blood from control donors (Figures 2E and S2C). Taken together, inflamed and proliferating CD56dim NK cells were associated with severe and cytokine CD56dim NK cells with moderate disease, respectively.
In parallel, we applied flow cytometry in cohort 1 to study the peripheral NK cell compartment based on protein markers (Figures 2F, S2D, and S2E; Table S2). Analysis of NKp80 and CD94 excluded contamination with ILC1s within the NK cell gate (Figure S2H). We identified inflamed CD56dim, proliferating CD56dim, cytokine CD56dim, HLAhi CD56dim, CD56dim, and CD56bright subpopulations analogous to the transcriptome analysis (Figure S2E). Proportions of inflamed CD56dim, proliferating CD56dim, and HLAhi CD56dim subpopulations were increased in COVID-19 patients (Figure 2G). Inflamed CD56dim, cytokine CD56dim, HLAhi CD56dim, and CD56bright NK subsets were also identified by CyTOF in cohort 2 (Figure S2G), where inflamed CD56dim and HLAhiCD56dim NK cells were elevated in COVID-19 patients (Figure 2I). The cytokine CD56dim subset was particularly increased in patients with flu-like symptoms. The Cellular Indexing of Transcriptomes and Epitopes (CITE)-seq data from cohort 4 identified 6 NK cell subtypes as seen by transcriptome-based analysis, further corroborating subpopulation structure at the protein level (Figures 2D and 2E). Single-marker analysis confirmed elevated activation (both cohorts: CD69 and HLA-DR; cohort 1: CD38) and proliferation (cohort 2: KI-67) in severe patients. Furthermore, an increase of NK cell-specific receptor expression was detected for severe disease (cohort 1: NKG2C) and flu-like illness (cohort 2: CD226), respectively (Figures S2H, gating, S2I, and S2J).
Together, NK cells stratified by disease severity revealed marked differences between severe and moderate COVID-19 in regard to gene expression and composition of NK cell subtypes.
Longitudinal characterization reveals early and persistent NK cell disparity between moderate and severe COVID-19
To also include the aspect of disease dynamics in our analysis (Figure 3 A), peripheral NK cells of cohort 1 were stratified by separate samples obtained the weeks after disease onset, and DEGs were calculated comparing cells from the respective severity groups. UMAP representation revealed prominent time-dependent changes (Figure 3B). Calculated DEGs between conditions were grouped into 15 modules by hierarchical clustering (Figure 3C) and used as input for functional enrichment analysis and transcription factor (TF) and upstream ligand prediction (Figure 3D; Table S4). Modules 1 and 2 were highly expressed in moderate COVID-19 NK cells and enriched for the terms “TNF signaling via NF-κB” and “response to IFN-gamma,” indicating antiviral activity based on IFN and TNF signaling. The modules included IRF1, IFITM3, CCL3, and CCL4, which are induced by type I IFNs and genes such as TNFAIP, NFKBIA, and FOSL2 relevant for TNF signaling. TF prediction further underlined an IFN-induced response with STAT1/2 and the TNF impact, with RELA among the top predicted TFs. RelA is a component of nuclear factor κB (NF-κB) that drives various transcriptional programs after TNF stimulation (Liu et al., 2017). Module 3 was comprised of 46 genes characterized by a strong expression in the second week of severe disease. Functional enrichment analysis assigned the terms “E2F targets” and “DNA replication” to this module, indicating an enhanced proliferative capacity. TF prediction pointed to members of the E2F family as key TFs, further emphasizing the proliferative functionality of these genes. HMGB2, a factor related to cell proliferation in cancer (Zhang et al., 2019b), was predicted as the top potential ligand. Module 4 was enriched in genes specifically upregulated in week 1 in severe COVID-19 NK cells. Functional analysis of the 121 module genes revealed implications in “IFN-α response” and “negative regulation of viral processes.” Correspondingly, the module contained numerous IFN-related genes (MX1, ISG15, ISG20, and IFIH1). The top predicted ligands being members of the IFN-α family and the predicted TF including IFN-induced factors (STAT1, STAT2, and IRF9) underlined the inflammatory character of this module. These results indicated the relevance of IFN-α signaling for severe COVID-19 NK cells in early disease. In conclusion, early severe COVID-19 is dominated by IFN-α signaling (module 4) while, in contrast to early moderate COVID-19, showing lower enrichment for the TNF signaling pathway (module 1 and 2).
Figure 3.

Longitudinal characterization of NK cells in COVID-19
(A–D) Workflow of longitudinal analysis of scRNA-seq data from cohort 1 (A), UMAPs (B), heatmap generation (C), and analysis (D) are indicated.
(B) Cell frequency density plot by disease severity and weeks after onset overlaid on the UMAP of cohort 1 (scRNA-seq, for n, see Table S6).
(C) Heatmap of DEGs calculated based on the possible comparisons for severities and week after onset based on all NK cells (scRNA-seq, cohort 1). Multiple comparison adjustment (Benjamini-Hochberg) and FDR cutoff of 5%. Hierarchical clustering of genes into modules (Table S4).
(D) Selected results from functional enrichment analysis using the Gene Ontology (GO), KEGG, and Hallmark databases, transcription factor (TF) prediction, and upstream ligand prediction for each identified heatmap module from (C) (for the entire list, see Table S4).
(E) Heatmap of mean area under the curve (AUC) scores based on AUCell enrichment of heatmap gene modules from (C) for NK subtypes of cohort 1 (scRNA-seq).
(F) NK subtype occupancy over time in days after symptom onset as average of all samples stratified by severity.
(G) Density plot of cell frequency by disease severity and weeks after onset overlaid on the UMAP of cohort 1 (FC data).
(H) Heatmap divided by disease severity and weeks after onset showing the proportion of each severity group for the three identified NK subtypes of cohort 1 (FC data).
For n, see Table S6.
To assess the implication of the 6 NK cell subtypes (Figure 2C) in disease-severity- and time-specific DEG modules (Figures 3C and 3D), gene set enrichment analysis of each module for each subtype was performed (Figure 3E). As expected by functional enrichment and TF prediction, modules 1 and 2, specific for early moderate COVID-19 NK cells, enriched especially in the cytokine-producing CD56dim and partly in the inflamed CD56dim NK cells, while module 4, enriched in week 1 after symptom onset in severe COVID-19 NK cells, was dominated by inflamed CD56dim NK cells, stressing the early differences in severe and moderate COVID-19 and further highlighting the importance of TNF for a milder disease course. The proliferating CD56dim NK cells contributed exclusively to module 3, including proliferation-related genes upregulated in the second week of severe COVID-19 (Figures 3C and 3D). Visualization of the proportions of different subtypes over time showed an enrichment of inflamed CD56dim NK cells in week 1 declining until mid week 2 (Figure 3F). In contrast to severe COVID-19, moderate disease was characterized by a continuous presence of cytokine-producing CD56dim NK cells. In severe patients, a strong increase of proliferating CD56dim NK cells was observed starting approximately 11 days after symptom onset until the end of week 3 (Figure 3F).
Next, we defined time-dependent and severity-specific alterations of the 6 NK cell subsets in cohort 1 (Figures 3G, 3H, and S3A) and cohort 2 (Figure S3B). The proportion of inflamed CD56dim NK cells was slightly higher in early severe COVID-19 compared to patients with moderate disease in cohort 1 (Figure 3H) and cohort 2 (Figure S3C). Consistent with the scRNA-seq data, proliferating CD56dim NK cells increased from week 2 to 3 in severe COVID-19 in cohort 1. Severe COVID-19 was also associated with increased protein expression of the activation markers CD38, CD69, and HLA-DR, especially in week 1 (Figure S3A and S3D). In cohort 2, the frequency of CD56dim HLA-DRhi did not differ between moderate and severe disease but was increased in COVID-19 compared to controls and flu-like illness, respectively (Figures 3C and 3D). Finally, the proliferation marker KI-67 was increased on NK cells in severe COVID-19.
Together, the predominant expression of activation markers was observed both on RNA and protein levels in the early phase of the disease course in severe COVID-19 patients.
Increased IFN-α and TNF signaling drive disease-severity-associated transcriptional programs in COVID-19 NK cells
To address the type I IFN system in more detail, we extracted the genes from the Hallmark term “IFN-α response” and visualized those that were DEGs (Figure 4 A). Both moderate and severe COVID-19 patients showed elevated expression of these type I IFN signature genes at disease onset, which subsided in week 1 in moderate patients and in week 3 in severe patients. Several type I IFN target genes showed differential regulation between moderate and severe COVID-19; for example, IFITM1 and IFITM3 were mainly elevated in moderate disease while GBP4, SELL, PSME2, CASP1, or TXNIP were only increased in severe COVID-19 (Figure 4A). Even when using all “IFN-α response” genes for signature enrichment analysis, this response was elevated early after infection and persisted into the second week in severe disease (Figure 4B). Examination of the data of cohorts 2–4 corroborated these findings, as the IFN-α response was also enriched in COVID-19 NK cells in weeks 1 and 2, with a stronger signal in severe cases.
Figure 4.

Increased IFN-α and TNF signaling drive disease-severity-associated transcriptional programs in COVID-19 NK cells
(A) Heatmap of genes of the intersection of the Hallmark IFN-α response and the previously calculated DEGs in cohort 1 (scRNA-seq) separated by disease severity and week after symptom onset.
(B) AUCell-based enrichment of the Hallmark IFN-α response signature, and violin plots of the AUC scores per severity group and week after onset for all four cohorts (scRNA-seq). For cohorts 2 and 3, the enrichment of week 2 after symptom onset and for cohort 4 the enrichment of week 1 after symptom onset, together with controls, are shown, respectively. FDR-corrected KW p value is indicated.
(C) Heatmap of SARS-CoV-2 nucleocapsid, immunoglobulin G (IgG), and plasma cytokines in samples from patients of cohort 1: control (n = 6), moderate COVID-19 (n = 8), and severe COVID-19 (n = 9).
(D) Heatmap showing the Spearman correlation coefficients of Sequential Organ Failure Assessment (SOFA) score and WHO ordinal scale, with plasma cytokines of COVID-19 samples originating from week 1 after symptom onset (severe: n = 9, moderate: n = 9). Statistically significant correlations are indicated.
(E) AUCell-based enrichment of the Hallmark IFN-α response signature, and violin plots of the AUC score of controls and severe COVID-19 samples stratified by disease outcome for cohort 1 (scRNA-seq) and cohort 2 (scRNA-seq). KW and Dunn’s multiple comparison test (ns: p > 0.05, ∗p ≤ 0.05, ∗∗p ≤ 0.01, ∗∗∗p ≤ 0.001, ∗∗∗∗p ≤ 0.0001).
(F) Heatmap of genes of the intersection of the Hallmark TNF signaling and the previously calculated DEGs in cohort 1 (scRNA-seq) separated by disease severity and week after symptom onset.
(G) AUCell-based enrichment of the Hallmark TNF signaling signature, and violin plots of the AUC per severity group and week after onset for all four cohorts (scRNA-seq). For cohorts 2 and 3, the enrichments of week 2 after symptom onset and for cohort 4 the enrichment of week 1 after symptom onset, together with controls, are shown, respectively. FDR-corrected KW p value is indicated.
(H) AUCell-based enrichment of the Hallmark TNF signaling signature, and violin plots of the AUC of controls and severe COVID-19 samples stratified by disease outcome for cohort 1 (scRNA-seq) and cohort 2 (scRNA-seq). KW and Dunn’s multiple comparison test (ns: p > 0.05, ∗p ≤ 0.05, ∗∗p ≤ 0.01, ∗∗∗p ≤ 0.001, ∗∗∗∗p ≤ 0.0001). For n, see Table S6.
(I) Relative expression of ISG Hallmark transcripts (MX-1, IFI6, and ISG15; 2-ΔCq values related to 2 housekeepers) in unstimulated (black line) or stimulated control NK cells with recombinant IFN-α (pink line: 1ng/ml; violet line: 10ng/ml) in combination with recombinant TNF (0, 10, or 25 ng/ml) for 18 h.
(J) Relative expression of TNF Hallmark transcripts (MAP3K, TNF1IP3, and LITAF; Z scored data obtained from 2-ΔCq values related to 2 housekeepers) in unstimulated or stimulated control NK cells with TNF (10 ng/ml) alone or TNF (10 ng/ml) combined with IFN-α (1 ng/ml) for 18 h.
While investigating plasma levels of IFNs and proinflammatory cytokines (Figure 4C), we observed increased plasma concentrations of IFN-α together with other proinflammatory cytokines (TNF, IL-6, and IFN-γ) in week 1, especially in severe disease (Figure 4C). In contrast to proinflammatory cytokines, plasma levels of IFN-α dropped after week 1. Plasmacytoid dendritic cells (pDCs), a main producer of IFN-α, were reduced in both moderate and severe COVID-19 in week 1 (Figures S4A and S4B), which is in line with recent findings (Kuri-Cervantes et al., 2020), and argued against pDCs being the major source for elevated circulating IFN-α during this time.
When correlating IFNs and proinflammatory cytokines (week 1) with clinically determined disease severity, only IFN-α correlated with both WHO classification and SOFA score (Figure 4D). Hence, we used severe COVID-19 samples from all weeks after symptom onset and showed that the IFN response signature is elevated in patients from cohort 1 and 2 who succumbed to infection (Figure 4E), which might therefore contribute to a fatal disease course.
To study the role of TNF, we extracted the genes from the Hallmark term “TNF signaling via NF-κB” and visualized DE genes in cohort 1 (Figure 4F). These genes showed a distinct distribution from the “IFN-α response” Hallmark term with very strong signals in moderate compared to severe COVID-19, particularly in week 1, with a prolonged expression for most genes. A few genes included in the TNF-signaling Hallmark (AREG, IL7R, and CEBPD) were only induced in severe COVID-19. Enrichment analysis using the complete Hallmark for “TNF signaling via NF-κB” demonstrated a strong enrichment in NK cells from moderate COVID-19 patients that subsided over time, with no enrichment in severe COVID-19 NK cells (Figure 4G). In cohorts 2–4, the TNF signature was enriched in moderate patients for the earliest time points available in the cohorts. In contrast to the IFN-α response signatures, the TNF signature was most elevated in NK cells from discharged patients, both in cohorts 1 and 2, when analyzing severe samples from all weeks after symptom onset (Figure 4H).
The lack of enrichment of TNF signature genes in severe COVID-19 was discordant with the high level of TNF in plasma in these patients (Figures 4C and S4C). The interplay between the TNF and type I IFN pathways might be, in part, responsible for differential gene induction in NK cells (Schultze and Aschenbrenner, 2021). We tested this possible interaction by incubating peripheral NK cells from control individuals with or without TNF in the presence of two different IFN-α concentrations and assessed IFN target genes MX-1, IFI6, and ISG15 (Figure 4I). While the addition of TNF in the presence of high levels of IFN-α, reminiscent of severe COVID-19, led to a further increase of IFN target gene expression, this was not observed under low-level IFN-α. In a second set of experiments, TNF target genes were assessed in presence of TNF with or without low-level IFN-α (Figure 4J). Here, the addition of IFN-α reduced the expression of TNF target genes, mirroring the transcriptional signatures in severe COVID-19.
Collectively, we observed strong TNF signature gene induction in moderate but not severe COVID-19, while IFN-α response genes were predominant in NK cells from severe COVID-19 and were linked to IFN signaling being associated with an unfavorable outcome.
NK cells display anti-SARS-CoV-2 activity but are functionally impaired in COVID-19
Quantitative assessment of NK cell responses demonstrated a marked dysfunction of circulating NK cells after stimulation with K562 cells (Figures 5 A and S5A). Disturbance of NK cell function was more pronounced in patients with severe COVID-19, who displayed reduction in percentages of IFN-γ+, and TNF+ cells in both CD56dim (Figure 5B) and CD56bright NK cells (Figure S5B). However, cytotoxic degranulation was only impaired in the CD56dim subgroup and not in the CD56bright subgroup (Figures 5B and S5B). Kinetic analysis demonstrated that cytokine production differed between moderate and severe COVID-19 over time (Figure 5C), with NK cells in severe COVID-19 showing a persistent functional disturbance after more than 2 weeks (Figure 5C). Similar observations were made when peripheral NK cells were stimulated with cytokines (Figures S5C and S5D).
Figure 5.

NK cells display anti-SARS-CoV-2 activity but are functionally impaired in COVID-19
(A) Schematic experimental setup.
(B) Detection of IFN-γ, TNF-α production, and CD107a expression of CD56dim NK cells severe, n = 41.
(C) Functional capacity of K562-stimulated CD56dim NK cells separated according to study groups and weeks after onset.
(D) Detection of SARS-CoV-2 Spike protein in Caco-2 and Vero E6 cells cultured with or without control NK cells.
(E) Detection of SARS-CoV-2 Spike protein in Caco-2 cells cultured with control versus COVID-19 NK cells.
(F) Detection of SARS-CoV-2 Spike protein in Vero E6 cells cultured with control versus COVID-19 NK cells.
(G) Detection of active caspase-3 in SARS-CoV-2-infected Caco-2 cells cultured with control versus COVID-19 NK cells.
(H) Detection of active caspase-3 in SARS-CoV-2-infected Vero E6 cells cultured with control versus COVID-19 NK cells.
(I) IFN-γ concentrations in cell culture supernatants obtained from (E) and (F).
(J) TNF-ɑ concentrations in cell culture supernatants obtained from (E) and (F).
Statistical analysis in (C)–(E): KW test corrected for multiple comparison by controlling FDR (BKY) was performed; ns, ∗p ≤ 0.05; ∗∗p ≤ 0.01, ∗∗∗p ≤ 0.001, ∗∗∗∗p ≤ 0.0001.
For n, see Table S6.
Next, we tested the anti-SARS-CoV-2 function of circulating COVID-19 NK cells. To this end, Caco-2 cells and Vero E6 cells were infected with SARS-CoV-2 and co-cultured with purified NK cells. Using SARS-CoV-2 Spike-specific nanobodies (Koenig et al., 2021) for quantification of virus protein levels in viable, active Caspase-3– cells, we found peripheral NK cells from controls reduced viral protein levels both in Caco-2 and Vero E6 cells (Figure 5D). In contrast, NK cells from both moderate and severe COVID-19 displayed impaired antiviral activity independent of interleukin (IL)-2 pre-stimulation (Figures 5E and 5F). Circulating NK cells increased the expression of active caspase-3 in SARS-CoV-2-infected target cells, especially after pre-stimulation with IL-2. However, induction of active caspase-3 did not differ between COVID-19 NK cells and controls (Figures 5G and 5H). To test whether reduced NK cell IFN-γ/TNF production might be involved in impaired antiviral activity of COVID-19 NK cells, different concentrations of IFN-γ, TNF, or a combination of both cytokines were added to virus-infected cells. Both IFN-γ and TNF led to reduced viral RNA titers (Figures S5E and S5F) and decreased expression of the Spike protein (Figures S5G and S5H). In line with these findings, we found lower concentrations of IFN-γ and TNF in supernatants of COVID-19 NK cells compared to control cells after incubation with both cell lines (Figures 5I and 5J).
Taken together, the antiviral activity of COVID-19 NK cells was markedly diminished and is associated with a decline in IFN-γ and TNF production.
Soluble factors mediate COVID-19-associated NK cell dysfunction
Enhanced expression of immune checkpoint molecules on NK cells is suggested to be involved in ineffective antiviral immune responses (Hadjadj et al., 2020; Vabret et al., 2020; Wilk et al., 2020, Kong et al., 2020; Schultheiß et al., 2020). scRNA-seq analysis revealed an increased expression of several immune checkpoint genes in COVID-19, but no consistent differences were found between moderate and severe disease (data not shown). On the protein level, increased frequencies of PD-1+, LAG3+, and TIGIT+ peripheral NK cells, especially in severe COVID-19, were observed in cohort 2, and higher proportions of TIM-3+ NK cells were observed in cohort 1 (Figures S6A and S6B). The proportion of TIM-3+ and PD-1+ NK cells was rather low, and there was no correlation between IFN-γ production and the frequency of TIM-3+ or PD-1+ NK cells (Figure S6C). Regarding TIGIT, we found more increased IFN-γ production in TIGIT- than in TIGIT+ NK cells, irrespective of COVID-19 severity. The severe COVID-19-associated impairment of IFN-γ production was detected for both TIGIT+ and TIGIT- subpopulations (Figure S6D). In summary, little evidence was found for a definitive involvement of the checkpoint molecules, PD-1, TIGIT, LAG-3, or TIM-3, in functional NK cell impairment in COVID-19.
Given the increased concentrations of inflammatory and immunosuppressive cytokines observed in early severe COVID-19 (Figure 4C), we next incubated peripheral control NK cells with plasma from COVID-19 patients or controls. Incubation with severe COVID-19 plasma resulted in a marked functional impairment with decreased IFN-γ (Figures 6A and 6B) and TNF (Figure 6C) production, whereas plasma from patients with moderate disease had only minor effects. A more detailed analysis revealed these differences between moderate and severe COVID-19 mainly resulted from differences at week 2 and later, resembling our ex vivo observations (Figure 5C). Ex vivo NK cell cytokine production per patient correlated with in vitro IFN-γ and TNF production of control NK cells after incubation with plasma from the respective COVID-19 patient (Figure 6D). These findings indicated that soluble factors were involved in COVID-19-associated NK cell dysfunction. In line with this hypothesis, we found IFN-α, TNF, and IL-6 suppressed NK production of IFN-γ (Figure S6E). However, neither blockade of individual cytokines nor simultaneous blockade of different cytokine combinations (data not shown) resulted in normalization of severe COVID-19 NK cell functions (Figure 6E). Yet, when culturing severe COVID-19 NK cells in the presence of plasma from controls, cytokine production and degranulation were almost completely restored (Figures 6F and 6G). To test whether there was a direct effect of viral components, particularly the SARS-CoV-2 nucleocapsid on NK cell function, we incubated NK cells from control donors with different concentrations of nucleocapsid and analyzed IFN-γ production after co-culture with K562 cells. Neither with nor without IL-2 did control donor NK cells show differences in IFN-γ production after incubation with nucleocapsid (Figure S6F).
Figure 6.

Soluble factors mediate COVID-19-associated NK cell dysfunction
(A) Schematic experimental setup.
(B) Effects of COVID-19 versus control plasma (severe, n = 27; moderate, n = 27) on NK cell IFN-γ production.
(C) Effects of COVID-19 and control plasma on NK cell TNF production.
(D) Pearson correlation between ex vivo IFN-γ or TNF production of K-562 stimulated NK cells of a specific COVID-19 patient and in vitro cytokine production of control NK following incubation with plasma of this same COVID-19 patient.
(E) Effects of the indicated blocking antibodies on cytokine production of purified control NK cells incubated with plasma obtained from COVID-19 patients before stimulation with K562 cells.
(F) Schematic experimental setup.
(G) Effects of control versus COVID-19 plasma on functional capacity of severe COVID-19 NK cells.
Statistical analysis in (A), (B), and (E): KW test corrected for multiple comparison by controlling FDR (BKY) was performed; ns, ∗p ≤ 0.05; ∗∗p ≤ 0.01, ∗∗∗p ≤ 0.001, ∗∗∗∗p ≤ 0.0001.
For n, see Table S6.
While transcriptome analyses had illustrated altered transcriptional programming of NK cells in COVID-19, functional assays show that this is not an inherent cell-intrinsic characteristic but a dysfunctional state triggered by severe COVID-19-associated soluble plasma components.
COVID-19 NK cells display impaired anti-fibrotic activity
Severe COVID-19 beyond the second week is characterized by persisting clinical symptoms (Grasselli et al., 2020; Guan et al., 2020). We therefore investigated the molecular phenotype of NK cells in later stages of the disease. Comparison of severe COVID-19 samples from week 3+ versus all others in cohort 1 distinguished a group of differentially regulated genes, which were then assessed in the other cohorts (Figure 7 A). While these genes also appeared to be differentially regulated in week 3+ for cohorts 2 and 3, the genes were already differentially regulated in week 2 for cohort 4. 14 genes showed similar average log fold changes in all cohorts (Figure 7B). Late-phase NK cells from patients with severe disease were characterized by downregulated expression of IFN-related genes but higher expression of DUSP2 (a regulator of the ERK signaling pathway) (Jeffrey et al., 2006) as well as the glucocorticoid-inducible factor TSC22D3 and RNA-binding protein ZFP36L2, which are linked to immunosuppression (Salerno et al., 2018; Yang et al., 2019b). In addition, we observed an increased expression of the chemokine receptor CXCR4 and AREG (encoding for amphiregulin [AR]), an epidermal growth factor receptor ligand involved in pulmonary fibrosis (Ding et al., 2016). Analysis of COVID-19 bronchoalveolar lavage fluid (BALF) samples (Liao et al., 2020) revealed the proportion of NK cells expressing higher levels of AREG and CXCR4 to be increased in severe COVID-19 (Figure 7C). Multicolor flow cytometry (MCFC) confirmed CXCR4 upregulation on circulating CD56dim NK cells (Figures 7D, S7A, and S7B) and AR expression on NK cells in late severe COVID-19 (Figure 7E).
Figure 7.

COVID-19 NK cells display impaired anti-fibrotic activity
(A) Rank-rank analysis plot indicating commonly up- and downregulated genes.
(B) Heatmap showing the average log FCs of commonly up- and downregulated genes identified in (A).
(C) Violin plots showing AREG and CXCR4 gene expression. FDR-corrected KW p values are indicated.
(D) CXCR4 expression (mean fluorescence intensity [MFI]) on CD56dim NK cells in week 3+ severe COVID-19 versus controls. Unpaired t test ∗∗∗p ≤ 0.001.
(E) Frequency of amphiregulin(+) NK cells in week 3 severe COVID-19 versus controls control. Unpaired t test ∗∗∗p ≤ 0.001.
(F) Amphiregulin expression on NK cells incubated with plasma.
(G) CXCR4 expression on NK cells incubated with plasma.
(H) Violin plots showing gene expression level of genes identified in (B). NSIP, non-specific interstitial pneumonia; IPF, idiopathic pulmonary fibrosis. KW and Dunn’s multiple comparison test (ns: p > 0.05, ∗p ≤ 0.05, ∗∗p ≤ 0.01, ∗∗∗p ≤ 0.001, ∗∗∗∗p ≤ 0.0001).
(I) mRNA expression of COL1A1 and ACTA-2 in human lung fibroblasts following co-incubation with or without NK cells
(J) NK cell-mediated induction of active caspase-3 in human lung fibroblasts.
Statistical analysis in (F) and (I): KW test corrected for multiple comparison by controlling FDR (BKY) was performed; ns, ∗p ≤ 0.05; ∗∗p ≤ 0.01, ∗∗∗p ≤ 0.001, ∗∗∗∗p ≤ 0.0001.
For n, see Table S6.
Plasma from severe COVID-19 patients but not controls upregulated CXCR4 and AR (Figures 7F and 7G). We observed a positive correlation between the post-culture expression of CXCR4 and AR (Figure S7C), resembling our findings on the transcriptome level (Figure S7D). Similar to severe COVID-19 (Figures 7C and S7E), upregulation of AREG, DUSP2, ZFP36L2, and TSC22D3 in pulmonary NK cells is also found in lung fibrosis (Habermann et al., 2020) (Figure 7H). To test the impact of COVID-19 NK cells on fibrotic activity of human lung fibroblasts, expression of the pro-fibrotic marker genes COL1A1 and ACTA2 were assessed (Figures 7I, 7J, and S7F–S7H). Incubation with non-activated peripheral NK cells from COVID-19 patients had no effect on the expression of pro-fibrotic genes in the fibroblasts (Figure S7F). However, after activation with IL-2, NK cells from control individuals reduced the expression of pro-fibrotic genes in fibroblasts, which was not the case after incubation with severe COVID-19 NK cells (Figure 7I). Following activation with IL-2, NK cells from severe COVID-19 were impaired in inducing active caspase-3 compared to controls and moderate COVID-19 in human lung fibroblasts (Figures 7J and S7G). Without activation, COVID-19 NK cells induced lower caspase-3 than control NK cells, though no difference was observed regarding disease severity (Figure S7H). Moreover, we observed that AREG expression negatively correlated with several genes involved in cytotoxic NK cell functions (Figure S7I), which might indicate a high expression of AREG to define an NK cell population with low anti-fibrotic activity.
Collectively, these data support a diminished role of NK cells in prohibiting fibrosis development in COVID-19.
Discussion
NK cells are an essential part of the innate immune response and are importantly involved in antiviral immune responses (Björkström et al., 2011; Blom et al., 2016; Kokordelis et al., 2014). Increased intra-pulmonary NK cell frequencies (Chua et al., 2020; Liao et al., 2020; Xu et al., 2020) and anti-Spike-dependent NK cell responses observed in vaccinated macaques (Yu et al., 2020) suggest that NK cells also may play a role in SARS-CoV-2 infection. However, our understanding of the role of NK cells in COVID-19 is still limited. Here, we combined single-cell transcriptomics and proteomics together with comprehensive functional analyses for in-depth longitudinal characterization of NK cells during acute COVID-19. We analyzed a total of 205 patients (403 samples; days 2 to 41 after symptoms onset) from four independent cohorts, which also allowed for cross-validation of our findings.
In line with earlier studies, we found COVID-19 to be associated with a decrease in circulating NK cells (Giamarellos-Bourboulis et al., 2020; Jiang et al., 2020; Wang et al., 2020b; Wilk et al., 2020) and validated expression of NK cell activation markers, especially in severe COVID-19 (Maucourant et al., 2020; Varchetta et al., 2020).
We found increased expression of ISGs and genes involved in IFN-α signaling to be characteristic for NK cells in severe COVID-19, whereas in moderate disease, an upregulation of TNF-related genes was observed. Integrating our findings with earlier reports (Arunachalam et al., 2020; Blanco-Melo et al., 2020; Hadjadj et al., 2020; Lucas et al., 2020; Schulte-Schrepping et al., 2020; Stephenson et al., 2021; Su et al., 2020), a picture emerges in which a type I IFN response is seen in early disease with a subsequent decline of IFN-mediated signatures after week 1 in moderate COVID-19 while they stay elevated during week 2 in severe disease. Cross-regulation by different cytokines may play a role and explain our finding of downregulated expression of TNF-related genes in severe disease despite TNF plasma levels being similar or even higher than in moderate COVID-19. Indeed, TNF increased IFN-α-induced ISG expression, whereas IFN-α prevented upregulation of TNF-related genes in NK cells, indicating a cross-regulatory interaction of these two cytokines (Cantaert et al., 2010; Karki et al., 2021). The clinical relevance of the dysregulated IFN-α response in early COVID-19 was supported by our findings that plasma levels in week 1 were positively correlated to clinical parameters such as SOFA score and WHO severity grade and our observation that an IFN-α imprint clearly discriminated between patients with fatal outcome and those that eventually recovered. Thus, further studies are needed to fully address the role of differential IFN-α versus TNF responses in COVID-19.
We further demonstrated that NK cells exert anti-SARS-CoV-2 activity but are functionally impaired in COVID-19. Type I IFNs have been shown to be of critical importance for IFN-γ production by NK cells in several viral infections (Baranek et al., 2012, Lee et al., 2017). Conversely, type I IFN can also suppress this NK cell function (Ahlenstiel et al., 2011, Lee et al., 2019), depending on the timing and the extent of type I IFN produced (Marshall et al., 2006). For instance, NK cells exert a basally high sensitivity to IFN-mediated STAT4 activation for IFN-γ production but increase in IFN-α production during virus infection, which results in an increase in STAT1, thereby inhibiting IFN-γ production (Miyagi et al., 2007). Such a scenario, in which a robust and punctual IFN-α response early after infection promotes effective antiviral immunity while a prolonged and excessive IFN-α production is detrimental, may also be relevant regarding the observed association of inborn errors in IFN-α immunity (Zhang et al., 2020) or autoantibodies against type I IFNs (Bastard et al., 2020) with life-threatening COVID-19. Here, dysregulation of IFN-α responses due to genetic defects or the pre-existence of autoantibodies may promote viral spread and propagation in the lung, while longer lasting and excessive IFN-α production may finally result in impaired immune responses as observed in our study. However, impaired NK cell function was also observed after the decline of IFN-α plasma levels and normalization of ISG expression. Furthermore, blocking IFN-α with a specific antibody was insufficient to prevent NK cell dysfunction induced by COVID-19 plasma, indicating additional factors are involved.
Our data also suggest that NK cell dysfunction not only affects antiviral immune responses but may also be relevant with respect to the development of fibrotic lung disease in severe COVID-19. NK cells have been shown to limit hepatic and cardiac fibrosis progression (Ong et al., 2015, Radaeva et al., 2006) and impaired antifibrotic NK cell activity has been associated with accelerated liver fibrosis (Glässner et al., 2013). Here, we found that NK cells in late-phase severe COVID-19 display a decreased antifibrotic capacity. Of note, NK cells in the later stage of severe COVID-19 expressed high levels of ZFP36L2 and TSC22D3, which have been linked with immunosuppressive effects in memory T cells (Salerno et al., 2018; Yang et al., 2019b) and thus may also interfere with NK cell activity. On the other hand, we found NK cells in late severe COVID-19 to display an increased expression of DUSP2 and high surface expression of CD69 and CD38, indicating ongoing cell activation and inflammatory cell signaling (Jeffrey et al., 2006), which have been shown to induce NK cell dysfunction (Alvarez et al., 2019, Merino et al., 2019). Moreover, we observed an elevated expression of AREG, encoding AR both in circulating and lung NK cells. Data regarding the role of AR in lung fibrosis are controversial (Branzk et al., 2014; Ding et al., 2016; Monticelli et al., 2011), and little is known regarding the role of amphiregulin-expressing NK cells. Interestingly, the increased expression of AREG, DUSP2, ZFP36L2, and TSC22D3 was also shown in pulmonary NK cells in non-specific interstitial pneumonia (NSIP) and idiopathic pulmonary fibrosis, a fibrotic lung disease which resembles COVID-19 with respect to radiological and clinical findings.
Collectively, our study points to differential IFN-α versus TNF responses as an important mechanism in the early phase of COVID-19 and describes a link between an exaggerated, prolonged IFN-α-induced NK cell response and persistent NK cell dysfunction with an unfavorable course of the disease.
Limitations of the study
Small differences in scRNA-seq analysis between the 4 cohorts might be explained by different geographical location, local SARS-CoV-2 variants, different experimental setups, or different sampling strategy, e.g., longitudinal (cohorts 1–3) versus cross-sectional sampling (cohort 4). Still, longitudinal studies of COVID19 utilizing single cell omics are rare, and it would be probably beneficial if, for cell types such as NK cells but most likely even more important for other rare immune cell types, additional studies are conducted that would allow an increase in the number of patients and the number of cells to be analyzed.
Our study uncovered soluble factors to be responsible for NK cell dysfunction, as evident from experiments using patients’ plasma. Yet, while we excluded many options, further studies are necessary to clarify which other components might account for this effect.
Consortia
The members of DeCOI are Janine Altmüller, Angel Angelov, Anna C. Aschenbrenner, Robert Bals, Alexander Bartholomäus, Anke Becker, Matthias Becker, Daniela Bezdan, Michael Bitzer, Conny Blumert, Ezio Bonifacio, Peer Bork, Bunk Boyke, Helmut Blum, Nicolas Casadei, Thomas Clavel, Maria Colome-Tatche, Markus Cornberg, Inti Alberto De La Rosa Velázquez, Andreas Diefenbach, Alexander Dilthey, Nicole Fischer, Konrad Förstner, Sören Franzenburg, Julia-Stefanie Frick, Gisela Gabernet, Julien Gagneur, Tina Ganzenmueller, Marie Gauder, Janina Geißert, Alexander Goesmann, Siri Göpel, Adam Grundhoff, Hajo Grundmann, Torsten Hain, Frank Hanses, Ute Hehr, André Heimbach, Marius Hoeper, Friedemann Horn, Daniel Hübschmann, Michael Hummel, Thomas Iftner, Angelika Iftner, Thomas Illig, Stefan Janssen, Jörn Kalinowski, René Kallies, Birte Kehr, Andreas Keller, Oliver T. Keppler, Sarah Kim-Hellmuth, Christoph Klein, Michael Knop, Oliver Kohlbacher, Karl Köhrer, Jan Korbel, Peter G. Kremsner, Denise Kühnert, Ingo Kurth, Markus Landthaler, Yang Li, Kerstin U. Ludwig, Oliwia Makarewicz, Federico Marini, Manja Marz, Alice C. McHardy, Christian Mertes, Maximilian Münchhoff, Sven Nahnsen, Markus Nöthen, Francine Ntoumi, Peter Nürnberg, Stephan Ossowski, Jörg Overmann, Silke Peter, Klaus Pfeffer, Isabell Pink, Anna R. Poetsch, Ulrike Protzer, Alfred Pühler, Nikolaus Rajewsky, Markus Ralser, Kristin Reiche, Olaf Rieß, Stephan Ripke, Ulisses Nunes da Rocha, Philip Rosenstiel, Antoine-Emmanuel Saliba, Leif Erik Sander, Birgit Sawitzki, Simone Scheithauer, Philipp Schiffer, Jonathan Schmid-Burgk, Wulf Schneider, Eva-Christina Schulte, Joachim L. Schultze, Alexander Sczyrba, Mariam L. Sharaf, Yogesh Singh, Michael Sonnabend, Oliver Stegle, Jens Stoye, Fabian Theis, Thomas Ulas, Janne Vehreschild, Thirumalaisamy P. Velavan, Jörg Vogel, Sonja Volland, Max von Kleist, Andreas Walker, Jörn Walter, Dagmar Wieczorek, Sylke Winkler, and John Ziebuhr.
STAR★Methods
Key resources table
| REAGENT or RESOURCES | SOURCE | IDENTIFIER |
|---|---|---|
| Antibodies | ||
| A0251 anti-human Hashtag 1 | Biolegend | Cat# 394601; RRID:AB_2750015 |
| A0252 anti-human Hashtag 2 | Biolegend | Cat# 394603; RRID:AB_2750016 |
| A0253 anti-human Hashtag 3 | Biolegend | Cat# 394605; RRID:AB_2750017 |
| A0254 anti-human Hashtag 4 | Biolegend | Cat# 394607; RRID:AB_2750018 |
| A0255 anti-human Hashtag 5 | Biolegend | Cat# 394609; RRID:AB_2750019 |
| A0256 anti-human Hashtag 6 | Biolegend | Cat# 394611; RRID:AB_2750020 |
| A0257 anti-human Hashtag 7 | Biolegend | Cat# 394613; RRID:AB_2750021 |
| active Caspase 3 PE | BD | Cat# 550914; RRID:AB_393957 |
| Amphiregulin APC | ebioscience | Cat# 17-5370-42; RRID: AB_2716941 |
| Anti-APC 163Dy | Fluidigm | Cat# 3163001B; RRID:AB_2687636 |
| B2M purified (2M2) | Biolegend | Cat# 316302; RRID:AB_492835 |
| BDCA-2 FITC (AC144) | Miltenyi | Cat# 130-113-197; RRID: AB_2726017 |
| CCR7 BV785 (G043H7) | Biolegend | Cat# 353229; RRID: AB_2561371 |
| CD10 158Gd (HI10a) | Fluidigm | Cat# 3158011B |
| CD107a Fitc (H4A3) | BD PharMingen | Cat# 555800; RRID: AB_396134 |
| CD107a PE-Cy7 | Biolegend | Cat# 328618; RRID: AB_11147955 |
| CD11b purified (ICRF44) | Biolegend | Cat# 301337; RRID:AB_2562811 |
| CD11c BUV661 (B-ly6) | BD Bioscience | Cat# 565067; AB_2744275 |
| CD11c PE/Cy5 (B-ly6) | Becton Dickinson | Cat# 551077; RRID:AB_394034 |
| CD11c purified (Bu15) | Biolegend | Cat# 337221; RRID:AB_2562834 |
| CD123 143Nd (6H6) | Fluidigm | Cat# 3143014B; RRID:AB_2811081 |
| CD123 BV786 (6H6) | Biolegend | Cat# 306032; RRID: AB_2566448 |
| CD137 173Yb (4B4-1) | Fluidigm | Cat# 3173015B |
| CD138 145Nd (DL101) | Fluidigm | Cat# 3145003B |
| CD14 160Gd (RMO52) | Fluidigm | Cat# 3160006; RRID:AB_2661801 |
| CD14 FITC (M5E2) | Biolegend | Cat# 301804; RRID: AB_314186 |
| CD14 PerCp-Cy5.5 (MϕP9) | Becton Dickinson | Cat# 562692; RRID:AB_2737726 |
| CD14 viogreen (REA599) | Miltenyi | Cat# 130-110-525; RRID: AB_2655057 |
| CD15 144Nd (W6D3) | Fluidigm | Cat# 3144019B |
| CD155 purified (REA1081) | Miltenyi Biotec | Produced at request |
| CD16 209Bi (3G8) | Fluidigm | Cat# 3209002B; RRID:AB_2756431 |
| CD16 BV605 (3G8) | Biolegend | Cat# 302039; RRID:AB_2561354 |
| CD16 PerCP-e710 (3G8) | Biolegend | Cat# 302030; RRID: AB_94038 |
| CD160 APC (BY55) | Biolegend | Cat# 341208; RRID: AB_2561435 |
| CD161 purified (HP-3G10) | Biolegend | Cat# 339919; RRID:AB_2562836 |
| CD19 142Nd (HIB-19) | Fluidigm | Cat# 3142001; RRID:AB_2651155 |
| CD19 APC/Fire 750 (HIB19) | Biolegend | Cat# 302258; RRID:AB_2629691 |
| CD19 BV421 (HIB19) | Biolegend | Cat# 302234; RRID: AB_11142678 |
| CD19 FITC (HIB19) | Biolegend | Cat# 302206; RRID: AB_314236 |
| CD19 viogreen (REA675) | Miltenyi | Cat# 130-113-649; RRID: AB_2726202 |
| CD196 141Pr (G034E3) | Fluidigm | Cat# 3141003A; RRID:AB_2687639 |
| CD1a FITC (HI149) | Biolegend | Cat# 300104; RRID: AB_314018 |
| CD1c AlexaFluor700 (L161) | Biolegend | Cat# 331530; RRID:AB_2563657 |
| CD1c purified (L161) | Biolegend | Cat# 331502; RRID:AB_1088995 |
| CD20 FITC (2H7) | Biolegend | Cat# 302304; RRID: AB_314252 |
| CD20 viogreen (LT 20) | Miltenyi | Cat# 130-113-379; RRID: AB_2726147 |
| CD203c APC (NP4D6) | Biolegend | Cat# 324609; RRID:AB_2099774 |
| CD206 purified (152) | Biolegend | Cat# 321127; RRID:AB_2563729 |
| CD21 purified (Bu32) | Biolegend | Cat# 354902; RRID:AB_11219188 |
| CD223 BV421 | Biolegend | Cat# 369314; RRID: AB_2629797 |
| CD226 purified (REA1040) | Miltenyi Biotec | Produced at request |
| CD235ab Biotin (HIR2) | Biolegend | Cat# 306618; RRID:AB_2565773 |
| CD24 169Tm (ML5) | Fluidigm | Cat# 3169004B; RRID:AB_2688021 |
| CD24 APC (ML5) | Biolegend | Cat# 311118 |
| CD25 169Tm (2A3) | Fluidigm | Cat# 3169003; RRID:AB_2661806 |
| CD27 155Gd (L128) | Fluidigm | Cat# 3155001B; RRID:AB_2687645 |
| CD27 PE | Biolegend | Cat# 356406; RRID: AB_2561825 |
| CD28 purified (L293) | BD Bioscience | Cat# 348040; RRID:AB_400367 |
| CD294 163Dy (BM16) | Fluidigm | Cat# 3163003B; RRID:AB_2810253 |
| CD3 FITC (UCHT1) | Biolegend | Cat# 300406; RRID: AB_314060 |
| CD3 PE/Dazzle (UCHT1) | Biolegend | Cat# 300450; RRID:AB_2563618 |
| CD3 purified (UCHT1) | Biolegend | Cat# 300443; RRID:AB_2562808 |
| CD3 viogreen (REA613) | Miltenyi | Cat# 130-113-142; RRID: AB_272597 |
| CD33 158Gd (WM53) | Fluidigm | Cat# 3158001; RRID:AB_2661799 |
| CD34 166Er (581) | Fluidigm | Cat# 3166012B; RRID:AB_2756424 |
| CD34 FITC (581) | Biolegend | Cat# 343504; RRID: AB_1731852 |
| CD38 167Er (HIT2) | Fluidigm | Cat# 3167001B; RRID:AB_2802110 |
| CD38 AF700 (HIT2) | Biolegend | Cat# 303542; RRID: AB_2072781 |
| CD38 BUV395 | BD | Cat# 563811; RRID: AB_2744372 |
| CD38 PE-Cy7 (REA572) | Miltenyi | Cat# 130-099-158; RRID: AB_2660383 |
| CD4 BV510 (OKT4) | Biolegend | Cat# 317444; RRID:AB_2561866 |
| CD44 purified (BJ18) | Biolegend | Cat# 338811; RRID:AB_2562835 |
| CD45 89Y (HI30) | Fluidigm | Cat# 3089003; RRID:AB_2661851 |
| CD45 BUV395 | BD | Cat# 563792; RRID: AB_2869519 |
| CD45 BV711 (HI30) | Biolegend | Cat# 304050; RRID:AB_2563466 |
| CD45RO purified (4G11) | DRFZ Berlin | N/A |
| CD49a PerCP-eFluor 710 (TS2/7) | Invitrogen | Cat# 46-9490-42; RRID: AB_2573891 |
| CD56 176Yb (NCAM16.2) | Fluidigm | Cat# 3176008; RRID:AB_2661813 |
| CD56 BUV563 (NCAM16.2) | BD | Cat# 565704; RRID: AB_2744431 |
| CD56 PE (MY31) | Becton Dickinson | Cat# 345810; RRID:AB_396511 |
| CD57 APC | Biolegend | Cat# 359610; RRID: AB_2562757 |
| CD57 BV421 (NK-1) | BD Horizon | Cat# 563869; RRID: AB_2632391 |
| CD62L 153Eu (DREG56) | Fluidigm | Cat# 3153004B; RRID:AB_2810245 |
| CD62L purified (DREG56) | Biolegend | Cat# 304835; RRID:AB_2563758 |
| CD64 146Nd (10.1) | Fluidigm | Cat# 3146006; RRID:AB_2661790 |
| CD66b FITC (G10F5) | Biolegend | Cat# 305104; RRID:AB_314496 |
| CD69 162Dy (FN50) | Fluidigm | Cat# 3162001B |
| CD69 AF700 | Biolegend | Cat# 310922; RRID: AB_493775 |
| CD69 APC (FN50) | Biolegend | Cat# 310910; RRID: AB_314844 |
| CD8 BV785 (SK1) | Biolegend | Cat# 344740; RRID:AB_2566202 |
| CD8A purified (GN11) | DRFZ Berlin | N/A |
| CD94 BUV737 (HP-3D9) | BD | Cat# 748787; RRID: AB_2873190 |
| CD94 FITC | Biolegend | Cat# 305504; RRID: AB_314534 |
| CD95 | BV711 | Cat# 305644; RRID: AB_2632623 |
| CD95 purified (DX2) | Biolegend | Cat# 305631; RRID:AB_2563766 |
| CD96 purified (REA195) | Miltenyi Biotec | Produced at request |
| CXCR3 156Gd (G025H7) | Fluidigm | Cat# 3156004B; RRID:AB_2687646 |
| CXCR3 BV605 | Biolegend | Cat# 353728; RRID: AB_2563157 |
| CXCR4 Dazzle | Biolegend | Cat# 306526; RRID: AB_2564065 |
| CXCR5 164Dy (51505) | Fluidigm | Cat# 3164016B; RRID:AB_2687858 |
| DNAM AF700 (#102511) | R&D | Cat# FAB666N; RRID: AB_2072626 |
| e670 live dye | ebioscience | Cat# 65-0840-85 |
| EOMES FITC | ebioscience | Cat# 11-4877-42; RRID: AB_2572499 |
| FASL | BV786 | Cat# 744102; RRID: AB_2741996 |
| FC Blocking Reagent | Miltenyi | Cat# 130-059-901 |
| FceRI 150Nd (AER-37) | Fluidigm | Cat# Cat# 3150027B |
| FcERJa FITC (AER-37) | Biolegend | Cat# 334608; RRID: AB_1227653 |
| Granzyme B | Biolegend | Cat# 372208; RRID: AB_2687032 |
| Granzyme B PE (GB11) | BD | Cat# 561142; RRID: AB_10561690 |
| HLA-DR BV421 (L243) | Biolegend | Cat# 307635; RRID:AB_10897449 |
| HLA-DR PE-Vio770 (L243) | Biolegend | Cat# 307616; RRID: AB_493588 |
| HLA-DR purified (L243) | Biolegend | Cat# 307602; RRID:AB_314680 |
| ICOS 148Nd (C398.4A) | Fluidigm | Cat# 3148019B; RRID:AB_2756435 |
| IFNabR1 | R&D Systems | Cat# AF245; RRID: AB_355270 |
| IFNG BV421 (4S.B3) | Biolegend | Cat# 502532; RRID AB_2561398 |
| IgD BV605 (IA6-2) | Biolegend | Cat# 348232; RRID: AB_2563337 |
| IgD purified (IgD26) | Biolegend | Cat# 348235; RRID:AB_2563775 |
| IgG1 isotype | Biolegend | |
| IgM APC fire (MHM-88) | Biolegend | Cat# 314546; RRID: AB_2800834 |
| IgM purified (MHM-88) | Biolegend | Cat# 314502; RRID:AB_493003 |
| IL10 | Biolegend | Cat# 501401; RRID: AB_315167 |
| IL-12/IL-23 p40 | Biolegend | Cat# 501813; RRID: AB_315195 |
| IL1b | Novus | Cat# AF-201-SP; RRID: AB_354387 |
| IL32-Biotin | Biolegend | Cat# 513503; RRID: AB_2124017 |
| IL4 | Biolegend | Cat# 500837; RRID: AB_2810615 |
| IL6 | Biolegend | Cat# 501101; RRID: AB_315149 |
| Ki-67 | Biolegend | Cat# 350506; RRID: AB_2563860 |
| Ki67 168Er (Ki-67) | Fluidigm | Cat# 3168007B; RRID:AB_2800467 |
| KLRF1 purified (REA845) | Miltenyi Biotec | Produced at request |
| KLRG1 Dazzle (14C2A07) | Biolegend | Cat# 368608; RRID: AB_2572135 |
| KLRG1 purified (REA261) | Miltenyi Biotec | Produced at request |
| Lag3 purified (11C3C65) | Biolegend | Cat# 369302; RRID:AB_2616876 |
| NKG2A PE | Miltenyi | Cat# 130-113-566; RRID: AB_2726171 |
| NKG2c BUV650 (134591) | BD OptiBuild | Cat# 748165; RRID: AB_2872626 |
| NKp30 BV711 | Biolegend | Cat# 325228; RRID: AB_2810488 |
| NKp46 BV786 (9E 2) | BD Bioscience | Cat# 563329; RRID: AB_2738139 |
| NKp80 APC- Vio 770 (REA845) | Miltenyi | Cat# 130-112-593; RRID: AB_2653031 |
| NKp80 FITC | Miltenyi | Cat# 130-112-594; RRID: AB_2653020 |
| PD-1 175Lu (EH12.2H7) | Fluidigm | Cat# 3175008; RRID:AB_2687629 |
| PD-1 Pe/Cy7 (J105) | eBioscience | Cat# 25-2799-42; RRID: AB_10853804 |
| PD-L1 175Lu (29.E2A3) | Fluidigm | Cat# 3175017B; RRID:AB_2687638 |
| Perforin BV421 (dG9) | Biolegend | Cat# 308122; RRID: AB_2566204 |
| RANK purified (80704) | R&D Systems | Cat# MAB683; RRID:AB_2205330 |
| RANKL APC | Miltenyi Biotec | Cat# 130-098-511; RRID:AB_2656691 |
| SARS Cov-2 Spike specific nanobody AF488 | https://doi.org/10.1126/science.abe6230 | N/A |
| SARS-Cov-2 Nucleocapsid | Sinobiological | SIN-40588-V08B-100 |
| Siglec 8 164Dy (7C9) | Fluidigm | Cat# 3164017B |
| Siglec8 PE/Cy7 (7C9) | Biolegend | Cat# 347112; RRID:AB_2629720 |
| Streptavidin BV786 | Biolegend | Cat# 405249 |
| TBET BV711 (16893) | BD | Cat# 563320; RRID: AB_2738136 |
| TCR a/b viogreen (REA652) | Miltenyi | Cat# 130-119-709; RRID: AB_2751815 |
| TCRa/b FITC (IP26) | Biolegend | Cat# 306706; RRID: AB_314644 |
| TCRgd purified (11F2) | Miltenyi Biotec | Produced at request |
| TCRy/d FITC (B1) | Biolegend | Cat# 331208; RRID: AB_1575108 |
| TIGIT 153Eu (MBSA43) | Fluidigm | Cat# 3153019B; RRID:AB_2756419 |
| TIGIT Dazzle (A15153G) | Biolegend | Cat# 372716; RRID: AB_2632931 |
| Tim-3 Fitc (F38-2E2) | eBioscience | Cat# 11-3109-42; RRID: AB_2572488 |
| TNFa | Biolegend | Cat# 502805; RRID: AB_2814397 |
| TNF-a BV785 (FN50) | BD | Cat# 502948; RRID: AB_2565858 |
| Chemicals, peptides, and recombinant proteins | ||
| BD Horizon Brilliant Stain Buffer | Becton Dickinson | Cat# 563794 |
| RBC lysis buffer 10X | Biolegend | Cat# 420301 |
| Pierce 16% Formaldehyde (w/v), Methanol-free | Thermo Fisher | Cat# 28908 |
| Fetal Bovine Serum | PAN Biotec | Cat# 3302 |
| Stain Buffer (FBS) | Becton Dickinson | Cat# 554656 |
| Pancoll human, Density: 1.077 g/ml | Pan Biotech | Cat# P04-601000 |
| FcR Blocking Reagent, human | Miltenyi | Cat# 130-059-901 |
| Cell-ID Intercalator-Ir | Fluidigm | Cat# 201192A |
| Permeabilization buffer 10X | eBioscience | Cat# 00-8333-56 |
| Maxpar PBS | Fluidigm | Cat# 201058 |
| Maxpar Cell Staining buffer | Fluidigm | Cat# 201068 |
| Maxpar X8 Multimetal Labeling Kit | Fluidigm | Cat# 201300 |
| Proteomic stabilizer | Smart Tube Inc. | Cat# PROT1 |
| KAPA HiFi HotStart Ready Mix | Roche | Cat# KK2601 |
| Human Tru Stain FcX | Biolegend | Cat# 422301 |
| SPRIselect | Beckmann Coulter | Cat# B23318 |
| MagniSort Negative Selection Beads | Thermo Fisher | Cat# MSNB-6002-74 |
| Lysercell WDF | Sysmex | Cat# AL-337-564 |
| Fluorocell WDF | Sysmex | Cat# CV-377-552 |
| IL2(IS) | Milenyi | Cat# 130-097-748 |
| IFNa | Milenyi | Cat# 130-095-066 |
| IL10 | Immunotools | Cat# 11340103 |
| IL6 | Immunotools | Cat# 11340064 |
| Amphiregulin | PeproTech | Cat# 100-55B |
| TNFa | Immunotools | Cat# 11343015 |
| Human IFN-g1b premium grade | Miltenyi Biotec | Cat# 130-096-481 |
| Antibiotic-Antimyotic | GIBCO Life | Cat# 15240-062 |
| Human Serum AB Plasma | Sigma | Cat# H3667-100ml |
| Fetal bovine serum low in endotoxin A.H. | Sigma Aldrich | Cat# F7524-500ml |
| HS-Nuclease, rec. 50.000U | MoBiTec | Cat# GE-NUC10700-01 |
| 20% Human-Albumin Behring, salzarm | CSL Behring | Cat# PZN-01468366 |
| BD Cytofix/Cytoperm | BD | Cat# 51-2090KZ |
| BD Perm/Wash | BD | Cat# 51-2091KZ |
| Cell Fix | BD | Cat# 340181 |
| Spherotech ultra Rainbow beads | SpheroTech | Cat# URCP01-30-10K |
| Critical commercial assays | ||
| LIVE/DEAD Fixable Yellow Dead Cell Stain Kit | Thermo Fisher | Cat# L34967 |
| Zombie aqua | Biolegend | Cat# 423102 |
| LEGENDplex Human Inflammation Panel 1 (Mix&Match) | Biolegend | Cat# 740809 |
| Human Single-Cell Multiplexing Kit | Becton Dickinson | Cat# 633781 |
| BD Rhapsody WTA Amplification Kit | Becton Dickinson | Cat# 633801 |
| BD Rhapsody Cartridge Kit | Becton Dickinson | Cat# 633733 |
| BD Rhapsody cDNA Kit | Becton Dickinson | Cat# 633773 |
| High Sensitivity D5000 ScreenTape | Agilent | Cat# 5067-5592 |
| Qubit dsDNA HS Assay Kit | ThermoFisher | Cat# Q32854 |
| Chromium Next GEM Single Cell 3′ GEM, Library & Gel Bead Kit v3.1 | 10x genomics | Cat# 1000121 |
| Chromium Next GEM Chip G Single Cell Kit | 10x genomics | Cat# 1000120 |
| Single Index Kit T Set A | 10x genomics | Cat# 1000213 |
| High Sensitivity DNA Kit | Agilent | Cat# 5067-4626 |
| NovaSeq 6000 S1 Reagent Kit (100 cycle) | Illumina | Cat# 200012865 |
| NovaSeq 6000 S2 Reagent Kit (100 cycle) | Illumina | Cat# 20012862 |
| NovaSeq 6000 S2 Reagent Kit (200 cycles) | Illumina | Cat# 20040326 |
| NovaSeq 6000 S2 Reagent Kit (200 cycles) | Illumina | Cat# 20040326 |
| NextSeq 500/550 High Output Kit v2.5 (150 Cycles) | Illumina | Cat# 20024907 |
| Pan Monocyte Isolation Kit, human | Miltenyi | Cat# 130-096-537 |
| CE/IVD Phagoburst | BD Biosciences | Cat# 341058 |
| CD/IVD PHAGOTEST | BD Biosciences | Cat# 341060 |
| NK Cell Isolation Kit, human | Miltenyi Biotec | Cat# 130-092-657 |
| Deposited data | ||
| scRNA-seq raw data | This paper | EGAS00001004571 |
| Processed scRNA-seq count data and code | This paper | https://beta.fastgenomics.org/p/Kraemer_2021_COVID19_NK |
| Tables S1, S2, S3, and S4 | This paper | https://data.mendeley.com/datasets/hwxhw2sxys/1 |
| Experimental models: Cell lines | ||
| VERO C1008 [Vero E6] | ATCC | Cat# CRL-1586 |
| CaCo-2 | ATCC | Cat# HTB-37 |
| Primary human lung fibroblasts | PromoCell | Cat# C-12360 |
| Oligonucleotides | ||
| See Table S8 for comprehensive list of oligonucleotides | ||
| Software and algorithms | ||
| CellRanger | 10x genomics | v3.1.0 |
| Bcl2fastq2 | Illumina | v2.20 |
| STAR | (Dobin et al., 2013) | v2.6.1b |
| Cutadapt | (Martin, 2011) | v1.16 |
| Dropseq-tools | https://github.com/broadinstitute/Drop-seq/ | v2.0.0 |
| R | https://www.cran.r-project.org | v3.6.2 |
| Seurat (R package) | (Butler et al., 2018, Stuart et al., 2019) | v3.1.4, v3.1.2 (CRAN) |
| Harmony (R package) | (Korsunsky et al., 2019) (https://github.com/immunogenomics/harmony) | v1.0 |
| Destiny (R package) | (Angerer et al., 2016) | v 3.0.1 |
| ClusterProfiler (R package) | (Yu et al., 2012) | v3.10.1 (CRAN) |
| SingleR (R package) | (Aran et al., 2019) | v1.0.5 (Bioconductor) |
| DirichletReg (R package) | (Maier, 2021) | v0.6.3.1 (CRAN) |
| AUCell (R package) | (Aibar et al., 2017) | v1.6.1 (CRAN) |
| Cytobank | (Chen and Kotecha, 2014); https://www.cytobank.org | https://doi.org/10.1002/0471142956.cy1017s53 |
| SPADE (Cytobank) | (Qiu et al., 2011) | Cytobank is running a version of SPADE derived from v1.10.2 |
| flowCore (R package) | https://www.bioconductor.org/packages/release/bioc/html/flowCore.html | v1.48.1 (Bioconductor), 10.18129/B9.bioc.flowCore |
| CytoML (R package) | https://github.com/RGLab/CytoML | v1.8.1 (Bioconductor), 10.18129/B9.bioc.CytoML |
| CytofBatchAdjust (R package) | https://github.com/CUHIMSR/CytofBatchAdjust | https://doi.org/10.3389/fimmu.2019.02367 |
| uwot (R package) | https://cran.r-project.org/web/packages/uwot/index.html | v0.1.8 (CRAN) |
| ComplexHeatmap (R package) | (Gu et al., 2016) | v1.20.0 (Bioconductor) |
| lme4 (R package) | (Nowicka et al., 2017) | v1.1-21 (CRAN) |
| multcomp (R package) | (Hothorn et al., 2008) | v1.4-13 (CRAN) |
| lsmeans (R package) | (Lenth, 2016) | v2.30-0 (CRAN) |
| Prism (software) | https://www.graphpad.com | v8 and v9 |
| FlowJo | https://www.flowjo.com | v10.6.1 |
| Cytoscape | https://www.cytoscape.org | v3.7.1 (https://doi.org/10.1101/gr.1239303) |
| iRegulon | (Janky et al., 2014) | v1.3 |
| Corel Draw | https://www.coreldraw.com/ | v.22 |
Resource availability
Lead contact
Further information and requests for resources and reagents should be addressed to and will be fulfilled by the Lead Contact Jacob Nattermann (Jacob.Nattermann@ukbonn.de).
Materials availability
This study did not generate unique reagents.
Experimental model and subject details
Samples from patients with COVID-19 were collected within four cohort studies (Kurth et al., 2020) designed to allow deep molecular and immunological transcriptomic and proteomic profiling of COVID-19 in blood. Patients were classified according to the highest score on the World Health Organization (WHO) Ordinal Scale for Clinical Improvement ever present ((WHO. R&D Blueprint - novel Coronavirus - COVID-19 Therapeutic Trial Synopsis. 2020.https://www.who.int/blueprint/priority-diseases/key-action/COVID-19_Treatment_Trial_Design_Master_Protocol_synopsis_Final_18022020.pdf.). Patients for which sufficient material was available for scRNA-seq, CyTOF or flow cytometry analysis, were included in this study. This study was designed to describe immunological deviations in COVID-19 patients without intention of the development of new treatments or new diagnostics, and therefore sample size estimation was not included in the original study design.
Cohort 1 / Bonn cohort
This study was approved by the Institutional Review board of the University Hospital Bonn (073/19 and 134/20) and the University Hospital Duesseldorf (#5350). After providing written informed consent, 32 control donors and 36 COVID-19 patients (Figures 1A and 1B; Table S1) were included in the study. In patients who were not able to consent at the time of study enrollment, consent was obtained after recovery. Information on age, sex, medication, and comorbidities are listed in Table S1. COVID-19 patients who tested positive for SARS-CoV-2 RNA in nasopharyngeal swabs were recruited at the Department of Internal Medicine I of the University Hospital Bonn or the Department of Gastroenterology, Hepatology and Infectious Diseases, University Hospital Düsseldorf, between March 30 and November 11, 2020 and allocated to moderate (WHO 2-4) or severe (5-7) disease according to the WHO clinical ordinal scale. Controls in cohort 1 were collected from healthy people or from otherwise hospitalized patients with a wide range of diseases and comorbidities including chronic inflammatory immune responses. These individuals were either tested negative for SARS-CoV-2, serologically negative or samples were collected before November 2019.
For validation of the findings from our prospective cohorts, data from three independent additional cohorts were analyzed:
Cohort 2 / Berlin cohort
This study includes a subset of patients enrolled between March 2 and July 02, 2020 in the Pa-COVID-19 study, a prospective observational cohort study assessing pathophysiology and clinical characteristics of patients with COVID-19 at Charité Universitätsmedizin Berlin (Kurth et al., 2020). The study is approved by the Institutional Review board of Charité (EA2/066/20). Written informed consent was provided by all patients or legal representatives for participation in the study. The patient population included in all analyses of cohort 1 consists of 10 control donors (samples collected in 2019 before SARS-CoV-2 outbreak), 8 patients presenting with flu-like illness but tested SARS-CoV-2-negative, 12 moderate and 17 severe COVID-19 patients (Figures 1A and 1B; Table S1). Information on age, sex, medication, and co-morbidities is listed in Table S1. All COVID-19 patients were tested positive for SARS-CoV-2 RNA in nasopharyngeal swabs and allocated to mild (WHO 2-4) or severe (5-7) disease according to the WHO clinical ordinal scale. We also included publicly available single-cell transcriptome data derived from 22 control samples into the analysis; 3 samples were derived from 10x Genomics, San Francisco, CA 94111, USA (5k_pbmc_v3: https://support.10xgenomics.com/single-cell-gene-expression/datasets/3.0.2/5k_pbmc_v3, pbmc_10k_v3: https://support.10xgenomics.com/single-cell-gene-expression/datasets/3.0.0/pbmc_10k_v3, pbmc_1k_v3: https://support.10xgenomics.com/single-cell-gene-expression/datasets/3.0.0/pbmc_1k_v3), 19 samples derived from Reyes et al.(Reyes et al., 2020).
Cohort 3 / Kiel cohort
In cohort 3 (Bernardes et al., 2020) COVID-19 patients were sampled in two independent University hospitals (Cologne, Kiel) between April 1, 2020, and May 20, 2020. From this study, patients were enrolled in our analyses if cell numbers were sufficient to enable identification and in-depth analysis of NK cells. In total, 8 COVID-19 patients and 2 controls were included. Information on age, sex, medication, and co-morbidities is listed in Table S1.
Cohort 4 / UK and US cohort
In cohort 4, we combined datasets from the UK (Stephenson et al., 2021) and the US (Su et al., 2020). For the UK, COVID-19 patients were sampled at three different sites (Newcastle, Cambridge, London) between March 31, 2020 and July 20, 2020. For Newcastle, the study was approved by the Newcastle Biobank (research Ethics Committee (REC) no. 17/NE/0361; Integrated Research Application System (IRAS) no. 233551 and REC (17/YH/0021) for controls, for Cambridge, the study was approved by the East of England Cambridge Central Research Ethics Committee (NIHR BioResource, REC no. 17/EE/0025; “Genetic variation and altered leukocyte function in health and disease (GANDALF),” REC no. 08/H0308/176 and for London, the study was approved by the Living Airway Biobank, administered through UCL Great Ormond Street Institute of Child Health (REC no. 19/NW/0171, IRAS project no. 261511) as well as by the local R&D departments at the hospital. The US data was collected in Seattle and the study was approved by the Institutional Review Board (IRB) at Providence St. Joseph Health with IRB Study Number [STUDY2020000175] and the Western Institutional Review Board (WIRB) with IRB Study Number 20170658. For the UK cohort, each patient contributed to one sample while in the US, each patient was sampled exactly two times, therefore, the sampling strategy is rather cross-sectional. For comparison reasons, samples from COVID-19 patients that were sampled later than 4 weeks after symptom onset and samples from patients who received steroid treatment were removed from further analysis. After removal, a total of 30 controls with 40 samples and 110 COVID-19 patients with 161 samples were included in cohort 4. COVID-19 patients were allocated to moderate or severe disease by maximum WHO ordinal scale (US data) or “status_on_day_collection” (UK data). Information on age, sex, medication, and comorbidities are listed in Table S1.
Cell lines and primary human cells
Vero E6 cells, a cell line originating from Chlorocebus aethiops, were continuously maintained in complete DMEM medium at 37°C and passaged upon reaching 80% confluence. Prior to infection experiments, cells were seeded in 96-well flat bottom plates and cultured for 48h at 37°C.
Caco-2 cells, a cell line originating from a male human individual, were continuously maintained in EMEM medium at 37°C and cultured upon reaching 80% confluence. Prior to infection experiments, cells were seeded in 96-well flat bottom plates and maintained for 48h at 37°C.
Primary human lung fibroblasts were commercially obtained (PromoCell) and cultured in fibroblast media (PromoCell) at 37°C according to the manufacturer’s instructions. Cells were kept in culture no longer than to passage 4. For each passage, it was tested whether the cells could still be activated with recombinant TGFb1 after 2 days incubation at 37°C (10ng/ml; Miltenyi; readout PCR, see below). Prior to coincubation experiments, cells were seeded in 96-well flat bottom plates and maintained for 48 h at 37°C. Information on the sex of primary human lung fibroblasts remained undisclosed by provider.
All cells used are also listed in the Key resource table. No additional information on cell line authentication is provided.
Method details
Cell isolation (cohort 1)
Peripheral blood mononuclear cells (PBMC) were isolated using Ficoll-Paque gradient centrifugation (Biochrom AG, Berlin, Germany), washed with DPBS, and directly cryopreserved in RPMI-1640 supplemented with 10% DMSO (Sigma). The processing of cells for scRNaseq analysis was described for the 3 cohorts here (Bernardes et al., 2020; Schulte-Schrepping et al., 2020).
Phenotypic flow cytometry analysis (cohort 1)
Phenotypic analysis of cells was performed using an LSR-Fortessa Cytometer (BD Biosciences, USA). In brief, frozen cells were gently thawed at room temperature and transferred to a 14 mL tube. Then 2 mL of thawing medium (HBSS; 1% human serum albumin, CSL Behring; and 25 U/ml endonuclease, MoBiTec, Germany) was added dropwise, waited for 2 min and 8 mL of thawing medium was finally added gently. After 15 min at room temperature, cells were centrifuged at 300 g for 10 min and incubated with viability dye (Zombie-Aqua, Biolegend, 1:500) for 10 min. After further washing with DPBS (10 min, 300 g), cells were stained with appropriate antibody solutions in the Biolegend staining buffer. All antibodies were titrated, the panels were tested using FMO controls, and constant conditions were ensured by plate staining to guarantee an optimal staining result. To verify consistent fluorescence properties of the flow cytometer, calibration beads (ultra Rainbow beads, Spherotech) were applied before each measurement. The antibodies and panels used in this study are compiled for each corresponding Figure in Table S5. NK cells were defined as CD45+CD56+Lin- lymphocytes (Lin: CD3, TCRab, TCRgd, CD34, CD20, CD19, CD14) with exclusion of CD94-NKp80- cells.
For intracellular analyses of transcription factors the Foxp3 Transcription Factor Staining Kit (eBioscience, Germany) was used for permeabilization, fixation, and washing according to the manufacturer’s specifications. FC raw data was analyzed by FlowJo software V10.6.1 (BD Bioscience, USA).
Detection TNF and IFN signature genes
Purified NK cells from control donors were incubated with recombinant IFN-α (Immunotools, 1 or 10ng/ml) in combination with or without recombinant TNF (Immunotools, 10 or 25ng/ml) for 18h. Incubation was stopped with a lysis buffer from the RNA isolation kit (New England Biolabs, Monarch total RNA Mini Prep kit). After RNA isolation according to the manufacturer’s protocol, quality control using NanoDrop and transcription into cDNA (QuantiTect RT Kit, Quiagen) were performed. ISG (MX-1, IFI6 and ISG15) and TNF hallmark transcripts (MAP3K, TNF1IP3, and LITAF) were analyzed by qPCR (96-well LightCycler; Roche). Relative gene expression (duplicates) was calculated by 2-ΔCq method related to 2 housekeepers (geomean of RPL19 and EEF1). Primer sequences are listed in Table S7.
Functional flow cytometry analysis (cohort 1)
To assess ex vivo functionality of NK cells, PBMC from all study groups were thawed as described above and NK cells were isolated by negative magnetic separation according to the manufacturer’s instructions (negative NK cell isolation kit, Miltenyi). After checking purity on the flow cytometer (at least 90% CD56+CD3- of CD45+lymphocytes), NK cells (2x10⁵ cells per ml) were seeded and incubated with and without IL-2 (10ng/ml, Miltenyi), for 18h in defined DMEM/F12 media containing DMEM (GIBCO Life, USA) and F12 (2:1), 1% antibiotic and antimycotic (GIBCO Life, USA), 20 mg/mL ascorbic acid (Sigma, USA), 24 mM 2-mercaptoethanol (GIBCO Life, USA), 0.05 mg/mL sodium selenite (Sigma, USA), and 10% heat-inactivated human AB serum (Sigma, USA) based on previous protocols in 96-well round bottom wells. Alternatively, isolated NK cells (2x10⁵ cells per ml) were incubated with plasma from healthy controls, moderate and severe COVID-19 patients for 18h at a ratio of 1 to 5 in defined DMEM/F12 media. Afterward, NK cells were optionally co-incubated for 5h at a ratio of 1:2 with major histocompatibility complex-deficient K562 cells or co-incubated with a cytokine cocktail consisting of IL12 (10ng/ml, Immunotools), IL-15 (50ng/ml, Immunotools) and IL18 (50ng/ml, Immunotools) in defined DMEM/F12 media. After 1h stimulation, Brefeldin A (5 μg/ml; Enzo, Germany) was added for the remainder of the incubation. After staining with the viability dye Zombie Aqua (Biolegend, USA) and surface antibodies (see Key resource table), cells were permeabilized using the Cytofix/Cytoperm Kit according to the manufacturer (BD Biosciences, USA). NK cells were defined as CD56+Lin- lymphocytes (Lin: CD3, TCRab, CD34, CD20, CD19, CD14) with exclusion of CD94(-)Nkp80(-) cells.
IFN-γ and TNF were detected with specific antibodies by intracellular staining. FC raw data was analyzed by FlowJo software V10.6.1 (BD Bioscience, USA).
Further functional assays were performed to assess the impact of cytokine and SARS-CoV-2 Nucleocapsid stimulation on NK cell functionality. In this setting, purified NK cells (2x10⁵ cells per ml) from controls were seeded and incubated with and without IL-2 (10ng/ml, Miltenyi), TNF (Immunotools, 10ng/ml), IFN-α (Immunotools, 10ng/ml), IL-6 (Immunotools, 10ng/ml), or IL-10 (Immunotools, 10ng/ml), or SARS-CoV-2 Nucleocapsid (Sinobiological, 20, 200, or 2000ng/ml) for 18h in defined DMEM/F12 media containing DMEM (GIBCO Life, USA) and F12 (2:1), 1% antibiotic and antimycotic (GIBCO Life, USA), 20 mg/mL ascorbic acid (Sigma, USA), 24 mM 2-mercaptoethanol (GIBCO Life, USA), 0.05 mg/mL sodium selenite (Sigma, USA), and 10% heat-inactivated human AB serum (Sigma, USA) based on previous protocols in 96-well round bottom wells. After pre-stimulation, NK cells were optionally co-incubated for 5h at a ratio of 1:2 with major histocompatibility complex-deficient K562 cells or co-incubated with phorbol-12-myristate-13-acetate (PMA, 50ng/ml; Cell Signaling Technology Europe, Netherlands) and ionomycin (1μg/ml; Cell Signaling Technology Europe). Follow-up steps were performed as described above for detection of IFN-γ and TNF-α.
Furthermore, the impact of soluble plasma-derived factors on NK cell functionality was assessed. For this purpose, purified NK cells (2x10⁵ cells per ml) from all study groups were seeded and optionally incubated with plasma from healthy controls, moderate or severe COVID-19 patients or alternatively combined with specific blocking antibodies (IL-10, IL-12, IL-6, IL1b, IL-4, IFN-AR, TNF, ISO) for 18h at a ratio of 1 to 5 in defined DMEM/F12 media.
Afterward, NK cells were co-incubated for 5h at a ratio of 1:2 with major histocompatibility complex-deficient K562 cells. Follow-up steps were performed as described above for detection of IFN-γ and TNF.
Fibrosis assays (cohort 1)
To test fibrotic factors in vitro, 1x10⁴ primary human lung fibroblasts, seeded in 96-well flat bottom plates, were co-incubated with recombinant amphiregulin at 37°C and experiment was stopped with lysis buffer from the RNA isolation kit after 3 days (New England Biolabs, Monarch total RNA Mini Prep kit). After RNA isolation according to the manufacturer’s protocol, performing quality control using NanoDrop, and transcription into cDNA (QuantiTect RT Kit, Quiagen), lung fibroblast activity was analyzed by qPCR (96-well LightCycler; Roche) with detection of genes for COL1A1 and ACTA-2. Relative gene expression (duplicates) was calculated by 2-ΔCq method related to 2 housekeepers (geomean of RPL19 and EEF1). 2-ΔCq values were further normalized by dividing the sample values by the mean of the control values without NK cells. Primer sequences are listed in Table S7.
To test the impact of NK cells on the activity of primary lung fibroblasts, 2 day seeded fibroblasts were co-incubated with 2x10⁴ isolated NK cells (pre-stimulated with or without 10ng/ml IL-2 for 18h) from controls and patients with moderate or severe COVID-19 progression for 18 hours in defined DMEM/F12 media at 37°C. Then the supernatant was discarded and co-culture was carefully washed with PBS. Sufficient removal of NK cells was checked by light microscope (Zeiss, AxioVert 200M), the experiment was then stopped with a lysis buffer and qPCR was performed as described above.
To test the anti-fibrotic activity of NK cells, human lung fibroblasts were labeled with live dye e670 (1μM; ebioscience; to distinguish lung fibroblasts from NK cells) for 10 min at room temperature in the dark, washed twice with PBS, and seeded as described above in fibroblast media at 37°C. After 2 days, 2.5x10⁴ isolated NK cells (pre-stimulated with or without 10ng/ml IL-2 for 18h) from the subject groups were co-incubated with the lung fibroblasts for 6h in defined DMEM/F12 media at 37°C. The supernatant was collected, remaining lung fibroblast were incubated with accutase (Sigma) for 5 min for detaching, sufficiently washed with PBS to remove all cells and reunited with the collected supernatant. After staining with the viability dye Zombie Aqua (Biolegend, USA), cells were permeabilized using the Cytofix/Cytoperm Kit according to the manufacturer (BD Biosciences, USA) and labeled with specific antibody for active Caspase-3 for detecting of apoptotic lung fibroblasts by flow cytometry (BD Canto 2). FC raw data was analyzed by FlowJo software V10.6.1 (BD Bioscience, USA).
SARS-CoV-2 infection model (cohort 1)
For in vitro infection, 5x10³ Vero E6 cells or 6x10³ CaCo-2 cells were seeded in 96-well flat bottom plates and cultured at 37°C. After 48h cells were infected with SARS-CoV-2/human/Germany/Heinsberg-01/2020 virus at a MOI 0.1 (Vero E6 cells) or 1.0 (CaCo-2 cells). After one hour, the inoculum was removed, and cells were washed once with DPBS. Then, cells were cultured for additional 48h in the presence of increasing concentrations (0ng/ml, 1ng/ml, 10ng/ml) of recombinant human IFN-γ (Immunotools) or TNF-α (Immunotools) or a combination of both (10ng/ml each).
Alternatively, purified NK cells (1x10⁴) were incubated with or without recombinant IL-2 (10ng/ml) for 18h and were added 24h post-infection and co-cultured with Vero E6 or Caco-2 cells, respectively, in defined DMEM/F12 media for another 24h.
Then, supernatant was removed and collected, the cells were washed twice with DPBS, controlled by microscope and tested for SARS-CoV-2 RNA replication or stained for SARS-CoV-2 Spike protein using specific nanobodies (Koenig et al., 2021).
In the supernatant, concentrations of the cytokines IFN-γ and TNF were detected using the Cytometric Bead Array (CBA) from Legendplex (Essential Immune Response Kit), and the beads were measured on the BD FACS Canto 2.
Detection of SARS-CoV-2 infection (cohort 1)
Detection of SARS-CoV-2 infection was performed via two approaches, assessing either expression of viral RNA by PCR or expression of viral proteins using fluorochrome-conjugated nanobodies.
For detection of SARS-CoV-2 specific genes, treatment of cells, RNA isolation and transcription into cDNA was performed as described above. Primers were purchased (N1/N2 target, SARS-CoV-2 (2019-nCoV) CDC RUO Kit, (Corman et al., 2020) or sequences were obtained from other published work (M-gene, primer sequences in Table S7) (Toptan et al., 2020). Relative gene expression was calculated with the use of duplicates by 2-ΔCq method related to 2 housekeeping genes (RPL19, EEF1A, Table S7).
For intracellular detection of SARS-CoV-2 Spike protein, in vitro infections of Vero E6 or CaCo-2 cells were performed as described above and cells were co-cultured with recombinant cytokines or isolated NK cells accordingly. arget cells were detached with accutase (Sigma) and washed with DPBS. After staining with viability dye Zombie Aqua (Biolegend, USA) cells were fixed/permeabilized using the Cytofix/Cytoperm Kit according to the manufacturer (BD Biosciences, USA) and subsequently incubated with the Spike specific nanobody VHH E (AF488 labeled)(Koenig et al., 2021), or control nanobody LaM-4 (anti-mCherry, AF488 labeled)(Fridy et al., 2014) for 30 min in the dark by shaking at 4°C. Analysis was performed on a flow cytometer (BD Canto-2). FC raw data was analyzed by FlowJo software V10.6.1 (BD Bioscience, USA).
Measurement of soluble factors in plasma
Plasma concentrations of the cytokines IL-5, IL-4, IL-12p70, IL-22, IL-8, IL-10, IL-6, IFN-γ, TNF-α, and IL-1b were measured with planar-array technology on the Quanterix® SP-X Imaging and Analysis System using the Simoa® CorPlex Human Cytokine Panel 1 assay (Item 85-0329). Plasma concentrations of IFN-α were also measured on the SP-X system using an assay in development, which will become commercially available in the future. Plasma concentrations of SARS-CoV-2 Nucleocapsid protein and SARS-CoV-2 anti-Spike IgG were measured using digital bead-based technology on the Quanterix® HD-X Analyzer with development versions of the assays Simoa® SARS CoV-2 N Protein Advantage Kit (Item 103806) and Simoa® SARS-CoV-2 Spike IgG Advantage Kit (Item 103769).
Quantification and statistical analysis
ScRNA-seq data analysis
Processed and previously published PBMC scRNA-seq datasets from Schulte-Schrepping et al. (cohort 1, Bonn data and cohort 2, Berlin data)(Schulte-Schrepping et al., 2020) and from Bernardes et al. (cohort 3, Kiel data)(Bernardes et al., 2020) were downloaded from FastGenomics (https://www.fastgenomics.org) as Seurat objects and datasets from Su et al. (2020) and Stephenson et al. (2021) (cohort 4, UK and US data) were received directly by the authors and downloaded from the COVID19 cell atlas (https://covid19cellatlas.org/), respectively and all datasets were imported to R 4.0.0. Subsequent gene expression data analysis analysis was performed using the R/Seurat package 3.2.0 (cohorts 1, 2 and 3) and 3.9.9 (cohort 4) (Butler et al., 2018; Stuart et al., 2019).
Metadata adjustment
Cohort 3 initially used a different disease severity group annotation than the other cohorts which had to be adjusted. Patients marked as “complicated (incremental),” “complicated (recovering),” “complicated with hyperinflammatory syndrome” and “critical” were binned into the group “severe,” while “mild (recovering)” were annotated as “moderate.” Patients annotated as “recovered” and “recovery/asymptomatic” were removed from further analysis.
For cohort 4, the maximum WHO ordinal scale (US data) or “status_on_day_collection” (UK data) per patient was used as a discriminator between moderate and severe diseased patients. Patients who received steroid treatment were removed from further analysis.
Moreover, samples with more than 4 weeks after onset of symptoms were taken out of cohort 3 and 4, since the main interests of this study are the changes in the first weeks.
For all datasets, samples with 3 and 4 weeks after onset of symptoms were annotated as week “3+” after symptoms.
Data integration for cohort 4
To analyze the data without having any influence of batch effects resulting from the two different studies (UK (Stephenson et al., 2021) and US (Su et al., 2020) and their locations, the Seurat implemented integration approach based on “anchors” across collection sites (Stuart et al., 2019) was used to harmonize and integrate the two datasets following the default settings but increasing the integration features to 10,000. Subsequently, the merged dataset was scaled, PCA was performed and UMAP was calculated based on the first 30 PCs.
Data integration for cohorts 1 to 3
Data integration approaches for cohorts 2 and 3 or 1 to 3 as an alternative to using a validation cohort approach revealed similar results (data not shown). Since the validation cohort approach did not require any correction for batch effects due to the use of different technologies (10x Genomics versus BD Rhapsody) and since other parameters might also have been different between the three different clinical sites, we opted for the validation cohort approach to present the data within this manuscript.
Selection of NK cells
NK cells present in each cohort were selected in a three-step process. This process is described as exemplary for cohort 1.
First, the entire T and NK lymphocyte fraction was subsetted based on the cell type label provided by Schulte-Schrepping et al., including all T cells, NK cells and proliferating cells. This subset was subsequently normalized, scaled and dimensional reduction was calculated using the standard Seurat functions. For normalization, the gene expression values were normalized by total UMI counts per cell, multiplied by 10,000 (TP10K) and then log transformed by log10(TP10k+1). Subsequently, the data was scaled, centered and regressed against the number of detected transcripts per cell to correct for heterogeneity associated with differences in sequencing depth. For dimensionality reduction, PCA was performed on the top 2,000 variable genes identified using the vst method. For two-dimensional representation of the data structure, uniform manifold approximation and projection (UMAP) was calculated using the first 30 principal components (PCs).
Next, the NK cells within this subset were identified: After UMAP calculation, cells were clustered using the Louvain algorithm based on the first 30 PCs and a resolution of 0.2. The cluster consisting of NK cells was identified using classical NK cell marker (KLRF1, GNLY, NKG7) and cluster-specific marker genes calculated with the Wilcoxon rank sum test using the FindAllMarkers Seurat function (parameters: min.pct = 0.25, logFC.threshold = 0.25). This NK cell cluster was selected and subsequently normalized, scaled and dimensionality reduction was calculated. Next, UMAP and clusters were calculated. All steps were performed with the same parameters as described above.
Lastly, the NK cell subset was cleaned from non-NK cells. For this, the cells were over-clustered using the Louvain algorithm with a resolution of 1. Cluster-specific marker genes calculated by the Wilcoxon rank sum test (same parameters as above) and the expression of KLRF1 were used to identify NK and non-NK cells. Clusters expressing classical marker genes related to other cell types, such as NKT cells (TRAC), CD8+ T cells (CD8A) and others, as well as clusters showing remarkably high expression of hemoglobin related genes (HBB, HBA1, HBA2) were removed from the dataset to yield clean NK cells (Table S2). Hemoglobin-rich clusters may result from erythrocytes which contaminate the cells during sequencing preparation.
To account for a donor-specific batch-effect in cohort 3, the first 30 PCs of the “harmony” algorithm (Korsunsky et al., 2019) were used instead of the PCs calculated by PCA, all other steps remained similar.
Differential gene expression analysis
Differential expression (DE) tests were performed using FindMarkers or FindAllMarkers functions in Seurat with Wilcoxon Rank Sum test. Genes with a log-fold change greater than 0.2, at least 10% expressed in tested groups and with a bonferroni-corrected p value < 0.05 were considered as DEGs. Group/subtype specific marker genes were identified by applying the DE tests for upregulated genes between cells in one group/subtype to all others in the dataset.
Gene set ontology enrichment analysis (GOEA)
Gene set ontology enrichment analysis using the heatmap modules as input was performed on the gene sets from the Gene Ontology (GO) biological process (BP) database (Ashburner et al., 2000; The Gene Ontology Consortium, 2019), the Kyoto Encyclopedia of Genes And Genomes (KEGG) database (Kanehisa, 2019) and the Hallmark gene sets (Liberzon et al., 2015) using the R package clusterProfiler (version 3.16.1)(Yu et al., 2012). Ontologies with highest and statistically significant enrichment were used for presentation.
Transcription factor prediction analysis
The R package RcisTarget (version 1.8.0)(Aibar et al., 2017) was used to predict the transcription factors potentially regulating heatmap module-specifically contained gene sets. The genomic regions of TF-motif search were limited to 10kb around the respective transcriptional start sites by using the RcisTarget-implemented “hg19-tss-centered-10kb-7species.mc9nr.feather” motifRanking file. Prediction was performed using the cisTarget function and the resulting top 3 predicted TF, according to their normalized enrichment scores (NES), were selected for each heatmap module.
Upstream ligand prediction analysis
Prediction of potential upstream ligands of each heatmap module gene set was performed using the R package NicheNetR (version 1.0.0)(Bonnardel et al., 2019; Browaeys et al., 2020). For each heatmap module, the top 3 predicted ligands were selected according to their Pearson correlation coefficient (PCC).
Gene signature enrichment using AUCell
Enrichment of gene signature sets was performed using the “AUCell” method (Aibar et al., 2017) implemented in the R package (version 1.10.0). We set the threshold for the calculation of the AUC to the top 3% of the respective ranked genes and normalized the maximum possible AUC to 1.
Overlay analysis of donor origin of single cells onto the violin plots displaying IFN-α response and TNF signaling enrichments ensured that cells within NK cell clusters at defined time intervals and patient groups were not dominated by individual patients (data not shown).
NK subtype annotation
For NK subtype definition of cohort 1, the combined information gained from cluster-specific DE gene expression and the enrichment of literature-based NK RNA signatures were used. Here, we evaluated sequencing-based NK annotations from the literature (Crinier et al., 2018; Smith et al., 2020; Yang et al., 2019a) and decided to use the signatures from Smith et al. (2020). First, the entire NK population was clustered using the Louvain algorithm based on the first 30 PCs with a resolution of 0.7, resulting in a total of 8 clusters. Subsequently, DEGs for each cluster were calculated using the Wilcoxon rank sum test as described above. Due to a similar gene expression profile and close proximity, the first 3 clusters were united into one. Based on the upregulated DEGs of these 6 clusters, scRNA-seq NK signatures from Smith et al. were applied for gene set enrichment using the AUCell as described above. With the combined results, the 6 distinct NK clusters were annotated according to their subtype as inflamed CD56dim (high IFN-related genes), CD56bright (NCAM1), proliferating CD56dim (MKI67), cytokine CD56dim (CCL4, CCL3, IFN-γ), HLAhi CD56dim (HLA-DP and HLA-DR related genes) and CD56dim (FCGR3A) NK cells (Table S2). NK subtypes in cohorts 2, 3 and 4 were then annotated based on the markers identified in cohort 1.
Quantification of NK subtypes in disease groups
To compare shifts in the NK subtypes stratified by disease group, the percentages of each subtype were quantified per sample and visualized together in boxplots. For determination of statistical significant differences in the distribution per disease group, a Kruskal-Wallis test with FDR correction was performed. Subtypes showing significant changes (FDR-corrected Kruskal-Wallis p value < 0.05) were further tested with a Dunn’s Post hoc test using the “dunn.test” R package (version 1.3.5). Resulting p values were corrected for multiple testing using the Benjamini-Hochberg method.
Confusion matrix
For each NK subtype, the relative proportion across disease severity was visualized as a fraction of samples from the respective condition contributing to the NK subtype.
Time kinetics analysis of identified NK subtypes
For each severity group, the proportional occupancy of the NK subtypes was calculated for all samples and their respective time points (in days after onset of symptoms) and the relative proportions were subsequently visualized as a function of time.
Correlation analysis
To analyze the correlation of IFN-related genes (IFIT2, IFIH1, IFI44L, XAF1, MX1, IFI6, ISG20, ISG15) with plasma cytokine levels, samples having both information (9 moderate, 13 severe) were selected and average gene expressions for the respective genes were calculated per sample. Subsequently, Spearman correlation was performed and the Spearman coefficients displayed using a heatmap. Significant correlations (p < 0.05) were indicated.
CITE-seq analysis of cohort 4
Cellular Indexing of Transcriptomes and Epitopes by sequencing (CITE-seq) information of cohort 4 from US data (Su et al., 2020) and UK data (Stephenson et al., 2021) were used to strengthen the annotation of the clusters calculated for protein data based on the previously identified scRNA-seq clusters (see below). Since both studies of cohort 4 included different antibody markers, CITE-seq information was analyzed separately. In general, both CITE-seq datasets were first normalized using the CLR normalization method and subsequently scaled using the ScaleData function implemented in Seurat. For the US (Su et al.) dataset, a batch-correction was performed by normalizing and scaling the major batches 6, 7, 9 and 10 individually and then merging the data again.
Flow cytometry clustering analysis (cohort 1)
After pre-processing of the data (see section above), compensated fluorescence intensities were exported from FlowJo (BD, v. 10.7.1) for all the cells in the singlets/Lineage(-)/Living/CD56(+)/NKp80(+) gate. Exported .fcs files were imported in R (v. 3.6.2, Bioconductor v. 3.10) with the flowCore package (Bioconductor, v. 1.52.1)(Hahne et al., 2009). Fluorescence intensity values were then transformed with an auto-logicle transformation. Here we calculated the optimal width for the logicle transformation for each of the fluorescence parameters using the formula w = (m-log10(t/abs(r)))/2, where r is the most negative value to be included in the display (Chen et al., 2016). Transformed fluorescence values from each experimental batch were used for dimensionality reduction using the UMAP algorithm (umap, CRAN, v. 0.2.6.0, n = 15, mdist = 0.2, metric = ”euclidean”)(McInnes et al., 2018). For each sample a maximum of 1.000 cells were randomly selected. To account for the small differences derived from the measurement of the samples in different experimental dates, the batch correction algorithm harmony (GitHub v. 1.0)(Korsunsky et al., 2019) was used to normalize the data. Normalized values were now used for UMAP dimensionality reduction (umap, CRAN v. 0.2.7.0)(McInnes et al., 2018) and Phenograph clustering (Rphenograph, GitHub v. 0.99.1, with number of nearest neighbors (k) = 60) (Levine et al., 2015). The expression of the markers CD69, CD38, CD94, KI67, CD161, CD95, FASL, NKp80, GrzB, HLA-DR, TIGIT, CD16, CD56 were used for the calculation of the UMAP and Phenograph clustering. After this step, data were visualized according to the Phenograph clustering after manual annotation of selected metaclusters to match the scRNA-seq annotation. Heatmaps of marker expression were calculated as scaled mean of the transformed fluorescence intensity of each marker for each Phenograph cluster. Confusion matrices were calculated normalizing first the cells from each condition to a total number of 1000 cells and later calculating the relative contribution of each condition on each cluster. Statistical testing for the difference in the frequency of each cluster was calculated with a Kruskal-Wallis test (with FDR correction, R v 3.6.2) to identify clusters where the grouping has an impact on the cluster frequency. Clusters having significant Kruskal-Wallis test (FDR corrected p value < 0.05) were tested with a Dunn’s Post hoc test with Benjamini-Hochberg correction for multiple testing (CRAN rstatix package v 0.7.0). All heatmaps were calculated with the pheatmap package (CRAN, v. 1.0.12) and boxplots with the R package ggplot2 (CRAN, v. 3.3.3). The analysis was performed in a dockerized environment (lorenzobonaguro/flowtools:R362_V2).
CyTOF analysis (cohort 2)
NK cells were identified based on exclusion of CD3+, CD19+, CD15+ and CD14+ cells and subsequent gating on all CD56+ cells. Because leukocyte counts were not available for all control samples, we use absolute NK cell numbers from our recently published control cohorts (Kverneland et al., 2016, Sawitzki et al., 2020)) for comparison as also described in Schulte-Schrepping et al. (Schulte-Schrepping et al., 2020). NK cells were clustered based on the expression of 16 markers: CD16, CD56, HLA-DR, CD38, CD69, Ki67, CXCR5, CXCR3, CCR6, PD1, TIGIT, CD226, CD62L, KLRB1, KLRG1, and KLRF1. The raw values obtained with CyTOF were first transformed with the inverse hyperbolic sine function (asinh) and then z-score normalized per marker. We clustered NK cells using Phenograph (Levine et al., 2015)with 100 nearest neighbors (k = 100). We found 15 clusters, which were annotated based on the average z-score transformed CyTOF expression of the markers in each cluster. Similarly, UMAPs were calculated with the selected markers mentioned above using the R package “uwot” with default parameters (Melville et al., 2020). Statistical testing for the difference in the frequency of each cluster was calculated with the same approach as described below, i.e., Dunn’s Post hoc test with Benjamini-Hochberg correction for clusters with significant Kruskal-Wallis test (FDR corrected p value < 0.05). For the non-weekly analysis, we considered the first sample per patient. For the weekly analysis, only the first sample per week was included and the repeated samples in the same week were excluded from the analysis.
NK subtype annotation for FC and CyTOF data
The assignment of the FC/CyTOF sub-clusters to the 6 NK cell subsets (see above “NK subtype annotation”) was done by comparing protein, transcriptome and CITE-seq expressions from the respective subset (cohort 1: Figures S2D and S2E; cohort 2: Figures S2F and S2G) for inflamed CD56dim (cohort 1: CD69high, CD38; cohort 2: CD38, CD69), proliferating CD56dim(cohort 1: KI-67, HLA-DR), CD56bright (both cohorts: high CD56 expression, no CD16), HLAhi CD56dim(cohort 1: TIGIThigh, CD95, HLA-DR ; cohort 2: HLA-DR), and cytokine CD56dim cells (cohort 1: CD161high, CD38, CD16high cohort 2: KLRG1high, CD161high, CD16high CD226). In cohort 2, the proliferating CD56dim subset could not be assigned. Conversely, subclusters were found that did not match the subsets. This can be explained by missing markers, which would be necessary to uniquely assign all NK cell subsets.
Statistical analysis of flow data (cohort 1)
Data variance was determined by controlling the False Discovery Rate for multiple comparisons following one-way ANOVA in GraphPad PRISM 9 (Graphpad software, Inc., La Jolla, CA). From a case number above 8 a normal distribution test according to D’Àgostino-Pearson was applied, below 8 individuals non-parametric tests were performed. Therefore, for unpaired/normally distributed data ordinary ANOVA and for unpaired/non-normally distributed data Kruskal-Wallis test was performed. A p value below the limit of 0.05 was considered significant, and figures were produced using GraphPad Prism.
Rank-rank analysis
To find similarly DEGs in the later stage of severe COVID-19, a rank-rank analysis for the three cohorts was performed. First, DEGs for the comparison of severe week 3+ versus all other conditions (cohort 1, cohort 2 and cohort 3), and severe week 2+ versus all other conditions (cohort 4) were calculated using the Seurat implemented “FindMarkers” function defined by an expression in at least 10% of NK cells. Here, no fold-change cut-off was applied. Fold-changes of genes present in both cohort 1 and cohort 2, cohort 3 or cohort 4, respectively, were subsequently visualized in a rank-rank plot. Intersection of genes which were either up- or downregulated in all three cohorts were highlighted and visualized in a heatmap representing their fold-change. For the definition of intersecting up- or downregulated genes the following log fold-change thresholds were used; cohort 1 = 0.15, cohort 2 = 0.2, cohort 3 = 0.15 and cohort 4 = 0.15.
NK cells from bronchoalveolar lavage fluid
To obtain scRNA-seq data of NK cells from the bronchoalveolar lavage fluid (BALF) in COVID-19, the sequencing data from Liao et al. (2020) was downloaded from GEO with the accession number GSE145926. The authors used the droplet-based 10X Genomics technique and deposited the count matrices in h5 files. These files were imported into R 4.0.0 by using the Seurat-implemented “Read10X_h5′' function. Subsequent analysis was performed using Seurat (version 3.2.0). After removal of cells with less than 200 or more than 6,000 expressed genes and more than 10% mitochondrial reads, a total of 66,452 BALF cells remained. In addition, genes that were expressed in less than three cells were removed. Subsequently normalization was performed using the LogNormalization function. The gene counts for each cell were normalized by total UMI counts, multiplied by 10,000 (TP10K) and the log transformed by log10(TP10k+1). After normalization, the count data was scaled regressing for total UMI counts and mitochondrial read percentage, as described by Liao et al. and principal component analysis (PCA) was performed based on the 2,000 most variable features identified using the vst method implemented in Seurat. Since a batch-effect was observed for the different samples, the data was batch-corrected using the “harmony” algorithm (Korsunsky et al., 2019) based on the first 50 principal components. For two-dimensional data visualization, UMAP was performed based on the first 50 principal components of the “harmony” data reduction. Subsequently, the cells were clustered using the Louvain algorithm based on the first 30 “harmony” dimensions with a resolution of 0.7, resulting in 19 clusters. For NK cell selection, the cluster expressing canonical NK cell markers (GNLY, NGK7, KLRF1) was sub-clustered. In the following analysis the NK cell population was cleaned from ambiguous cells as described for our cohorts. Cells originating from control donors had to be removed due to very low numbers of cells. The final BALF NK cell dataset contained 658 cells.
NK cells from lung biopsies in pulmonary fibrosis
The processed scRNA-seq dataset (n = 114,396 cells) from lung biopsies of patients with pulmonary fibrotic diseases and control by Habermann et al. (2020) was downloaded from GEO with the accession number GSE135893 and loaded into R 4.0.0 for analysis using Seurat. NK cell selection occurred in a similar fashion as described for our cohorts. In brief, the entire T lymphocyte and NK cell fraction as defined by Habermann et al. was sub-clustered, next the cluster composed of NK cells was selected and finally, NK cells were cleaned from ambiguous cells. Furthermore, cells originating from patients with unclassifiable interstitial lung disease, sarcoidosis and chronic hypersensitivity pneumonitis were removed for further analysis. The resulting final NK cell subset comprised 1,550 cells from patients with nonspecific interstitial pneumonia (NSIP), idiopathic pulmonary fibrosis (IPF) and controls. For determination of statistical significant differences in the distribution per disease, a Kurskall Wallis test with FDR correction was performed. Subtypes showing significant changes (FDR-corrected Kruskal-Wallis p value < 0.05) were further tested with a Dunn’s Post hoc test using the “dunn.test” R package (version 1.3.5). Resulting p values were corrected for multiple testing using the Benjamini-Hochberg method.
Data visualization
For data visualization the R packages Seurat, ggplot2 (version 3.3.2) (Wickham, 2016) (ggplot2: Elegant Graphics for Data Analysis. Springer-Verlag New York. ISBN 978-3-319-24277-4), (https://ggplot2.tidyverse.org), pheatmap (version 1.0.12) and ComplexHeatmap (version 2.4.3) (Gu et al., 2016) were used.
Acknowledgments
We would like to acknowledge the assistance of the Flow Cytometry Core Facility at the Institute of Experimental Immunology, Medical Faculty at the University of Bonn. We are grateful to the patients and donors volunteering to participate in this study making this research possible. We also thank Berthold Gottgens, John Marioni, Menna Clatworthy, Sarah Teichmann, Paul Lyons, Ken Smith, Fernando Calero-Nieto, and the Cambridge Institute of Therapeutic Immunology and Infectious Disease-National Institute of Health Research (CITIID-NIHR) COVID-19 BioResource Collaboration. DeCOI members are listed at https://decoi.eu/members-of-decoi/.
This work was supported by the German Research Foundation (DFG) (SFB TR57 and SPP1937 to J.N.; KR 4521/1-1 to B.K.; INST 37/1049-1, INST 216/981-1, INST 257/605-1, INST 269/768-1, INST 217/988-1, INST 217/577-1, EXC2151 – 390873048 to J.L.S.; and SFB1454 – 432325352 to A.C.A. and J.L.S.); the DZIF, Germany (TTU 04.816 and 04.817 to J.N.); the Hector Foundation (M89 to J.N.); Helmholtz-Gemeinschaft Deutscher Forschungszentren, Germany (sparse2big to J.L.S); EU projects SYSCID (733100 to J.L.S.); ERA CVD (00160389 to J.L.S.); ImmunoSep (847422 to J.L.S.); the Federal Ministry of Education and Research (BMBF) (COVIMMUNE 01KI20343 to J.N., E.L., B.M.K.); funds from the Medical Faculty of the University of Bonn (to P.K. and F.S.); Emmy Noether Programme 322568668 (to F.I.S.); the ACA was supported by an intramural grant from the Department of Genomics & Immunoregulation at the LIMES Institute; Parker Institute for Cancer Immunotherapy; The Washington State Andy Hill CARE Fund (to J.R.H.); The Biomedical Advanced Research and Development Authority HHSO10201600031C (to J.R.H.); Mary Gates Research Fellowship (to D.C.); and the Mahan Fellowship in the Herbold Computational Biology Program of the Fred Hutch Cancer Research Center (to Y.S.).
Author contributions
Conceptualization, B.K., R.K., L.B., M.T., J.R., J.L.S., A.C.A., and J.N.; methodology, B.K., L.B., M.T., J.R., B.M.K., J.S.-S., E.D.D., K.H., J.L.S., A.C.A., P.-A.K., and F.I.S.; investigation, B.K., R.K., L.B., M.T., J.R., R.A., J.S.-S., E.D.D., K.H., J.R.H., Y.S., D.Y., D.C., J.G., E.S., L.G., G.R., M.H., E.L., J.L.S., A.C.A., and J.N.; data analysis, B.K., R.K., L.B., M.T., J.R., R.A., J.S.-S., E.D.D., K.H., B.S., J.L.S., A.C.A., and J.N.; visualization, B.K., R.K., L.B., M.T., J.R., R.A., J.S.-S., E.D.D., K.H., J.L.S., A.C.A., and J.N.; conducted sample collection and processing, J.R., K.M.K., G.J.R., J.B., M.M., S.V.S., A.J.B., J.M.J., G.H., C.P.S., N.B., C.F., P.S., F.K., C.H., H.D.N., B.S., J.R.H., Y.S., D.Y., D.C., J.G., E.S., L.G., G.R., M.H., V.K., B.J., L.E.S., P.R., and J.N.; writing – original draft, B.K., R.K., L.B., J.L.S., A.C.A., and J.N.; writing – review & editing, all authors.
Declaration of interests
P.-A.K. and F.I.S. are cofounders and shareholders of Dioscure Therapeutics SE. F.I.S. is a consultant and shareholder of IFM Therapeutics. J.R.H. is founder and board member of Isoplexis and PACT Pharma. J.D.G. declares contracted research with Gilead, Lilly, and Regeneron. K.H., J.M.J., and A.J.B. work at Quanterix Corporation. All other authors declare no competing interests.
Published: September 4, 2021
Footnotes
Supplemental information can be found online at https://doi.org/10.1016/j.immuni.2021.09.002.
Contributor Information
Deutsche COVID-19 OMICS Initiative (DeCOI):
Janine Altmüller, Angel Angelov, Anna C. Aschenbrenner, Robert Bals, Alexander Bartholomäus, Anke Becker, Matthias Becker, Daniela Bezdan, Michael Bitzer, Conny Blumert, Ezio Bonifacio, Peer Bork, Bunk Boyke, Helmut Blum, Nicolas Casadei, Thomas Clavel, Maria Colome-Tatche, Markus Cornberg, Inti Alberto De La Rosa Velázquez, Andreas Diefenbach, Alexander Dilthey, Nicole Fischer, Konrad Förstner, Sören Franzenburg, Julia-Stefanie Frick, Gisela Gabernet, Julien Gagneur, Tina Ganzenmueller, Marie Gauder, Janina Geißert, Alexander Goesmann, Siri Göpel, Adam Grundhoff, Hajo Grundmann, Torsten Hain, Frank Hanses, Ute Hehr, André Heimbach, Marius Hoeper, Friedemann Horn, Daniel Hübschmann, Michael Hummel, Thomas Iftner, Angelika Iftner, Thomas Illig, Stefan Janssen, Jörn Kalinowski, René Kallies, Birte Kehr, Andreas Keller, Oliver T. Keppler, Sarah Kim-Hellmuth, Christoph Klein, Michael Knop, Oliver Kohlbacher, Karl Köhrer, Jan Korbel, Peter G. Kremsner, Denise Kühnert, Ingo Kurth, Markus Landthaler, Yang Li, Kerstin U. Ludwig, Oliwia Makarewicz, Federico Marini, Manja Marz, Alice C. McHardy, Christian Mertes, Maximilian Münchhoff, Sven Nahnsen, Markus Nöthen, Francine Ntoumi, Peter Nürnberg, Stephan Ossowski, Jörg Overmann, Silke Peter, Klaus Pfeffer, Isabell Pink, Anna R. Poetsch, Ulrike Protzer, Alfred Pühler, Nikolaus Rajewsky, Markus Ralser, Kristin Reiche, Olaf Rieß, Stephan Ripke, Ulisses Nunes da Rocha, Philip Rosenstiel, Antoine-Emmanuel Saliba, Leif Erik Sander, Birgit Sawitzki, Simone Scheithauer, Philipp Schiffer, Jonathan Schmid-Burgk, Wulf Schneider, Eva-Christina Schulte, Joachim L. Schultze, Alexander Sczyrba, Mariam L. Sharaf, Yogesh Singh, Michael Sonnabend, Oliver Stegle, Jens Stoye, Fabian Theis, Thomas Ulas, Janne Vehreschild, Thirumalaisamy P. Velavan, Jörg Vogel, Sonja Volland, Max von Kleist, Andreas Walker, Jörn Walter, Dagmar Wieczorek, Sylke Winkler, and John Ziebuhr
Supplemental information
Data and code availability
Single-cell RNA-seq data have been deposited at the European Genome-phenome Archive (EGA) and are publicly available as of the date of publication. Accession numbers are listed in the Key resources table.
All original code is publicly available as of the date of publication. DOIs are listed in the Key resources table.
Any additional information required to reanalyze the data reported in this paper is available from the lead contact upon request.
References
- Ahlenstiel G., Edlich B., Hogdal L.J., Rotman Y., Noureddin M., Feld J.J., Holz L.E., Titerence R.H., Liang T.J., Rehermann B. Early changes in natural killer cell function indicate virologic response to interferon therapy for hepatitis C. Gastroenterology. 2011;141:1231–1239.e1-2. doi: 10.1053/j.gastro.2011.06.069. [DOI] [PMC free article] [PubMed] [Google Scholar]
- Aibar S., González-Blas C.B., Moerman T., Huynh-Thu V.A., Imrichova H., Hulselmans G., Rambow F., Marine J.-C., Geurts P., Aerts J., et al. SCENIC: single-cell regulatory network inference and clustering. Nat. Methods. 2017;14:1083–1086. doi: 10.1038/nmeth.4463. [DOI] [PMC free article] [PubMed] [Google Scholar]
- Alvarez M., Simonetta F., Baker J., Pierini A., Wenokur A.S., Morrison A.R., Murphy W.J., Negrin R.S. Regulation of murine NK cell exhaustion through the activation of the DNA damage repair pathway. JCI Insight. 2019;5:e127729. doi: 10.1172/jci.insight.127729. [DOI] [PMC free article] [PubMed] [Google Scholar]
- Angerer P., Haghverdi L., Büttner M., Theis F.J., Marr C., Buettner F. destiny: diffusion maps for large-scale single-cell data in R. Bioinformatics. 2016;32:1241–1243. doi: 10.1093/bioinformatics/btv715. [DOI] [PubMed] [Google Scholar]
- Aran D., Looney A.P., Liu L., Wu E., Fong V., Hsu A., Chak S., Naikawadi R.P., Wolters P.J., Abate A.R., et al. Reference-based analysis of lung single-cell sequencing reveals a transitional profibrotic macrophage. Nature Immunology. 2019;20:163–172. doi: 10.1038/s41590-018-0276-y. [DOI] [PMC free article] [PubMed] [Google Scholar]
- Arunachalam P.S., Wimmers F., Mok C.K.P., Perera R.A.P.M., Scott M., Hagan T., Sigal N., Feng Y., Bristow L., Tak-Yin Tsang O., et al. Systems biological assessment of immunity to mild versus severe COVID-19 infection in humans. Science. 2020;369:1210–1220. doi: 10.1126/science.abc6261. [DOI] [PMC free article] [PubMed] [Google Scholar]
- Ashburner M., Ball C.A., Blake J.A., Botstein D., Butler H., Cherry J.M., Davis A.P., Dolinski K., Dwight S.S., Eppig J.T., et al. The Gene Ontology Consortium Gene ontology: tool for the unification of biology. Nat. Genet. 2000;25:25–29. doi: 10.1038/75556. [DOI] [PMC free article] [PubMed] [Google Scholar]
- Baranek T., Manh T.-P.V., Alexandre Y., Maqbool M.A., Cabeza J.Z., Tomasello E., Crozat K., Bessou G., Zucchini N., Robbins S.H., et al. Differential responses of immune cells to type I interferon contribute to host resistance to viral infection. Cell Host Microbe. 2012;12:571–584. doi: 10.1016/j.chom.2012.09.002. [DOI] [PubMed] [Google Scholar]
- Bastard P., Rosen L.B., Zhang Q., Michailidis E., Hoffmann H.-H., Zhang Y., Dorgham K., Philippot Q., Rosain J., Béziat V., et al. HGID Lab. NIAID-USUHS Immune Response to COVID Group. COVID Clinicians. COVID-STORM Clinicians. Imagine COVID Group. French COVID Cohort Study Group. Milieu Intérieur Consortium. CoV-Contact Cohort. Amsterdam UMC Covid-19 Biobank. COVID Human Genetic Effort Autoantibodies against type I IFNs in patients with life-threatening COVID-19. Science. 2020;370:eabd4585. doi: 10.1126/science.abd4585. [DOI] [PMC free article] [PubMed] [Google Scholar]
- Bennett T.D., Moffitt R.A., Hajagos J.G., Amor B., Anand A., Bissell M.M., Bradwell K.R., Bremer C., Byrd J.B., Denham A., et al. The National COVID Cohort Collaborative: Clinical Characterization and Early Severity Prediction. MedRxiv. 2021 [Google Scholar]
- Bernardes J.P., Mishra N., Tran F., Bahmer T., Best L., Blase J.I., Bordoni D., Franzenburg J., Geisen U., Josephs-Spaulding J., et al. HCA Lung Biological Network. Deutsche COVID-19 Omics Initiative (DeCOI) Longitudinal Multi-omics Analyses Identify Responses of Megakaryocytes, Erythroid Cells, and Plasmablasts as Hallmarks of Severe COVID-19. Immunity. 2020;53:1296–1314.e9. doi: 10.1016/j.immuni.2020.11.017. [DOI] [PMC free article] [PubMed] [Google Scholar]
- Björkström N.K., Lindgren T., Stoltz M., Fauriat C., Braun M., Evander M., Michaëlsson J., Malmberg K.-J., Klingström J., Ahlm C., Ljunggren H.G. Rapid expansion and long-term persistence of elevated NK cell numbers in humans infected with hantavirus. J. Exp. Med. 2011;208:13–21. doi: 10.1084/jem.20100762. [DOI] [PMC free article] [PubMed] [Google Scholar]
- Blanco-Melo D., Nilsson-Payant B.E., Liu W.-C., Uhl S., Hoagland D., Møller R., Jordan T.X., Oishi K., Panis M., Sachs D., et al. Imbalanced Host Response to SARS-CoV-2 Drives Development of COVID-19. Cell. 2020;181:1036–1045.e9. doi: 10.1016/j.cell.2020.04.026. [DOI] [PMC free article] [PubMed] [Google Scholar]
- Blom K., Braun M., Pakalniene J., Lunemann S., Enqvist M., Dailidyte L., Schaffer M., Lindquist L., Mickiene A., Michaëlsson J., et al. NK Cell Responses to Human Tick-Borne Encephalitis Virus Infection. J. Immunol. 2016;197:2762–2771. doi: 10.4049/jimmunol.1600950. [DOI] [PubMed] [Google Scholar]
- Bonnardel J., T’Jonck W., Gaublomme D., Browaeys R., Scott C.L., Martens L., Vanneste B., De Prijck S., Nedospasov S.A., Kremer A., et al. Stellate Cells, Hepatocytes, and Endothelial Cells Imprint the Kupffer Cell Identity on Monocytes Colonizing the Liver Macrophage Niche. Immunity. 2019;51:638–654.e9. doi: 10.1016/j.immuni.2019.08.017. [DOI] [PMC free article] [PubMed] [Google Scholar]
- Branzk N., Lubojemska A., Hardison S.E., Wang Q., Gutierrez M.G., Brown G.D., Papayannopoulos V. Neutrophils sense microbe size and selectively release neutrophil extracellular traps in response to large pathogens. Nat. Immunol. 2014;15:1017–1025. doi: 10.1038/ni.2987. [DOI] [PMC free article] [PubMed] [Google Scholar]
- Braun J., Loyal L., Frentsch M., Wendisch D., Georg P., Kurth F., Hippenstiel S., Dingeldey M., Kruse B., Fauchere F., et al. SARS-CoV-2-reactive T cells in healthy donors and patients with COVID-19. Nature. 2020;587:270–274. doi: 10.1038/s41586-020-2598-9. [DOI] [PubMed] [Google Scholar]
- Browaeys R., Saelens W., Saeys Y. NicheNet: modeling intercellular communication by linking ligands to target genes. Nat. Methods. 2020;17:159–162. doi: 10.1038/s41592-019-0667-5. [DOI] [PubMed] [Google Scholar]
- Butler A., Hoffman P., Smibert P., Papalexi E., Satija R. Integrating single-cell transcriptomic data across different conditions, technologies, and species. Nat. Biotechnol. 2018;36:411–420. doi: 10.1038/nbt.4096. [DOI] [PMC free article] [PubMed] [Google Scholar]
- Cantaert T., Baeten D., Tak P.P., van Baarsen L.G. Type I IFN and TNFα cross-regulation in immune-mediated inflammatory disease: basic concepts and clinical relevance. Arthritis Res. Ther. 2010;12:219. doi: 10.1186/ar3150. [DOI] [PMC free article] [PubMed] [Google Scholar]
- Chen G., Wu D., Guo W., Cao Y., Huang D., Wang H., Wang T., Zhang X., Chen H., Yu H., et al. Clinical and immunological features of severe and moderate coronavirus disease 2019. J. Clin. Invest. 2020;130:2620–2629. doi: 10.1172/JCI137244. [DOI] [PMC free article] [PubMed] [Google Scholar]
- Chen T.J., Kotecha N. Cytobank: providing an analytics platform for community cytometry data analysis and collaboration. Curr Top Microbiol Immunol. 2014;377:127–157. doi: 10.1007/82_2014_364. [DOI] [PubMed] [Google Scholar]
- Chen H., Lau M.C., Wong M.T., Newell E.W., Poidinger M., Chen J. Cytofkit: A Bioconductor Package for an Integrated Mass Cytometry Data Analysis Pipeline. PLoS Comput. Biol. 2016;12:e1005112. doi: 10.1371/journal.pcbi.1005112. [DOI] [PMC free article] [PubMed] [Google Scholar]
- Chua R.L., Lukassen S., Trump S., Hennig B.P., Wendisch D., Pott F., Debnath O., Thürmann L., Kurth F., Völker M.T., et al. COVID-19 severity correlates with airway epithelium-immune cell interactions identified by single-cell analysis. Nat. Biotechnol. 2020;38:970–979. doi: 10.1038/s41587-020-0602-4. [DOI] [PubMed] [Google Scholar]
- Corman V.M., Landt O., Kaiser M., Molenkamp R., Meijer A., Chu D.K.W., Bleicker T., Brünink S., Schneider J., Schmidt M.L., et al. Detection of 2019 novel coronavirus (2019-nCoV) by real-time RT-PCR. Euro Surveill. 2020;25:2000045. doi: 10.2807/1560-7917.ES.2020.25.3.2000045. [DOI] [PMC free article] [PubMed] [Google Scholar]
- Crinier A., Milpied P., Escalière B., Piperoglou C., Galluso J., Balsamo A., Spinelli L., Cervera-Marzal I., Ebbo M., Girard-Madoux M., et al. High-Dimensional Single-Cell Analysis Identifies Organ-Specific Signatures and Conserved NK Cell Subsets in Humans and Mice. Immunity. 2018;49:971–986.e5. doi: 10.1016/j.immuni.2018.09.009. [DOI] [PMC free article] [PubMed] [Google Scholar]
- Ding L., Liu T., Wu Z., Hu B., Nakashima T., Ullenbruch M., Gonzalez De Los Santos F., Phan S.H. Bone Marrow CD11c+ Cell-Derived Amphiregulin Promotes Pulmonary Fibrosis. J. Immunol. 2016;197:303–312. doi: 10.4049/jimmunol.1502479. [DOI] [PMC free article] [PubMed] [Google Scholar]
- Dobin A., Davis C.A., Schlesinger F., Drenkow J., Zaleski C., Jha S., Batut P., Chaisson M., Gingeras T.R. STAR: ultrafast universal RNA-seq aligner. Bioinformatics. 2013;29:15–21. doi: 10.1093/bioinformatics/bts635. [DOI] [PMC free article] [PubMed] [Google Scholar]
- Fridy P.C., Li Y., Keegan S., Thompson M.K., Nudelman I., Scheid J.F., Oeffinger M., Nussenzweig M.C., Fenyö D., Chait B.T., Rout M.P. A robust pipeline for rapid production of versatile nanobody repertoires. Nat. Methods. 2014;11:1253–1260. doi: 10.1038/nmeth.3170. [DOI] [PMC free article] [PubMed] [Google Scholar]
- The Gene Ontology Consortium The Gene Ontology Resource: 20 years and still GOing strong. Nucleic Acids Res. 2019;47(D1):D330–D338. doi: 10.1093/nar/gky1055. [DOI] [PMC free article] [PubMed] [Google Scholar]
- Giamarellos-Bourboulis E.J., Netea M.G., Rovina N., Akinosoglou K., Antoniadou A., Antonakos N., Damoraki G., Gkavogianni T., Adami M.-E., Katsaounou P., et al. Complex Immune Dysregulation in COVID-19 Patients with Severe Respiratory Failure. Cell Host Microbe. 2020;27:992–1000.e3. doi: 10.1016/j.chom.2020.04.009. [DOI] [PMC free article] [PubMed] [Google Scholar]
- Glässner A., Eisenhardt M., Kokordelis P., Krämer B., Wolter F., Nischalke H.D., Boesecke C., Sauerbruch T., Rockstroh J.K., Spengler U., Nattermann J. Impaired CD4+ T cell stimulation of NK cell anti-fibrotic activity may contribute to accelerated liver fibrosis progression in HIV/HCV patients. J. Hepatol. 2013;59:427–433. doi: 10.1016/j.jhep.2013.04.029. [DOI] [PubMed] [Google Scholar]
- Grasselli G., Zangrillo A., Zanella A., Antonelli M., Cabrini L., Castelli A., Cereda D., Coluccello A., Foti G., Fumagalli R., et al. COVID-19 Lombardy ICU Network Baseline Characteristics and Outcomes of 1591 Patients Infected With SARS-CoV-2 Admitted to ICUs of the Lombardy Region, Italy. JAMA. 2020;323:1574–1581. doi: 10.1001/jama.2020.5394. [DOI] [PMC free article] [PubMed] [Google Scholar]
- Grifoni A., Weiskopf D., Ramirez S.I., Mateus J., Dan J.M., Moderbacher C.R., Rawlings S.A., Sutherland A., Premkumar L., Jadi R.S., et al. Targets of T Cell Responses to SARS-CoV-2 Coronavirus in Humans with COVID-19 Disease and Unexposed Individuals. Cell. 2020;181:1489–1501.e15. doi: 10.1016/j.cell.2020.05.015. [DOI] [PMC free article] [PubMed] [Google Scholar]
- Gu Z., Eils R., Schlesner M. Complex heatmaps reveal patterns and correlations in multidimensional genomic data. Bioinformatics. 2016;32:2847–2849. doi: 10.1093/bioinformatics/btw313. [DOI] [PubMed] [Google Scholar]
- Guan W.J., Ni Z.Y., Hu Y., Liang W.H., Ou C.Q., He J.X., Liu L., Shan H., Lei C.L., Hui D.S.C., et al. China Medical Treatment Expert Group for Covid-19 Clinical Characteristics of Coronavirus Disease 2019 in China. N. Engl. J. Med. 2020;382:1708–1720. doi: 10.1056/NEJMoa2002032. [DOI] [PMC free article] [PubMed] [Google Scholar]
- Habermann A.C., Gutierrez A.J., Bui L.T., Yahn S.L., Winters N.I., Calvi C.L., Peter L., Chung M.-I., Taylor C.J., Jetter C., et al. Single-cell RNA sequencing reveals profibrotic roles of distinct epithelial and mesenchymal lineages in pulmonary fibrosis. Science Advances. 2020;6:eaba1972. doi: 10.1126/sciadv.aba1972. [DOI] [PMC free article] [PubMed] [Google Scholar]
- Hadjadj J., Yatim N., Barnabei L., Corneau A., Boussier J., Smith N., Péré H., Charbit B., Bondet V., Chenevier-Gobeaux C., et al. Impaired type I interferon activity and inflammatory responses in severe COVID-19 patients. Science. 2020;369:718–724. doi: 10.1126/science.abc6027. [DOI] [PMC free article] [PubMed] [Google Scholar]
- Hahne F., LeMeur N., Brinkman R.R., Ellis B., Haaland P., Sarkar D., Spidlen J., Strain E., Gentleman R. flowCore: a Bioconductor package for high throughput flow cytometry. BMC Bioinformatics. 2009;10:106. doi: 10.1186/1471-2105-10-106. [DOI] [PMC free article] [PubMed] [Google Scholar]
- Hothorn T., Bretz F., Westfall P. Simultaneous inference in general parametric models. Biom J. 2008;50:346–363. doi: 10.1002/bimj.200810425. [DOI] [PubMed] [Google Scholar]
- Huang C., Wang Y., Li X., Ren L., Zhao J., Hu Y., Zhang L., Fan G., Xu J., Gu X., et al. Clinical features of patients infected with 2019 novel coronavirus in Wuhan, China. Lancet. 2020;395:497–506. doi: 10.1016/S0140-6736(20)30183-5. [DOI] [PMC free article] [PubMed] [Google Scholar]
- Janky R., Verfaillie A., Imrichová H., Van de Sande B., Standaert L., Christiaens V., Hulselmans G., Herten K., Naval Sanchez M., Potier D., et al. iRegulon: From a Gene List to a Gene Regulatory Network Using Large Motif and Track Collections. PLOS Comput Biol. 2014;10:e1003731. doi: 10.1371/journal.pcbi.1003731. [DOI] [PMC free article] [PubMed] [Google Scholar]
- Jeffrey K.L., Brummer T., Rolph M.S., Liu S.M., Callejas N.A., Grumont R.J., Gillieron C., Mackay F., Grey S., Camps M., et al. Positive regulation of immune cell function and inflammatory responses by phosphatase PAC-1. Nat. Immunol. 2006;7:274–283. doi: 10.1038/ni1310. [DOI] [PubMed] [Google Scholar]
- Jiang Y., Wei X., Guan J., Qin S., Wang Z., Lu H., Qian J., Wu L., Chen Y., Chen Y., Lin X. COVID-19 pneumonia: CD8+ T and NK cells are decreased in number but compensatory increased in cytotoxic potential. Clin. Immunol. 2020;218:108516. doi: 10.1016/j.clim.2020.108516. [DOI] [PMC free article] [PubMed] [Google Scholar]
- Kanehisa M. Toward understanding the origin and evolution of cellular organisms. Protein Sci. 2019;28:1947–1951. doi: 10.1002/pro.3715. [DOI] [PMC free article] [PubMed] [Google Scholar]
- Karki R., Sharma B.R., Tuladhar S., Williams E.P., Zalduondo L., Samir P., Zheng M., Sundaram B., Banoth B., Malireddi R.K.S., et al. Synergism of TNF-α and IFN-γ Triggers Inflammatory Cell Death, Tissue Damage, and Mortality in SARS-CoV-2 Infection and Cytokine Shock Syndromes. Cell. 2021;184:149–168.e17. doi: 10.1016/j.cell.2020.11.025. [DOI] [PMC free article] [PubMed] [Google Scholar]
- Koenig P.-A., Das H., Liu H., Kümmerer B.M., Gohr F.N., Jenster L.-M., Schiffelers L.D.J., Tesfamariam Y.M., Uchima M., Wuerth J.D., et al. Structure-guided multivalent nanobodies block SARS-CoV-2 infection and suppress mutational escape. Science. 2021;371:eabe6230. doi: 10.1126/science.abe6230. [DOI] [PMC free article] [PubMed] [Google Scholar]
- Kokordelis P., Krämer B., Körner C., Boesecke C., Voigt E., Ingiliz P., Glässner A., Eisenhardt M., Wolter F., Kaczmarek D., et al. An effective interferon-gamma-mediated inhibition of hepatitis C virus replication by natural killer cells is associated with spontaneous clearance of acute hepatitis C in human immunodeficiency virus-positive patients. Hepatology. 2014;59:814–827. doi: 10.1002/hep.26782. [DOI] [PubMed] [Google Scholar]
- Kong Y., Wang Y., Wu X., Han J., Li G., Hua M., Han K., Zhang H., Li A., Zeng H. Storm of soluble immune checkpoints associated with disease severity of COVID-19. Signal Transduct. Target. Ther. 2020;5:192. doi: 10.1038/s41392-020-00308-2. [DOI] [PMC free article] [PubMed] [Google Scholar]
- Korsunsky I., Millard N., Fan J., Slowikowski K., Zhang F., Wei K., Baglaenko Y., Brenner M., Loh P.-R., Raychaudhuri S. Fast, sensitive and accurate integration of single-cell data with Harmony. Nat. Methods. 2019;16:1289–1296. doi: 10.1038/s41592-019-0619-0. [DOI] [PMC free article] [PubMed] [Google Scholar]
- Kuri-Cervantes L., Pampena M.B., Meng W., Rosenfeld A.M., Ittner C.A.G., Weisman A.R., Agyekum R.S., Mathew D., Baxter A.E., Vella L.A., et al. Comprehensive mapping of immune perturbations associated with severe COVID-19. Sci. Immunol. 2020;5:eabd7114. doi: 10.1126/sciimmunol.abd7114. [DOI] [PMC free article] [PubMed] [Google Scholar]
- Kurth F., Roennefarth M., Thibeault C., Corman V.M., Müller-Redetzky H., Mittermaier M., Ruwwe-Glösenkamp C., Heim K.M., Krannich A., Zvorc S., et al. Studying the pathophysiology of coronavirus disease 2019: a protocol for the Berlin prospective COVID-19 patient cohort (Pa-COVID-19) Nature Medicine. 2020;26:842–844. doi: 10.1007/s15010-020-01464-x. [DOI] [PMC free article] [PubMed] [Google Scholar]
- Kverneland A.H., Streitz M., Geissler E., Hutchinson J., Vogt K., Boës D., Niemann N., Pedersen A.E., Schlickeiser S., Sawitzki B. Age and gender leucocytes variances and references values generated using the standardized ONE-Study protocol. Cytometry A. 2016;89:543–564. doi: 10.1002/cyto.a.22855. [DOI] [PubMed] [Google Scholar]
- Lee A.J., Chen B., Chew M.V., Barra N.G., Shenouda M.M., Nham T., van Rooijen N., Jordana M., Mossman K.L., Schreiber R.D., et al. Inflammatory monocytes require type I interferon receptor signaling to activate NK cells via IL-18 during a mucosal viral infection. J Exp Med. 2017;214:1153–1167. doi: 10.1084/jem.20160880. [DOI] [PMC free article] [PubMed] [Google Scholar]
- Lee A.J., Mian F., Poznanski S.M., Stackaruk M., Chan T., Chew M.V., Ashkar A.A. Type I Interferon Receptor on NK Cells Negatively Regulates Interferon-γ Production. Front Immunol. 2019;10:1261. doi: 10.3389/fimmu.2019.01261. [DOI] [PMC free article] [PubMed] [Google Scholar]
- Lenth R.V. Least-Squares Means: The R Package lsmeans. J Stat Softw. 2016;69:1–33. [Google Scholar]
- Levine J.H., Simonds E.F., Bendall S.C., Davis K.L., Amir el-A.D., Tadmor M.D., Litvin O., Fienberg H.G., Jager A., Zunder E.R., et al. Data-Driven Phenotypic Dissection of AML Reveals Progenitor-like Cells that Correlate with Prognosis. Cell. 2015;162:184–197. doi: 10.1016/j.cell.2015.05.047. [DOI] [PMC free article] [PubMed] [Google Scholar]
- Liao M., Liu Y., Yuan J., Wen Y., Xu G., Zhao J., Cheng L., Li J., Wang X., Wang F., et al. Single-cell landscape of bronchoalveolar immune cells in patients with COVID-19. Nat Med. 2020;26:842–844. doi: 10.1038/s41591-020-0901-9. [DOI] [PubMed] [Google Scholar]
- Liberzon A., Birger C., Thorvaldsdóttir H., Ghandi M., Mesirov J.P., Tamayo P. The Molecular Signatures Database (MSigDB) hallmark gene set collection. Cell Syst. 2015;1:417–425. doi: 10.1016/j.cels.2015.12.004. [DOI] [PMC free article] [PubMed] [Google Scholar]
- Liu T., Zhang L., Joo D., Sun S.-C. NF-κB signaling in inflammation. Signal Transduct. Target. Ther. 2017;2:1–9. doi: 10.1038/sigtrans.2017.23. [DOI] [PMC free article] [PubMed] [Google Scholar]
- Lucas C., Wong P., Klein J., Castro T.B.R., Silva J., Sundaram M., Ellingson M.K., Mao T., Oh J.E., Israelow B., et al. Yale IMPACT Team Longitudinal analyses reveal immunological misfiring in severe COVID-19. Nature. 2020;584:463–469. doi: 10.1038/s41586-020-2588-y. [DOI] [PMC free article] [PubMed] [Google Scholar]
- Maier M.J. WU Vienna University of Economics and Business; 2021. DirichletReg: Dirichlet Regression for Compositional Data in R. [Google Scholar]
- Marshall J.D., Heeke D.S., Abbate C., Yee P., Van Nest G. Induction of interferon-γ from natural killer cells by immunostimulatory CpG DNA is mediated through plasmacytoid-dendritic-cell-produced interferon-α and tumour necrosis factor-α. Immunology. 2006;117:38–46. doi: 10.1111/j.1365-2567.2005.02261.x. [DOI] [PMC free article] [PubMed] [Google Scholar]
- Martin M. Cutadapt removes adapter sequences from high-throughput sequencing reads. EMBnet J. 2011;17:10–12. [Google Scholar]
- Maucourant C., Filipovic I., Ponzetta A., Aleman S., Cornillet M., Hertwig L., Strunz B., Lentini A., Reinius B., Brownlie D., et al. Karolinska COVID-19 Study Group Natural killer cell immunotypes related to COVID-19 disease severity. Sci. Immunol. 2020;5:eabd6832. doi: 10.1126/sciimmunol.abd6832. [DOI] [PMC free article] [PubMed] [Google Scholar]
- McInnes L., Healy J., Saul N., Großberger L. UMAP: Uniform Manifold Approximation and Projection. J. Open Source Softw. 2018;3:861. [Google Scholar]
- Melville J., Lun A., Djekidel M.N., Hao Y. 2020. uwot: The Uniform Manifold Approximation and Projection (UMAP) Method for Dimensionality Reduction. https://cran.r-project.org/web/packages/uwot/index.html. [Google Scholar]
- Merino A., Zhang B., Dougherty P., Luo X., Wang J., Blazar B.R., Miller J.S., Cichocki F. Chronic stimulation drives human NK cell dysfunction and epigenetic reprograming. J. Clin. Invest. 2019;129:3770–3785. doi: 10.1172/JCI125916. [DOI] [PMC free article] [PubMed] [Google Scholar]
- Miyagi T., Gil M.P., Wang X., Louten J., Chu W.-M., Biron C.A. High basal STAT4 balanced by STAT1 induction to control type 1 interferon effects in natural killer cells. J. Exp. Med. 2007;204:2383–2396. doi: 10.1084/jem.20070401. [DOI] [PMC free article] [PubMed] [Google Scholar]
- Monticelli L.A., Sonnenberg G.F., Abt M.C., Alenghat T., Ziegler C.G.K., Doering T.A., Angelosanto J.M., Laidlaw B.J., Yang C.Y., Sathaliyawala T., et al. Innate lymphoid cells promote lung-tissue homeostasis after infection with influenza virus. Nat. Immunol. 2011;12:1045–1054. doi: 10.1031/ni.2131. [DOI] [PMC free article] [PubMed] [Google Scholar]
- Ni L., Ye F., Cheng M.-L., Feng Y., Deng Y.-Q., Zhao H., Wei P., Ge J., Gou M., Li X., et al. Detection of SARS-CoV-2-Specific Humoral and Cellular Immunity in COVID-19 Convalescent Individuals. Immunity. 2020;52:971–977.e3. doi: 10.1016/j.immuni.2020.04.023. [DOI] [PMC free article] [PubMed] [Google Scholar]
- Nowicka M., Krieg C., Crowell H.L., Weber L.M., Hartmann F.J., Guglietta S., Becher B., Levesque M.P., Robinson M.D. CyTOF workflow: differential discovery in high-throughput high-dimensional cytometry datasets. F1000Res. 2017;6:748. doi: 10.12688/f1000research.11622.1. [DOI] [PMC free article] [PubMed] [Google Scholar]
- Ong S., Ligons D.L., Barin J.G., Wu L., Talor M.V., Diny N., Fontes J.A., Gebremariam E., Kass D.A., Rose N.R., et al. Natural Killer Cells Limit Cardiac Inflammation and Fibrosis by Halting Eosinophil Infiltration. Am J Pathol. 2015;185:847–861. doi: 10.1016/j.ajpath.2014.11.023. [DOI] [PMC free article] [PubMed] [Google Scholar]
- Osman M., Faridi R.M., Sligl W., Shabani-Rad M.-T., Dharmani-Khan P., Parker A., Kalra A., Tripathi M.B., Storek J., Cohen Tervaert J.W., Khan F.M. Impaired natural killer cell counts and cytolytic activity in patients with severe COVID-19. Blood Adv. 2020;4:5035–5039. doi: 10.1182/bloodadvances.2020002650. [DOI] [PMC free article] [PubMed] [Google Scholar]
- Qiu P., Simonds E.F., Bendall S.C., Gibbs K.D., Jr., Bruggner R.V., Linderman M.D., Sachs K., Nolan G.P., Plevritis S.K. Extracting a cellular hierarchy from high-dimensional cytometry data with SPADE. Nat Biotechnol. 2011;29:886–891. doi: 10.1038/nbt.1991. [DOI] [PMC free article] [PubMed] [Google Scholar]
- Radaeva S., Sun R., Jaruga B., Nguyen V.T., Tian Z., Gao B. Natural killer cells ameliorate liver fibrosis by killing activated stellate cells in NKG2D-dependent and tumor necrosis factor-related apoptosis-inducing ligand-dependent manners. Gastroenterology. 2006;130:435–452. doi: 10.1053/j.gastro.2005.10.055. [DOI] [PubMed] [Google Scholar]
- Rajaram S., Canaday L.M., Ochayon D.E., Rangel K.M., Ali A., Gyurova I.E., Krishnamurthy D., Fletcher J.S., Reighard S.D., Cox A., et al. The Promise and Peril of Natural Killer Cell Therapies in Pulmonary Infection. Immunity. 2020;52:887–889. doi: 10.1016/j.immuni.2020.04.018. [DOI] [PMC free article] [PubMed] [Google Scholar]
- Reyes M., Filbin M.R., Bhattacharyya R.P., Billman K., Eisenhaure T., Hung D.T., Levy B.D., Baron R.M., Blainey P.C., Goldberg M.B., et al. An immune-cell signature of bacterial sepsis. Nat Med. 2020;26:333–340. doi: 10.1038/s41591-020-0752-4. [DOI] [PMC free article] [PubMed] [Google Scholar]
- Salerno F., Engels S., van den Biggelaar M., van Alphen F.P.J., Guislain A., Zhao W., Hodge D.L., Bell S.E., Medema J.P., von Lindern M., et al. Translational repression of pre-formed cytokine-encoding mRNA prevents chronic activation of memory T cells. Nat. Immunol. 2018;19:828–837. doi: 10.1038/s41590-018-0155-6. [DOI] [PMC free article] [PubMed] [Google Scholar]
- Sawitzki B., Harden P.N., Reinke P., Moreau A., Hutchinson J.A., Game D.S., Tang Q., Guinan E.C., Battaglia M., Burlingham W.J., et al. Regulatory cell therapy in kidney transplantation (The ONE Study): a harmonised design and analysis of seven non-randomised, single-arm, phase 1/2A trials. Lancet. 2020;395:1627–1639. doi: 10.1016/S0140-6736(20)30167-7. [DOI] [PMC free article] [PubMed] [Google Scholar]
- Schulien I., Kemming J., Oberhardt V., Wild K., Seidel L.M., Killmer S., Sagar, Daul F., Salvat Lago M., Decker A., et al. Characterization of pre-existing and induced SARS-CoV-2-specific CD8+ T cells. Nat. Med. 2021;27:78–85. doi: 10.1038/s41591-020-01143-2. [DOI] [PubMed] [Google Scholar]
- Schulte-Schrepping J., Reusch N., Paclik D., Baßler K., Schlickeiser S., Zhang B., Krämer B., Krammer T., Brumhard S., Bonaguro L., et al. Deutsche COVID-19 OMICS Initiative (DeCOI) Severe COVID-19 Is Marked by a Dysregulated Myeloid Cell Compartment. Cell. 2020;182:1419–1440.e23. doi: 10.1016/j.cell.2020.08.001. [DOI] [PMC free article] [PubMed] [Google Scholar]
- Schultheiß C., Paschold L., Simnica D., Mohme M., Willscher E., von Wenserski L., Scholz R., Wieters I., Dahlke C., Tolosa E., et al. Next-Generation Sequencing of T and B Cell Receptor Repertoires from COVID-19 Patients Showed Signatures Associated with Severity of Disease. Immunity. 2020;53:442–455.e4. doi: 10.1016/j.immuni.2020.06.024. [DOI] [PMC free article] [PubMed] [Google Scholar]
- Schultze J.L., Aschenbrenner A.C. COVID-19 and the human innate immune system. Cell. 2021;184:1671–1692. doi: 10.1016/j.cell.2021.02.029. [DOI] [PMC free article] [PubMed] [Google Scholar]
- Smith S.L., Kennedy P.R., Stacey K.B., Worboys J.D., Yarwood A., Seo S., Solloa E.H., Mistretta B., Chatterjee S.S., Gunaratne P., et al. Diversity of peripheral blood human NK cells identified by single-cell RNA sequencing. Blood Adv. 2020;4:1388–1406. doi: 10.1182/bloodadvances.2019000699. [DOI] [PMC free article] [PubMed] [Google Scholar]
- Stephenson E., Reynolds G., Botting R.A., Calero-Nieto F.J., Morgan M.D., Tuong Z.K., Bach K., Sungnak W., Worlock K.B., Yoshida M., et al. Cambridge Institute of Therapeutic Immunology and Infectious Disease-National Institute of Health Research (CITIID-NIHR) COVID-19 BioResource Collaboration Single-cell multi-omics analysis of the immune response in COVID-19. Nat. Med. 2021;27:904–916. doi: 10.1038/s41591-021-01329-2. [DOI] [PMC free article] [PubMed] [Google Scholar]
- Stuart T., Butler A., Hoffman P., Hafemeister C., Papalexi E., Mauck W.M., 3rd, Hao Y., Stoeckius M., Smibert P., Satija R. Comprehensive Integration of Single-Cell Data. Cell. 2019;177:1888–1902.e21. doi: 10.1016/j.cell.2019.05.031. [DOI] [PMC free article] [PubMed] [Google Scholar]
- Su Y., Chen D., Yuan D., Lausted C., Choi J., Dai C.L., Voillet V., Duvvuri V.R., Scherler K., Troisch P., et al. ISB-Swedish COVID19 Biobanking Unit Multi-Omics Resolves a Sharp Disease-State Shift between Mild and Moderate COVID-19. Cell. 2020;183:1479–1495.e20. doi: 10.1016/j.cell.2020.10.037. [DOI] [PMC free article] [PubMed] [Google Scholar]
- Toptan T., Hoehl S., Westhaus S., Bojkova D., Berger A., Rotter B., Hoffmeier K., Cinatl J., Jr., Ciesek S., Widera M. Optimized qRT-PCR Approach for the Detection of Intra- and Extra-Cellular SARS-CoV-2 RNAs. Int. J. Mol. Sci. 2020;21:4396. doi: 10.3390/ijms21124396. [DOI] [PMC free article] [PubMed] [Google Scholar]
- Vabret N., Britton G.J., Gruber C., Hegde S., Kim J., Kuksin M., Levantovsky R., Malle L., Moreira A., Park M.D., et al. Sinai Immunology Review Project Immunology of COVID-19: Current State of the Science. Immunity. 2020;52:910–941. doi: 10.1016/j.immuni.2020.05.002. [DOI] [PMC free article] [PubMed] [Google Scholar]
- Varchetta S., Mele D., Oliviero B., Mantovani S., Ludovisi S., Cerino A., Bruno R., Castelli A., Mosconi M., Vecchia M., et al. Unique immunological profile in patients with COVID-19. Cell. Mol. Immunol. 2020;18:604–612. doi: 10.1038/s41423-020-00557-9. [DOI] [PMC free article] [PubMed] [Google Scholar]
- Wang D., Hu B., Hu C., Zhu F., Liu X., Zhang J., Wang B., Xiang H., Cheng Z., Xiong Y., et al. Clinical Characteristics of 138 Hospitalized Patients With 2019 Novel Coronavirus-Infected Pneumonia in Wuhan, China. JAMA. 2020;323:1061–1069. doi: 10.1001/jama.2020.1585. [DOI] [PMC free article] [PubMed] [Google Scholar]
- Wang F., Nie J., Wang H., Zhao Q., Xiong Y., Deng L., Song S., Ma Z., Mo P., Zhang Y. Characteristics of Peripheral Lymphocyte Subset Alteration in COVID-19 Pneumonia. J. Infect. Dis. 2020;221:1762–1769. doi: 10.1093/infdis/jiaa150. [DOI] [PMC free article] [PubMed] [Google Scholar]
- Wickham H. Springer International Publishing; Cham, Switzerland: 2016. ggplot2: Elegant Graphics for Data Analysis. [Google Scholar]
- Wilk A.J., Rustagi A., Zhao N.Q., Roque J., Martínez-Colón G.J., McKechnie J.L., Ivison G.T., Ranganath T., Vergara R., Hollis T., et al. A single-cell atlas of the peripheral immune response in patients with severe COVID-19. Nat. Med. 2020;26:1070–1076. doi: 10.1038/s41591-020-0944-y. [DOI] [PMC free article] [PubMed] [Google Scholar]
- Williamson E.J., Walker A.J., Bhaskaran K., Bacon S., Bates C., Morton C.E., Curtis H.J., Mehrkar A., Evans D., Inglesby P., et al. Factors associated with COVID-19-related death using OpenSAFELY. Nature. 2020;584:430–436. doi: 10.1038/s41586-020-2521-4. [DOI] [PMC free article] [PubMed] [Google Scholar]
- Xu G., Qi F., Li H., Yang Q., Wang H., Wang X., Liu X., Zhao J., Liao X., Liu Y., et al. The differential immune responses to COVID-19 in peripheral and lung revealed by single-cell RNA sequencing. Cell Discov. 2020;6:73. doi: 10.1038/s41421-020-00225-2. [DOI] [PMC free article] [PubMed] [Google Scholar]
- Yang C., Siebert J.R., Burns R., Gerbec Z.J., Bonacci B., Rymaszewski A., Rau M., Riese M.J., Rao S., Carlson K.-S., et al. Heterogeneity of human bone marrow and blood natural killer cells defined by single-cell transcriptome. Nat. Commun. 2019;10:3931. doi: 10.1038/s41467-019-11947-7. [DOI] [PMC free article] [PubMed] [Google Scholar]
- Yang H., Xia L., Chen J., Zhang S., Martin V., Li Q., Lin S., Chen J., Calmette J., Lu M., et al. Stress-glucocorticoid-TSC22D3 axis compromises therapy-induced antitumor immunity. Nat. Med. 2019;25:1428–1441. doi: 10.1038/s41591-019-0566-4. [DOI] [PubMed] [Google Scholar]
- Yao C., Bora S.A., Parimon T., Zaman T., Friedman O.A., Palatinus J.A., Surapaneni N.S., Matusov Y.P., Chiang G.C., Kassar A.G., et al. Cell-Type-Specific Immune Dysregulation in Severely Ill COVID-19 Patients. Cell Rep. 2021;34:108590. doi: 10.1016/j.celrep.2020.108590. [DOI] [PMC free article] [PubMed] [Google Scholar]
- Yu G., Wang L.-G., Han Y., He Q.-Y. clusterProfiler: an R package for comparing biological themes among gene clusters. OMICS. 2012;16:284–287. doi: 10.1089/omi.2011.0118. [DOI] [PMC free article] [PubMed] [Google Scholar]
- Yu J., Tostanoski L.H., Peter L., Mercado N.B., McMahan K., Mahrokhian S.H., Nkolola J.P., Liu J., Li Z., Chandrashekar A., et al. DNA vaccine protection against SARS-CoV-2 in rhesus macaques. Science. 2020;369:806–811. doi: 10.1126/science.abc6284. [DOI] [PMC free article] [PubMed] [Google Scholar]
- Zhang P., Lu Y., Gao S. High-mobility group box 2 promoted proliferation of cervical cancer cells by activating AKT signaling pathway. J. Cell. Biochem. 2019;120:17345–17353. doi: 10.1002/jcb.28998. [DOI] [PubMed] [Google Scholar]
- Zhang Q., Bastard P., Liu Z., Le Pen J., Moncada-Velez M., Chen J., Ogishi M., Sabli I.K.D., Hodeib S., Korol C., et al. COVID-STORM Clinicians. COVID Clinicians. Imagine COVID Group. French COVID Cohort Study Group. CoV-Contact Cohort. Amsterdam UMC Covid-19 Biobank. COVID Human Genetic Effort. NIAID-USUHS/TAGC COVID Immunity Group Inborn errors of type I IFN immunity in patients with life-threatening COVID-19. Science. 2020;370:eabd4570. doi: 10.1126/science.abd4570. [DOI] [PMC free article] [PubMed] [Google Scholar]
- Zhou F., Yu T., Du R., Fan G., Liu Y., Liu Z., Xiang J., Wang Y., Song B., Gu X., et al. Clinical course and risk factors for mortality of adult inpatients with COVID-19 in Wuhan, China: a retrospective cohort study. Lancet. 2020;395:1054–1062. doi: 10.1016/S0140-6736(20)30566-3. [DOI] [PMC free article] [PubMed] [Google Scholar]
Associated Data
This section collects any data citations, data availability statements, or supplementary materials included in this article.
Supplementary Materials
Data Availability Statement
Single-cell RNA-seq data have been deposited at the European Genome-phenome Archive (EGA) and are publicly available as of the date of publication. Accession numbers are listed in the Key resources table.
All original code is publicly available as of the date of publication. DOIs are listed in the Key resources table.
Any additional information required to reanalyze the data reported in this paper is available from the lead contact upon request.