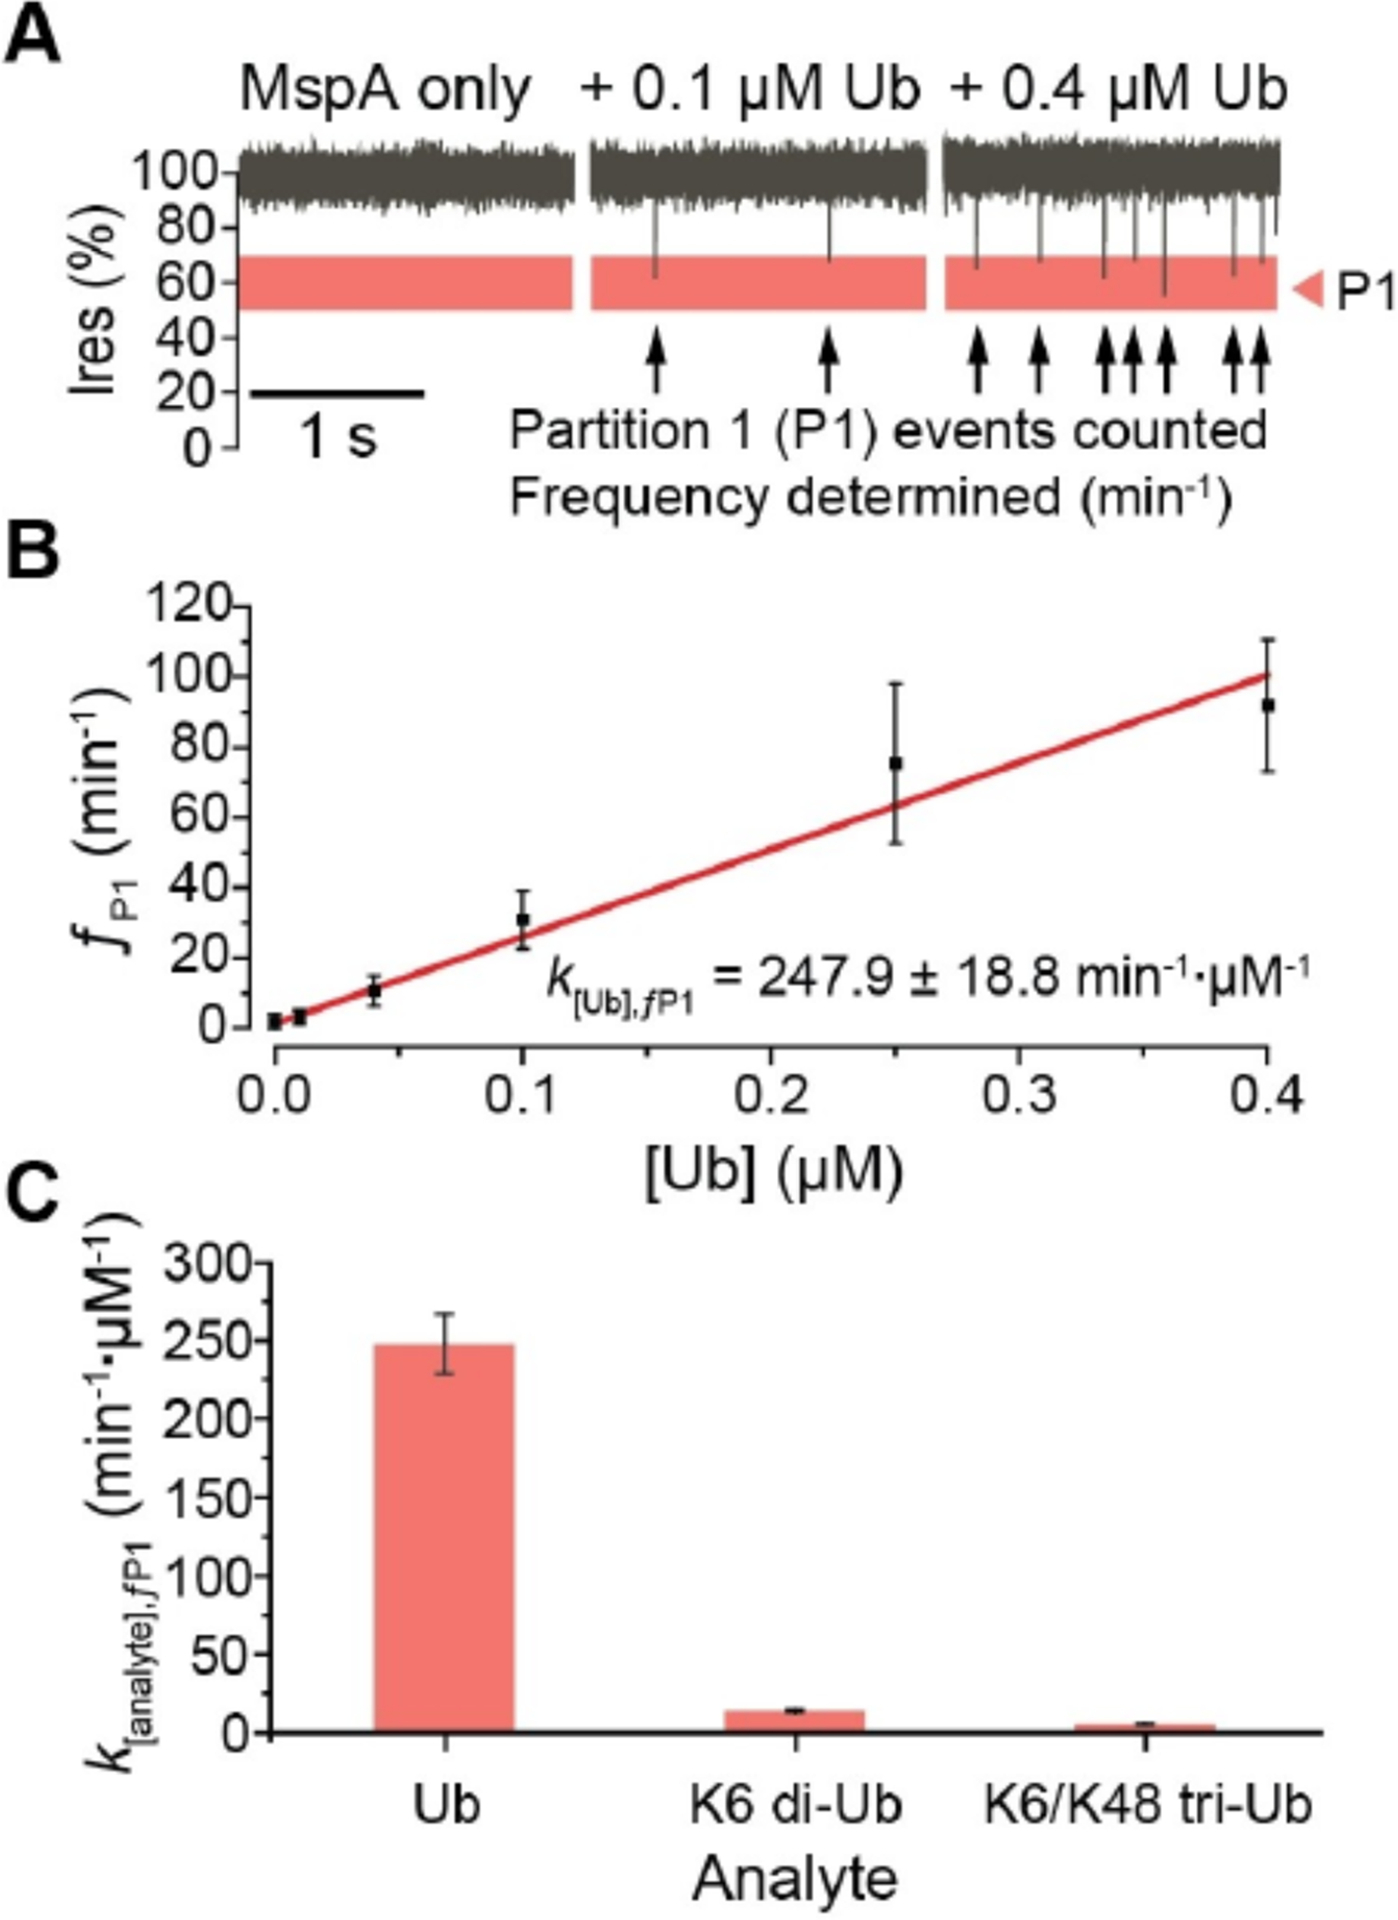
Figure 3.

Concentration dependence of Ub analytes. A) Current traces of MspA pore in the presence of increasing concentrations of Ub monomer. Single channel current measurements were performed in buffer containing 150 mM NaCl, 1% glycerol (v/v), 20 mM HEPES, pH 7.4 at 23 °C, and under an applied transmembrane potential of +200 mV (applied to the trans electrode). B) Concentration calibration curve of Ub monomer P1 event frequencies (ƒP1). C) Concentration calibrated event frequencies for each analyte in P1 (k[analyte],ƒP1).
