

Abstract
Purpose:
There is increasing effort to discover and integrate predictive and/or prognostic biomarkers into treatment algorithms. While tissue-based methods can reveal tumor-immune cell compositions at a single time point, we propose that single-cell sampling via fine needle aspirates (FNA) can facilitate serial assessment of the tumor immune microenvironment (TME) with a favorable risk-benefit profile.
Experimental Design:
Primary antibodies directed against 20 murine and 25 human markers of interest were chemically modified via a custom linker–bioorthogonal quencher (FAST) probe. A FAST-FNA cyclic imaging and analysis pipeline were developed to derive quantitative response scores. Single cells were harvested via FNA and characterized phenotypically and functionally both in preclinical and human samples using the newly developed FAST-FNA assay.
Results:
FAST-FNA samples analyzed manually versus the newly developed deep learning-assisted pipeline gave highly concordant results. Subsequently, an agreement analysis showed that FAST and flow cytometry of surgically resected tumors were positively correlated with an R2=0.97 in preclinical samples and an R2=0.86 in human samples with the detection of the relevant tumor and immune biomarkers of interest. Lastly, the feasibility of applying this minimally invasive approach to analyze the TME during immunotherapy was assessed in cancer patients revealing local anti-tumor immune programs.
Conclusions:
The FAST-FNA is an innovative technology that combines bioorthogonal chemistry coupled with a computational analysis pipeline for the comprehensive profiling of single cells obtained through FNA. This is the first demonstration that the complex and rapidly evolving TME during treatment can be accurately and serially measured by simple FNA.
Introduction
Immunotherapy is rapidly expanding the treatment landscape available to cancer patients. As the field continues to develop and translate novel and combinatorial agents, there is an increasing need to identify predictive and/or prognostic biomarkers that can guide personalized cancer treatment recommendations. One of the most prominent predictive biomarkers of response to immune checkpoint inhibitors (ICIs) is programmed cell death ligand 1 (PD-L1) expression(1, 2) within the tumor immune microenvironment (TME) which has resulted in the Food and Drug Administration (FDA) approval of a companion diagnostic for ICIs across several tumor types. This paradigm shift brings to the forefront two challenges with implementing routine biomarker testing. First, the acquisition of a fresh tumor biopsy to be tested for PD-L1 expression via immunohistochemistry (IHC) may delay the start of therapy by several days to weeks. Second, although PD-L1 can be expressed at high levels, only 10-20% of patients respond to anti-PD-1 therapy(3, 4) showing the limited utility of this FDA approved metric(5–8). Therefore, there is a need to not only develop rapid and safe assessment methods of the TME, but also tailor personalized approaches through composite biomarker development and application. These goals have recently been identified as 2 of the top 10 challenges in cancer immunotherapy(9).
Sampling of a tumor is commonly performed by image guided core biopsy, surgical excisional or incisional biopsies, or fine needle aspiration (FNA) biopsy. Some of these methods yield abundant tissue for sectioning and staining (core and open surgical biopsies for histopathology) while others yield scant cellular materials (FNA for cytopathology). FNA can often be performed with minimal intervention using small gauge needles (20-25 G), have very low complication rates, and are generally well-tolerated(10). As such, image-guided FNAs are ideally suited for biomarker sampling due to the comparatively low risk of procedural complications and the ability to obtain serial specimens to monitor response during therapy. Unfortunately, the current FNA/cytopathology workflows are labor intensive, rely on single channel immunohistochemistry rather than multichannel fluorescence microscopy, and require centralized sample processing and expert cytopathology review. Furthermore, FNA biopsies are often paucicellular, limiting the number of stains that can be done on separate sub-fractions of the clinical sample. These factors limit throughput, cost-efficiency, and practicality of implementing multiplex-based technologies for rapid onsite assessment.
Here, we report on the development, testing, and validation of a novel multi-dimensional assay (FAST-FNA) which allows for the rapid assessment of dozens of tumor and immune cell markers on single cells obtained from FNAs. The method relies on innovative bioorthogonal cycling reagents that allow destaining of fluorescent labels within seconds while still preserving the integrity of cells. Thus, it is possible to image 20-40 molecular markers per cell in paucicellular FNA samples and provide comprehensive TME analysis. The advance brought forth by the single-cell FAST-FNA technology over alternative methods such as flow cytometry or mass cytometry is that there is minimal cell loss incurred from the needle to the slide, allowing the analysis of all of the harvested cells. Based on the favorable risk-benefit profile of FNAs over core biopsies, we demonstrate that the FAST-FNA technology makes feasible for the first time the serial analysis of the evolving TME during cancer treatment.
Materials and Methods
Materials
Vendors and catalog numbers of the antibodies used for immunoprofiling of mouse samples and clinical samples are summarized in Supplementary Table 1 and 2. All antibodies were tested and validated on positive cell lines, mouse splenocytes, or peripheral blood mononuclear cells (Innovative Research Inc.) for validation before usage. Anti-PD-1 antibody for treatment of murine tumor models were purchased from Bio X Cell (Clone: 29F.1A12, Cat# BE0273, RRID:AB_2687796). The MC38 (mouse colorectal cancer) cell line was a kind gift from Mark Smyth, QIMR Berghofer Medical Research Institute), and MOC (mouse oral cavity squamous cell cancer) cell lines were purchased from Kerafast (RRID:CVCL_ZD33, RRID:CVCL_ZD36) with STR profiles for authentication. Mycoplasma testing was performed every 3 months, using MycoAlert PLUS mycoplasma detection kit (Lonza). Cells under passage number 5 after thawing were implanted for tumor growth on mice.
Animals
Female and male WT C57BL6 mice with 8 weeks of age were purchased from Jackson Laboratory (Cat#000664) for tumor implantation of MC38, MOC2, and MOC22 tumors. All animals were housed under specific pathogen free conditions at the Massachusetts General Hospital. Experiments were approved by the MGH Institutional Animal Care and Use Committee (IACUC) and were performed in accordance with MGH IACUC regulations.
Synthesis of fluorochrome/quencher pair
FAST probes are built around a modular linker between fluorochromes and antibodies with an embedded TCO for clicking with a tetrazine-quencher. FAST probes were custom synthesized at large scale as described in detail in our previous study, stored as the carboxylic acids, and activated for antibody labeling with our in-situ activation chemistry, which eliminates the need for purification and long-term storage of the NHS esters(11). The dTCO-PEG6-CO2H blocking reagent was synthesized from dTCO-PNP and amino-dPEG6-CO2H and characterized by LCMS, as described in Supplementary Figure S1. All reagents were obtained from commercial sources at the highest grade available and used without further purification. Fluorophores were purchased from Click Chemistry Tools or Fluoroprobes. BHQ®−3 Amine was purchased from LGC Biosearch Technologies. N-α-Boc-N-ε-Fmoc-Lysine was purchased from Chem-Impex. Amino-dPEG®n-carboxylic acids (n=4,6) were obtained from Quanta BioDesign. Dry solvents and coupling reagents were obtained from Sigma Aldrich. rTCO-PNP and dTCO-PNP were a generous gift of Dr. Hannes Mikula (TU Wien, Austria).
Antibody modifications
BSA-free antibodies were purchased (Supplementary Table 1 and 2) and then modified with FAST probes as described. Antibodies were exchanged into bicarbonate buffer (pH 8.4) using a 40k zeba column (Thermo Fisher). After buffer exchange, antibodies were incubated with a 5- to 10-fold molar excess of the Dye-TCO-NHS molecule (FAST probe) with 10% DMSO for 25 mins at room temperature protected from light. The conjugation reaction was loaded onto another 40k zeba column equilibrated with PBS for desalting and removal of unreacted dye molecules. To determine the degree of labeling (DOL), the absorbance spectrum of the FAST-labeled antibody was measured using a Nanodrop 1000 (Thermo Scientific), applying the known extinction coefficients of the dye, IgG antibody, and correction factor for the dye absorbance at 280nm. The FAST-labeled antibodies were stored in the dark at 4°C in PBS until usage. All antibody conjugates were validated using spleen cells and peripheral blood mononuclear cells prior to FAST-FNA application.
Mouse tumor fine needle aspirate (FNA)
C57BL6 mice (Jackson Laboratory) were injected subcutaneously with 2 × 10⁶ of MC38 cells, 2 × 10⁶ of MOC22 cells, or 0.5 × 10⁶ of MOC2 cells in 50 μl of sterile PBS. Since MOC2 is a very aggressive tumor, less amount of MOC2 cells were injected to match the tumor growth rate of MOC2 and MOC22. When tumors reach ~40 mm3 of sizes after 1–2 weeks of tumor growth on the lower backs, mice were anesthetized with 2% Isofluorane inhalation for FNA procedure. An FNA sample was obtained by inserting and withdrawing a 25G needle within a tumor tissue, applying slight negative pressure. Each needle pass was made at a different angle within the tumor tissue in order to obtain cells across diverse regions within the tumors. This step was repeated multiple times similarly as is done clinically. Collected samples were flushed out of syringe with RPMI into 1.5-mL Eppendorf tubes and kept on ice. FNA samples were washed with PBS and fixed in 4% paraformaldehyde. Fixed cells were then attached to glass slides using Cytospin Centrifuge (Thermo Scientific, RRID:SCR_020507) at 850 rpm for 5 minutes prior to imaging. Octospot 8-well strips (Thermo Scientific) was used to attach cells in a defined area on glass slides. Blinded data analysis was implemented for the immune cell profiling of FNA samples. Mouse experiments were repeated at least 3 times.
Immunostaining and quenching for FAST imaging
Cells were fixed for 10 minutes with 4% PFA and permeabilized for 15 minutes with 0.3% Triton-X100 prior to staining. Permeabilization allowed for assessment of intracellular proteins, such as IL-12. Immunostaining for FAST imaging was performed in accordance with typical immunofluorescence protocols. After blocking with Odyssey buffer (LI-COR Biosciences) for 30 minutes, cells were stained with FAST-conjugated antibodies for 15-30 minutes at room temperature in the dark. Antibodies were diluted to 1-5 μg/ml in Odyssey buffer before staining. Stained cells were washed with PBS (3 washes, each 3 minutes in duration) to remove unbound antibody before imaging. Following image acquisition, cells were briefly incubated with 10 μM Tz-BHQ (<10 seconds) in PBS-bicarbonate buffer (pH 9) for quenching. Free Tz-BHQ was removed by three washes with PBS, and the cells were imaged again in the same fields of view to record quenched signal. Before antibody staining of the subsequent cycle, cells were briefly incubated in a solution of 10 μM dTCO-PEG6-CO2H in order to block any residual Tz-BHQ3 from reacting with FAST antibodies of the next cycle. The same staining, imaging, and quenching cycle was repeated until all of the target proteins were imaged. A fraction of sample was set aside and incubated with isotype antibodies as a negative control. The controls were imaged every cycle following the same protocol as described above.”
Fluorescent imaging and manual analysis
An Olympus BX-63 upright automated epifluorescence microscope was used to acquire fluorescent images. DAPI, FITC, Cy3, TRITC, and Cy5 filter cubes were used to excite DAPI/Hoechst nuclear stains, AF488, AF555, AF594, and AF647 fluorophores respectively. Depending on the density of cells on the glass slides, 20-40 fields of view were imaged for each specimen to capture a total cell population sufficient for analysis. X-Y coordinate positions at each field of view were saved to enable rapid imaging of the same set of cells in every cycle using Multi Dimensional Acquisition in Metamorph software (RRID:SCR_002368). “IdentifyObjectsManually” module in Cell Profiler was used for manual cell segmentation, and “MeasureObjectIntensity” module in Cell Profiler was used to measure the fluorescent intensities in cells for comparison to the deep learning pipeline described in Figure 2 and Supplementary Figure S2).
Figure 2. FAST-FNA cyclic imaging and deep learning-assisted analysis pipeline.

A. An example field of view of a MC38 tumor FNA in the first three cycles of FAST imaging. Images are zoomed in to show different staining patterns of the immune cell markers. In each cycle three markers were stained with FAST antibodies equipped with AF488, AF555 or AF647. After imaging, the fluorescent signals were quenched with BHQ3-Tz before the next antibody staining of the following cycle. Nuclear staining by DAPI was imaged at each cycle to facilitate image registration. (Scale bar = 50 μm). B. Overview of the image analysis pipeline. A reference channel (CD45) is selected for alignment of all channels imaged at different cycles. Sum projection of aligned images are used for segmentation of all DAPI+ cells, using a convolutional neural net. After cell segmentation, single-cell fluorescence intensities of all protein markers are measured. Finally, each cell type was determined by combinations of positive and negative markers, and the fraction of each cell type was calculated to analyze the immune composition. C. Performance quality of automated cell segmentation was compared to manual cell segmentation. The signal measurement obtained by deep learning-based cell segmentation and by manual segmentation showed high correlation (R2 = 0.995).
Deep learning-assisted image analysis
Immune cells were identified and segmented using DAPI signal of the last image cycle and CD45 as input, and non-immune cells were segmented using maximum-intensity projection of all channels. A small fraction of cells (typically well below <10%) that were lost during repeat imaging cycles were excluded from the image analysis. Acquired images were corrected for an illumination function and aligned using normalized cross correlation to compensate for minor pixel shifts that occur during imaging. For background correction, fluorescence signals measured in quenched images were subtracted pixel-by-pixel from the immuno-stained images of the following cycle. For single-cell segmentation, two fully convolutional neural networks were trained to classify image pixels into one of three categories: background, cell boundary and cell interior (Supplementary Fig. S2A and B). Immune cells were identified and segmented using CD45 and DAPI signals as input, and non-immune cells were segmented using maximum-intensity projection of all channels. CD45 staining in identified immune cells defined the region of interest of other immune markers. All code used in this project is publicly posted in GitHub under https://github.com/landeros10/fast-fna. In every identified cell, areal mean fluorescence intensity was used to determine the positivity of each protein marker. Different immune cell populations were defined based on the expression level of a combination of markers, using similar gating strategies to those of flow cytometry analysis.
FAST-FNA scores
A number of different scores were calculated following automated image analysis (Supplementary Fig. S3). The FAST-FNA PD-L1 score is the fraction of PD-L1 positive cells in a given sample that stain positively above a threshold determined by IgG control staining. This score is derived differently from CPS but there is a correlation between these two PD-L1 values (list the formula from Fig 5E; R2 = 0.8). To formulate immune scores that could distinguish responders from non-responders, the current knowledge of the anti- or pro-tumor nature of immune cell populations was employed. Specifically, the T cell score was calculated as the ratio of anti-tumorigenic cells (fractional sum of CD4+, CD8+, CD8+Granzyme B+, and CD8+IFN-ɣ+ T cells) to immunosuppressive/pro-tumorigenic cells (fraction of Treg). By the same token, the TAM score was based on the ratio of MHCII-high TAM number, which has been reported to be correlated with sensitivity to checkpoint inhibition(25, 26) to the number of MHCII-low TAMs, which have been reported to mediate tumor progression(27). The IL-12 score was generated by summation of IL-12 expression level in TAMs and DCs. IL-12 expression was calculated by multiplying the fraction of IL-12 positive cells and IL-12 signal intensity in TAMs and DCs respectively. The threshold of positive IL-12 expression was determined by the MFI of IgG isotype controls. Multiplication of all four scores (PD-L1, T cell, TAM, and IL-12 score) was used to calculate the combined score, which most effectively distinguished responders (complete and partial) from non-responders to anti-PD-1 treatment. For all scores, the fraction (F) represents the total tumor fraction for the given subscripted cell population out of all tumor cells.
Figure 5. FAST-FNA analysis of HNSCC patients.

A. HNSCC patient samples (n=9) were obtained from primary tumors that were surgically excised followed by ex vivo FNA sampling. Excised tumor tissues were then homogenized and analyzed for single cell composition by flow cytometry. B. Immune cell frequencies measured by FAST-FNA analysis were compared to those measured by flow cytometry for validation. Linear regression fit is plotted as a dotted line with the 95% confidence interval band shaded in gray (R2 = 0.86, see panel C for color code of data points). C-D. Composition of tumor and immune cells in each FNA sample. Cells expressing CK5/6 and/or p16 were defined as tumor cells, and cells expressing CD45 were defined as immune cells (C). The immune compartment of each FNA sample was further analyzed for the fractions of various immune cell populations (D). E. FAST-FNA analysis of PD-L1 expression in the HNSCC FNA samples show positive linear correlation with the combined positive scores (CPS) measured in the whole tissue sections of the same patients (R2 = 0.80). The color maps present the CPS (orange) or the FAST-FNA PD-L1 score (blue) of each patient. CPS was calculated based on IHC staining of whole tumor tissue sections (Supplementary Fig. S7). As defined in previous clinical studies(42), CPS is the number of PD-L1 staining cells (tumor cells and immune cells) divided by the total number of viable tumor cells multiplied by 100. The FAST-FNA PD-L1 score represents the percentage of PD-L1 positive cells above a threshold of staining intensity scaled to IgG isotype control. F. Composition of the PD-L1+ cell populations was analyzed in individual patient samples. For example in Patient 6, the PD-L1 positive cells are largely composed of TAMs and stromal cells. Patient 8 had the highest fraction of PD-L1 positive cells but at low intensity levels (Fig. S6). G. The percentage of PD-L1+ cells and their PD-L1 intensity in each cell type was also calculated. The PD-L1 intensity was normalized to the MFI of isotype control, and scored on the scale of 0 (−) to 3 (+++). Results from Patient 6 is shown as an example. Results from other patients are included in Supplementary Fig. S8.
Flow cytometry
Mouse tumors and spleens were excised and minced using surgical scissors. Tissues were then digested using collagenase type I (Worthington), collagenase type IV (Worthington), and DNase I (Worthington) in HBSS for 25 minutes at 37°C. Digests were passed through a 70-μm cell strainer (BD Falcon), and then washed with HBSS with 2% FBS. Samples were first incubated with True Stain FcX antibody (BioLegend) in PBS containing 0.5% BSA and 2 mM EDTA before staining with antibodies directly conjugated to fluorophores for flow cytometry. In addition to FAST labeled antibodies listed in Supplementary Table 1, antibodies against CD3E (clone 145-2C11, Biolegend Cat# 100305, RRID:AB_312670), CD4 (clone GK1.5, Biolegend Cat# 100447, RRID:AB_2564586), CD45 (clone 30-F11, Biolegend Cat# 103114, RRID:AB_312979), CD8A (clone 53-6.7, Biolegend Cat# 100714, RRID:AB_312753), CD11B (clone M1/70, Biolegend), CD11C (clone N418, Biolegend Cat# 101263, RRID:AB_2629529), F4/80 (clone BM8, Biolegend Cat# 123133, RRID:AB_2562305), MHC Class II (clone M5/114.15.2, Biolegend Cat# 107632, RRID:AB_2650896), CD25 (clone PC61, Biolegend Cat# 102024, RRID:AB_493709), FOXP3 (clone MF-14, Biolegend Cat# 126408, RRID:AB_1089115), and LY6C (clone HK1.4, Biolegend Cat# 128024, RRID:AB_10643270), LY6G (clone 1A8, Biolegend Cat# 127643, RRID:AB_2565971) were used for validation of marker staining. Propidium iodide or 7-AAD (BioLegend) was used to exclude dead cells.
Human samples were processed similarly as described above. In addition to FAST labeled antibodies listed in Supplementary Table 2, antibodies against CD3 (clone SK7, Biolegend Cat# 344805, RRID:AB_10559750), CD4 (clone SK3, Biolegend Cat# 344647, RRID:AB_2734349), CD45 (clone 2D1, Biolegend Cat# 368515, RRID:AB_2566375), CD8 (clone SK1, Biolegend Cat# 344741, RRID:AB_2566512), CD11B (clone ICRF44, Biolegend Cat# 301355, RRID:AB_2750074), CD11C (clone 3.9, Biolegend Cat# 301633, RRID:AB_2561990), CD14 (clone HCD14, Biolegend Cat# 325614, RRID:AB_830687), CD19 (clone SJ25C1, Biolegend Cat# 363013, RRID:AB_2564204), CD56 (clone 5.1H11, Biolegend Cat# 362525, RRID:AB_2564309), CD66B (clone G10F5, Biolegend Cat# 305102, RRID:AB_314494), CD68 (clone Y182A, Biolegend Cat# 333816, RRID:AB_2562936), FOXP3 (clone 206D, Biolegend Cat# 320115, RRID:AB_439800), CDKN2A /p16 (clone D7C1M, Cell Signaling Technology Cat# 80772, RRID:AB_2799960), and PD-1 (clone EH12.2H7, Biolegend Cat# 329907, RRID:AB_940473) were used for validation of marker staining. Zombie fixable viability kit (Biolegend) was used to label dead cells before fixing.
After staining of cell surface markers, cells were fixed and permeabilized using Intracellular staining kit (Biolegend) to stain for intracellular markers. Cells were washed and filtered after staining and were then analyzed on a BD LSRII flow cytometer. AbC Total Antibody Compensation Bead Kit (Thermofisher Scientific) was used for single color compensation. Flow cytometry data were then analyzed using FlowJo software (Tree Star Inc.).
Clinical samples
The study was approved by the Institutional Review Board at Massachusetts General Hospital (IRB# 2014P000559) and informed consent was obtained from all newly diagnosed and recurrent/metastatic HNSCC subjects. Three to 5 passes from minimally invasive fine needle aspirates were obtained from 15 patients. For the FNA samples obtained in vivo, the FNA samples were obtained by manual stabilization of the mass and direct visualization of the needle insertion. Care was taken to obtain FNA from non-necrotic tumor regions as assessed by the negative pressure resistance felt on the plunger of the attached syringe during the aspiration procedure. FNA samples with an insufficient number of cells for immune profiling (less than 200 cells total) were excluded from the analysis which also ensured that any necrotic tumor sampling was excluded from the analyses.
Immunohistochemistry of surgical tissue sections
Tissue sections were stained for PD-L1 using the EL1N3 antibody(41). The composite positive score (CPS) was calculated as the number of PD-L1-positive cells (tumor cells, lymphocytes, and macrophages) divided by the number of viable tumor cells, and multiplied by 100. Although theoretically that quantity can exceed 100, the maximum score is defined as 100. A minimum of 100 viable tumor cells had to be present in the PD-L1–stained slide (sectioned tumor biopsy or resection tissue) for the specimen to be considered adequate for evaluation. Tumor cells had to show either partial or complete membrane staining to be counted as ‘‘stained,’’ whereas immune cells are counted if there is any staining.
Statistical analysis
Data presented as mean ±SEM. P-values for mouse studies were calculated by multiple t-test with Holm-Sidak correction in GraphPad Prism. P-values for the immune score analysis were caulculated by non-parametric Kruskal-Wallis test was performed for statistical tests without assumption about underlying distribution and with multiple comparisons corrected by Dunn’s test. Pearson R values for the correlation between manual segmentation and deep learning-assisted segmentation R2 values for the correlation between FAST-FNA analysis and flow cytometry were calculated in GraphPad Prism.
Results
Assay development and workflow
Building on the chemistry for ultrafast cyclic immunolabeling (FAST)(11), we expanded a panel of antibody conjugates to those most relevant in analyzing the TME (Fig. 1). FAST imaging exploits highly accelerated bioorthogonal tetrazine/trans-cyclooctene (Tz/TCO) click reactions to enable iteration of rapid quenching (>99% quenching in <10 seconds) and re-staining of immunofluorescence while maintaining the integrity of single cells. FAST probes are synthesized with a ternary scaffold containing a fluorophore (AF488, AF555, AF594, or AF647), a TCO for clicking with a Tz-labeled quencher (Black hole quencher, BHQ3), and a flexible PEG4 side chain for efficient antibody labeling (Fig. 1A). We activated the FAST probes to NHS esters in situ(11) and conjugated them to antibodies against target proteins of interest (Supplementary Table 1 and 2). FNA samples were fixed in 4% PFA and spun down onto glass slides by a cytospin centrifuge for imaging (Fig. 1B). Three protein markers were imaged per cycle and the fluorescent signal was quenched with BHQ3-Tz prior to immunostaining the next three markers. This cycle was repeated until all target proteins were imaged (Fig. 1C). Nuclear staining by DAPI served as a reference marker for image registration. We further developed a computational image analysis pipeline to quantify the intensity of each marker for assessment of cell type composition, PD-L1 expression, and drug response (Fig. 1D). Typically, an FNA sample yielded ~500–5,000 cells (obtained from 3–5 passes through different regions of the tumor), all of which were imaged in a multiplexed fashion on a single slide.
Figure 1. Work flow of FAST-FNA immune profiling.

A. Antibodies against protein markers of interest on immune cells are chemically modified via a custom linker (FAST probe) that contains three arms: i) an NHS ester moiety for conjugation to the antibody; ii) one of four fluorochromes (Alexa Fluor dyes AF488, AF555, AF594, or AF647); and iii) a trans-cyclooctene (TCO) for clicking with the tetrazine (Tz) conjugated quencher (Black Hole Quencher, BHQ3-Tz). Thus FAST probe-labeled antibodies stain cells in the same fashion as antibodies with routine direct fluorophore conjugates. In contradistinction, however, cells stained with the FAST probe can be quenched in a second by addition of BHQ3-Tz, which clicks bioorthogonally with TCO. B. Cellular tumor samples are obtained via 20-22G needle passes into mouse or human tumors. The FNA are rinsed into fixation media and attached to glass slides for fluorescent cycling. C. Multiple cycles of immunofluorescence can be performed without degradation or loss of the sample. D. To facilitate the analysis of high dimensional image data, we developed a deep learning algorithm. As a result, the immune composition, PD-L1 level across various cell types, and drug response markers, such as interferon-ɣ (IFN-ɣ), granzyme B (GZMB), TCF1, CD39, and IL-12, are analyzed in each FNA sample.
Automated image analysis pipeline
Figure 2A shows a representative field of view of raw images of an FNA sample obtained from a murine tumor for the first 3 cycles of FAST imaging. The analysis of acquired images proceeded in three steps: i) image registration across cycles, ii) single-cell segmentation based on convolutional neural network, and iii) cell type classification based on single-cell biomarker intensities (Fig. 2B; Supplementary Fig. S2A and B). The fluorescence intensities of target proteins in individual cells were measured to determine the cell types and their functional status (e.g., interferon-ɣ and granzyme B expression by CD8+ T cells and IL-12 expression by macrophages and dendritic cells). We automated this pipeline to analyze the images taken from the entire cytospin area in an unbiased manner.
To evaluate the performance of the deep learning (DL)-based cell segmentation, we compared its accuracy against a manual segmentation. We used images of murine MC38 tumor tissue homogenates and measured single-cell fluorescence intensities using both DL and manual methods. This analysis showed that the automated DL method yielded results that were essentially indistinguishable from the manual method (Fig. 2C). Across 298 images which contain 6694 cells in total, the correlation of cell number identified per sample was 0.986 with a 8.5 % false positive and 5.5 % false negative cell detection rates. At the single cell level, the correlation of cell area was 0.902, and the correlations of the mean fluorescent intensity were >0.990 for all markers.
We next benchmarked the accuracy of cell classification by our analysis pipeline against flow cytometry results. To generate a comparison standard, we profiled tumor homogenates (n = 4 MC38 mouse tumors) through flow cytometry and obtained the fractions of immune cell populations (8 cell types). We used aliquots of the same samples for FAST imaging and analyzed with three segmentation methods: manual, Cell Profiler (open software), and the DL. The classification based on DL segmentation well matched the flow cytometry results (Pearson’s coefficient r = 0.98; Supplementary Fig. S2C and D), comparable to those based on the manual and Cell Profiler’s segmentations (Supplementary Fig. S2C). The DL-based method, however, was faster than the manual method (>14 fold) and Cell Profiler (>2 fold) (Supplementary Fig. S2D). Of note, the current DL algorithm was implemented without using graphics processing unit (GPU) accelerated codes, which leaves the possibility of further reducing the computation time.
TME analysis of murine tumors using fine needle aspiration
With the iterative multiplexed imaging technique and an automated image analysis pipeline optimized, we tested the robustness of the FAST-FNA assay by analyzing the cellular composition of the TME of a preclinical tumor model, MC38, which is one of the most widely used murine models to study the TME(12). When tumors reached ~40 mm3 in size, an FNA was performed percutaneously followed by surgical tumor resection for comparative flow cytometry analysis (Fig. 3A). We used tumor cells stably expressing H2B-mApple, which allowed the identification of three major cell populations: H2B-mApple+ CD45− tumor cells, CD45+ immune cells, and H2B-mApple− CD45− non-immune non-tumor cells (including fibroblasts and endothelial cells).
Figure 3. Validation of FAST-FNA analysis on mouse tumor model.

A. An example of a typical FNA sample analysis. For validation of the FAST-FNA analysis, FNA samples were collected from mouse MC38 tumors implanted in B6 mice. A total of 16 markers were analyzed through 6 image cycles to identify monocytes (Mo), tumor-associated macrophages (TAM), dendritic cells (DC), neutrophils (N); natural killer cells (NK), B cells (B), CD4+ T cells (CD4), regulatory T cells (Treg); CD8+ T cells (CD8) and their subtypes, as defined by the expression levels of Granzyme B, IFN-ɣ, and PD-1. Cell counts of each immune cell type and its percentage of total cells are shown in the table and donut chart. B. Correlation of the immune cell frequency results obtained by FAST-FNA assay with the results by flow cytometry of the same MC38 tumor homogenate shows R2 = 0.97 and a slope of 1.03 with 95% confidence interval 0.97-1.10 in the shaded area of the plot (n=6). The color codes for each data point are indicated in panel A. Percentages of each cell type are outlined in Supplementary Figure 2. C. To test variations in different FNA biopsy passes, FNA samples were collected from a MC38 tumor consecutively and their immune composition was compared. Immune cell type analyses of 5 consecutive FNA samples show variations within the 95% confidence interval of the mean (Shaded areas). D. To test the technical variation in our assay, immune cell type analysis by FAST-FNA assay was repeated on the same cell stock of mouse spleen homogenate. Frequencies of various immune cell populations analyzed by 4 repeated trials also exhibits its variations within the 95% confidence interval of the mean (shaded areas).
In the representative example shown, 2891 cells were analyzed by FAST-FNA in one FNA sample, of which 1892 were CD45+ immune cells, 585 were mApple+ CD45− tumor cells and 414 were non-immune non-tumor cells. We further identified distinct cell types among the CD45+ cells, including both lymphoid and myeloid cell populations, since both can impact anti-tumor immune responses, either positively or negatively(13). Specifically, we assessed tumor-infiltrating CD8+ T cells, including those expressing effector (Granzyme B+ or IFN-ɣ+) or activation (PD-1+) markers, considering their central role in anti-tumor immunity and as targets of current immunotherapies. We further evaluated conventional CD4+ T cells and regulatory CD4+ T cells, considering their abilities to suppress and promote cancer outgrowth, respectively(14), as well as B cells, considering the increasing evidence that at least some of these cells may promote anti-tumor immunity(15, 16) and that they are associated with improved clinical outcome(17–19). In addition to these lymphocyte populations, we assessed various myeloid cells, including tumor-infiltrating monocytes, neutrophils and macrophages (tumor-associated macrophage, TAM), because they are abundant in some tumors including HNSCCs and a subpopulation may promote the growth of established tumors(20, 21). We also evaluated tumor-infiltrating dendritic cells considering increasing evidence showing the capacity of these myeloid cells to stimulate and license anti-tumor T cell responses locally(22, 23). These analyses were enabled by the fact that each cell was analyzed for 20-30 biomarkers.
A direct comparison of the FAST-FNA and standard flow cytometry assays from the same tumor samples revealed that FAST-FNA is equally efficient at detecting and enumerating the different target populations delineated above (R2=0.97, Fig. 3B, Supplementary Fig. S3). The difference between the two methods was that FAST-FNA could be performed from paucicellular material obtained from needle aspirates, whereas flow cytometry required surgically resected tissue which required processing for single cell analysis. We found that dendritic cells (DCs) and regulatory T cells (Tregs) were both relatively rare within MC38 tumors, as expected, whereas monocytes, macrophages and neutrophils were more abundant. These findings indicate that FNAs traversing distinct xyz coordinates within a given tumor were reflective of the entire TME composition in the MC38 model. It should be noted that the FNAs were not of sufficient cellularity for primary flow cytometry analyses, which require many more cells due to cell loss during the washes.
Next, we investigated the reproducibility of FNA measurements. First, we determined the variability between different needle passes. To this end, we collected five FNA samples from different needle passes in the same tumor. These independent samples showed insignificant variations within the 95% confidence interval of the mean (Fig. 3C). To evaluate for technical variation across repeated measurements by the FAST-FNA assay, we used a mouse spleen homogenate. Aliquots of this splenocyte batch were stained and analyzed on four different days and imaging sessions. Again, we found only small variations in abundance of the different cell types analyzed (Fig. 3D), further indicating high reproducibility of the staining and imaging pipeline.
Detection of serial TME changes after anti-PD-1 immunotherapy
Serial analysis of the TME may be particularly useful to determine whether immunotherapeutic regimens are effective in modulating the target immune cell populations and/or when and how resistance may emerge. To determine the feasibility of analyzing serial FNA specimens, we used syngeneic murine models of HNSCC, MOC2 and MOC22 (Fig. 4A). As reported previously, the MOC2 model is resistant to anti-PD-1 immunotherapy, while MOC22 is sensitive to anti-PD-1 with complete tumor regression(24). In addition to the MOC tumor models, we studied the MC38 model, which has a partial response rate (~50%) to anti-PD-1 treatment (Fig. 4B). Our rationale for utilizing a range of preclinical models (MOC2, MOC22 and MC38) with documented varying responses rates to anti-PD-1 therapy was to assess whether FAST-FNA can identify distinct phenotypes for responders and non-responders to anti-PD-1 immunotherapy.
Figure 4. Serial FNA analysis of mouse tumors MOC2, MOC22, and MC38 with anti-PD-1 treatment.
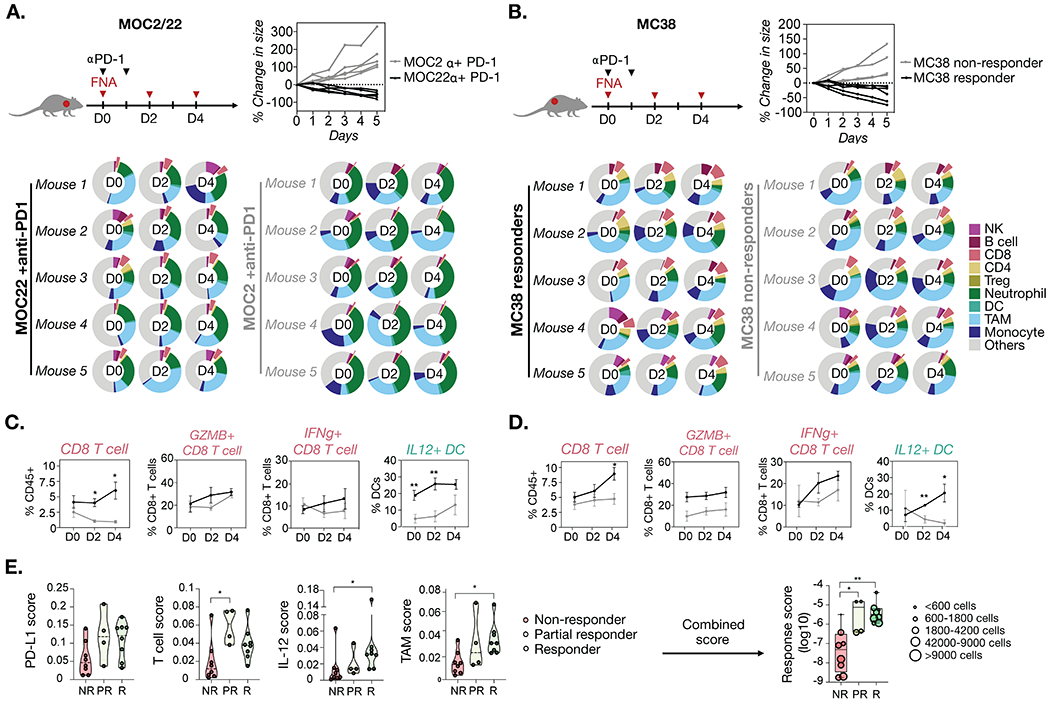
FNA samples of tumors were collected before (Day 0) and after (Day 2 and 4) anti-PD-1 treatment and analyzed by FAST-FNA. A. MOC22 tumors showed tumor regression in response to anti-PD-1 treatment, while MOC2 tumors continued to grow in size with treatment (n=5 each group). B. For MC38, mice showing a gradual decrease in tumor size tumors after anti-PD-1 treatment were grouped as responders (black lines, n=5), and mice with increasing tumor size were grouped as non-responders (grey lines, n=5). The immune composition of each FNA sample was analyzed by FAST-FNA assay. Cells were classified by combinations of immune markers as shown in Figure 3. Donut plots represent the percentage of each immune cell type in total DAPI+ cells. C-D. For both MOC and MC38 models, the responders (black lines) showed a higher frequency of CD8+ T cells and an overall tendency to higher Granzyme B and/or IFN-ɣ level in CD8+ T cells as compared to the non-responders (grey lines). Also, a higher level of IL-12 in DC was observed in responders as compared to non-responders. Data presented as mean ±SEM. Multiple t-test with Holm-Sidak correction was performed to calculate p-values (*p-value < 0.05, **p-value < 0.005). E. Immune scores established based on the current knowledge of immune cell effects on the tumor microenvironment were applied to the dataset of MOC and MC38 tumors (n=20 total). Each tumor sample was categorized into three groups based on the tumor size change after anti-PD-1 treatment: Responders (R, ≧10% tumor size reduction by day 4 after the treatment), partial responders (PR, <10% tumor size reduction by day 4 after the treatment), and non-responders (NR, no reduction in tumor size). Non-parametric Kruskal-Wallis test was performed for statistical tests (no assumption about underlying distribution) with multiple comparisons corrected by Dunn’s test. Details of the scoring metric are shown in Supplementary Figure S3.
In order to detect drug-induced changes in the TME, FNA samples were obtained at day 0 (baseline) and at days 2 and 4 after anti-PD-1 treatment. The donut charts in Figure 4A and B show analyses of key immune cell populations infiltrating MOC22, MOC2, and MC38 tumors at each time point. Between the MOC models, only the MOC22 tumors showed a significant increase in the CD8+ T cell fraction over time, whereas the non-responding MOC2 tumors showed very low CD8+ T cell fractions (Fig. 4C). Furthermore, the CD8+ T cells infiltrating MOC22 tumors showed progressive increases in granzyme B and IFN-ɣ levels, indicating functional activation. In addition, the IL-12 level in DC was significantly higher in MOC22 than in MOC2 tumors on days 0 and 2. This result is concordant with previous studies that reported IL-12-expressing intratumoral DC plays an important role in sensitizing tumors to anti-PD-1 treatment(22). We found that the comparison of responders and non-responders among MC38 tumors largely recapitulated the results found in the MOC models (Fig. 4D).
In addition to known prognostic biomarkers to anti-PD-1 treatment, we were interested in determining whether the assay could also be utilized to identify new potential predictive biomarkers. To determine the best metric to prospectively distinguish between responders, partial responders, and non-responders, we created different scores based on the current knowledge of immune cell effects on the TME (Supplementary Fig. S4). In addition to the PD-L1 score, which measured the fraction of PD-L1-expressing cells in the total number of cells analyzed, we formulated a T cell score, an IL-12 score, and a TAM score (Supplementary Fig. S4B). The T cell score and TAM score were generated based on established data for the anti- or pro-tumor nature of specific immune (sub)populations. T cell scores were defined as the ratio of anti-tumorigenic cell number (sum of CD4+, CD8+, Granzyme B+, and IFN-ɣ+ T cell fractions) to immunosuppressive/pro-tumorigenic cell number (fraction of Tregs). Likewise, the TAM score was defined as the ratio of MHCII-high to MHCII-low TAMs. MHCII-high TAMs have been correlated with sensitivity to checkpoint inhibition(25, 26), while MHCII-low TAMs were reported to mediate tumor progression(27). In the serial FNA analyses, the IL-12 levels in TAMs and DCs showed significant differences between responders and non-responders (Fig. 4C, Supplementary Fig. S4E). Based on this observation, we generated the IL-12 score to report on the IL-12 levels in TAMs and DCs. These scores were then applied to the existing MC38 and MOC mouse datasets (n = 20 treated mice). Cell populations from responders and partial responders were scored on days 0, 2 and 4. On days 2 and 4 the scores in responders was higher than those in non-responders, while the combined score was the most predictive of treatment success (Fig. 4E). As the scoring method continues to evolve with further studies, the data presented here support the feasibility to utilize multi-dimensional FAST-FNA datasets to rapidly interrogate the TME for early changes in immune cell populations induced by drug(s) and, thus, to provide early insight into treatment response.
FNA analysis of human HNSCC
Following the proof-of-principle preclinical studies, we translated our efforts to develop and validate antibody-FAST probes with human specificity (Supplementary Table S2, Supplementary Fig. S5). Our primary goal was to develop FAST-FNA for human serial assessment of the TME which would have a more acceptable risk-benefit profile than currently available tissue-based methods. In order to validate the FAST-FNA assay, we enrolled subjects who agreed to an FNA prior to surgical resection of their HNSCC (Fig. 5A). This allowed us to directly compare FAST-FNA results to tissue samples processed for flow cytometry (Supplementary Fig. S6). Figure 5B summarizes the results of FAST-FNA and flow cytometry of tissue for both non-immune (tumor, stroma) and immune cell types (NK, B, CD8, CD4, Treg, neutrophil, DC, TAMs, monocytes) across 9 HNSCC subjects. Despite the different analytical methods and cell numbers analyzed, the correlation coefficient was high at R2 = 0.86.
We then used the FAST-FNA results to determine the relative cellular composition (tumor, immune, and other cells) within the TME across all HNSCC subjects (Fig. 5C). Previous studies based on the RNA-seq data from the cancer genome atlas (TCGA) dataset have suggested greater infiltration by CD45+ tumor-infiltrating lymphocytes and higher proportion of CD4+ and CD8+ T cells in HPV+ HNSCC as compared to HPV− HNSCC samples(28, 29). Similarly, while patient samples showed an expected high degree of heterogeneity in immune infiltration, we noticed a significant difference between HPV+ and HPV− HNSCC: HPV+ HNSCC had a higher immune infiltration than HPV− HNSCC samples (78% vs 58% of the quantified cells, p = 0.04). Specifically, there were substantially more T cells (CD4+ and CD8+ combined) in HPV+ HNSCC than in HPV– HNSCC samples (49% vs 28% of the quantified cells, p = 0.02) (Fig. 5D).
Taken together, these findings are important because they show that multiplexed, single cell resolution information generated by FAST-FNA is capable of: i) identifying and quantitating subsets of various immune cell populations within the TME; ii) profiling the functional state of effector CD8+ T cells based on the expression level of key markers such as IFN-ɣ, Granzyme B, PD-1, TCF1 (Supplementary Fig. S7); and iii) providing a platform for the development and discovery of quantitative multi-dimensional scores and/or biomarkers that may allow for better prediction of treatment response (Supplementary Fig. S4).
PD-L1 and TME landscape profiling of HNSCC
To further assess the clinical feasibility and relevance of the FAST-FNA technology, we evaluated whether PD-L1 expression within the TME could be determined through FNAs and compared the results to the clinical standard of tissue staining with IHC. Thus, we determined: i) the percentage of PD-L1-expressing cells in total DAPI+ cells analyzed by FAST-FNA analysis, and ii) the combined positive score (CPS) obtained by IHC on tumor tissue sections obtained from HNSCC patients (Supplementary Fig. S8). Figure 5E shows the positive and linear correlation between the two metrics (R2=0.80). The data further indicate that the percentage of PD-L1+ cells varied widely among the patients, ranging from 2% to 47% of total cells analyzed by FAST-FNA.
Unlike the FDA-approved single PD-L1 IHC companion diagnostic test, the FAST-FNA assay was also able to quantitatively attribute PD-L1 expression to the tumor and/or immune cells. Interestingly, we found that many cell types contributed to overall PD-L1 expression within the TME (Fig. 5F and G, Supplementary Fig. S9). PD-L1+ cells included tumor cells, monocytes and macrophages as expected(30), but also neutrophils, various lymphocyte populations, and stromal cells expressed PD-L1. Second, the relative contribution of cell types that were PD-L1+ varied across patients. In fact, although many of the tumors analyzed demonstrated a high level of PD-L1 expression in macrophages, we noticed distinct differences across samples. For example, tumor cells represented the majority of PD-L1+ cells in Subject 14, but only a small fraction in Subjects 2, 9, and 12. In Subject 6, macrophages, CD4+ T cells and non-immune stromal cells combined to contribute ~90% of PD-L1+ cells. Defining whether these features have functional and/or clinical relevance will require further study.
Serial time course analysis of the TME in HNSCC during immunotherapy
Lastly, we explored the risk-benefit ratio of performing serial FNAs to monitor the evolving TME during immunotherapy treatment. To assess the feasibility of this approach, we obtained serial FNA samples from a HNSCC patient receiving immunotherapy. FAST-FNA samples were collected on weeks −2 and 0 for baseline measurement, and weeks 2, 5 and 7 during immunotherapy. Our results indicate that it is safe and well tolerated to obtain serial FNA sampling of the TME during the course of treatment. Also, in this case study, we were able to detect profound changes in the TME during immunotherapy. The most notable changes were the progressive decrease in the macrophage fraction on weeks 2, 5 and 7, and the increase in NK cell, CD8+ T cell, and DC fractions on week 7 (Fig. 6A). Further characterization of the macrophages revealed an increased fraction of cells producing IL-12 over time, which has been reported to exert anti-tumor effects(31), and a decreased fraction of cells expressing CD163, which has been associated with vascular and lymphatic invasion in HNSCC (Fig. 6B)(31, 32). These changes not only suggested the unfolding of an anti-tumor immune response(33), but also the insight gained from serial monitoring of the TME (in this case for 7 weeks) to observe the continually evolving immune cell activities with treatment.
Figure 6. Serial FAST-FNA analysis of HNSCC in a patient during immunotherapy.

A. Time course analysis of the immune composition was performed by FAST-FNA assay. A baseline FNA collection was obtained 2 weeks prior to the start of immunotherapy, and subsequent FNA samples were collected every 2 or 3 weeks. Fractions of natural killer cells (NK), B cells, CD8+ T cells (CD8), CD4+ T cells (CD4), regulatory T cells (Treg), dendritic cells (DC), tumor-associated macrophages (TAM), and monocytes (Mono) were analyzed. B. Percentages of CD8+ T cell subsets expressing markers for cytotoxic effector/activation status (IFN-ɣ, Granzyme B, CD39, PD-1, TCF1) increased after immunotherapy (dotted line), while the PD-1+ CD8+ T cell fraction decreased in response to anti-PD-1 treatment. C. Expression levels of IL-12 and CD163 in TAM were analyzed. Data are presented as the percentages of IL-12+ and CD163+ cells in TAMs, with bar graph showing the mean fluorescence intensity (MFI) of IL-12 in TAMs. Thresholds for the positive populations were determined based on fluorescence intensity of isotype controls. D. Temporal changes in the expression level of IL-12 in DCs are presented as the percentage of IL-12+ cells and the MFI in DC. For both TAM and DC, the mean fluorescence intensity (MFI) of IL-12 was normalized against the MFI of isotype controls.
To further characterize the functional states of the CD8+ T cells, we assessed the expression level of Granzyme B, IFN-ɣ, CD39, and TCF1 (Fig. 6C). Specifically, the CD8+ T cells were classified as: Granzyme B+ and IFN-ɣ+ (cytotoxic), CD39+ (tumor-specific), and TCF1+ Granzyme B− IFN-ɣ− (stem-like)(34–36). Interestingly, FAST-FNA analyses revealed increased frequencies of Granzyme B+, IFN-ɣ+, CD39+, and TCF1+ Granzyme B− IFN-ɣ− CD8+ T cell subsets over time.
In addition, FAST-FNA showed that B cells(15, 16), decreased in the course of immunotherapy (Fig. 6A) while the expression level of the anti-tumor cytokine IL-12 showed a sporadic increase in DCs at week 2 and 7 (Fig. 6D). Collectively, these data show that serial FAST-FNA can provide a sensitive means to interrogate key immune components of the TME and determine whether the end target cell population(s) and/or TME are being modulated or not by the applied immunotherapeutic(s).
Discussion
In this study, we demonstrate that single immune cells can be harvested and characterized via fine needle aspirates and that the phenotypic and functional landscapes of the immune cells obtained are representative of the TME. This is the first demonstration that the TME can be accurately and reproducibly measured by simple fine needle aspiration. Analyses performed in FNA samples demonstrated that a FAST-FNA PDL1 score is clinically meaningful and correlates with CPS obtained from PD-L1 staining of whole tumor tissue sections. We further show that a number of individual scores (Supplementary Fig. S4) and a single composite score are highly correlated with anti-PD-1 treatment outcome in mouse models. The use of FNA instead of a core biopsy or incisional/excisional biopsy is particularly attractive for patients with an inaccessible tumor for biopsy, co-existing comorbidities that increase the risk for obtaining a biopsy, or whose prior tumor tissue is unavailable for biomarker assessment. In this study we utilized HNSCC samples as a proof-of-principle based on the relative accessibility of these tumors for FNA. This method could be applied to other clinical situations where rapid answers are desirable and/or when serial tissue sampling can inform drug efficacy and/or clinical decision making.
We validated the analytic performance of the FAST-FNA assay based on accuracy, precision and the limit of detection. We also performed an agreement analysis between the FAST and flow cytometry and IHC of surgically resected tissue samples. Collectively, these analyses showed that FAST-FNA and flow cytometry are positively correlated with a R2=0.97 in mouse samples and an R2=0.86 in human samples. It should be highlighted that the minimum number of cells required to perform these two assays differ by orders of magnitude. For flow cytometry assays, tumor tissue needs to be dissociated into single cell suspensions so that a minimum of 105–106 cells can be analyzed. In contrast, FNAs were directly obtained from patients and samples typically contained cells in the order of 103. We found the small discrepancy in abundant cells (such as T cells and macrophages) and somewhat higher discrepancies in less abundant cells. Our analysis of technical and biological parameters in mouse samples suggested that the main source of variances originated from the samples themselves, rather than from analytical or computational factors. For example, we show that the same FAST-FNA samples analyzed manually versus via deep learning-assisted pipeline gave highly concordant results. We also show that repeat FNAs of a mouse tumor were highly concordant despite the sampling through different needle tracts. We attribute this to the fact that each needle pass of an FNA can sample throughout the entire z-trajectory of a tumor and is thus representative of the given cancer.
The identification of a biomarker that enriches for patients who may derive clinical benefit from a particular therapy has become an increasingly important component of drug development and the FDA approval process in order to improve cancer care delivery while simultaneously containing health care costs. For head and neck cancers, a CPS equal to or greater than 1 is required to administer anti-PD-1 monotherapy since this cut-off has been found to be a prognostic biomarker of response to anti-PD-1 therapy(4). However, there are practical challenges to PD-L1 testing. First, the acquisition of a fresh tumor biopsy to be tested for PD-L1 expression via IHC may delay the start of therapy by several weeks, which can potentially compromise patient outcomes. Second, only 10-20% of HNSCC patients respond to anti-PD-1 therapy despite the fact that 85% of patients express PD-L1(3, 4). Third, serial analyses are usually not performed given the morbidity and cost of the procedure and this can lead to delays in changing treatments which may be ineffective for a particular patient based on their tumor and/or immune cell profile. Fourth, recent studies in other cancers have shown limited utility of PD-L1 profiling as currently accepted by the FDA(5–8). For these reasons, there is a strong need to develop innovative technologies which can support the rapidly evolving paradigms of cancer treatment. The technology needs to incorporate the ability to assess biomarkers in a timely manner, the ability to profile single cell materials with multi-dimensional approaches, and the ability to provide a platform which allows for the discovery and application of predictive and/or prognostic biomarkers of response as novel and combinatorial therapeutic agents continue to be developed. Herein, we present the FAST-FNA assay and demonstrate its clinical feasibility and relevance as an innovative technology and first steps toward meeting the needs of the current era of cancer care delivery.
Some current limitations of the FAST-FNA assay is that in its current design it still requires some manual steps of staining, cycling and image acquisition. However, it is possible to automate these steps further using microfluidics incorporated into slides(37, 38). Microfluidic and cartridge- based slide set-ups might be useful in enabling such repeat cycling while minimizing reagent loss. Although we employed AI-based image analysis, the sheer number of channels and single cell analyses is computationally intensive. Speed could be further improved by optimizing the code or cloud computing. Accuracy could also be further enhanced by obtaining larger and more diverse training datasets, which is an objective of future studies. Additional deep learning approaches may also become useful in the analysis of cell clusters rather than single cells. Finally, the FAST-FNA technology was developed to have an adaptable and modular platform which would facilitate the continued expansion of the incorporated biomarkers, e.g. those that inform the tumor stroma including vascularization. It is also possible to harness the growing insight gained from scRNA-seq to identify prognostically significant immune cell subtypes as the field continues to grow in identifying biomarkers of response to therapy. Future versions of the FAST-FNA assay will incorporate the above computational approaches and expand the biomarker repertoire. It is recognized that the spatial architecture of tissue samples can strongly influence disease pathology, progression, and treatment response. A number of studies have outlined the importance of studying the spatial context of tumor samples to predict treatment response (39, 40). Therefore, while the current study was focused on cellular FNA analyses, the same FAST staining technique can be used with FFPE sections allowing ~50-plex analyses of tissues. Current efforts are ongoing to translate this technology to whole tissue sections to complement the FNA results with spatial context.
In summary, our data show that measuring FAST-FNA is clinically feasible, safe, and well-tolerated. Our mouse studies introduced a possibility of using combination scores for the identification of subjects who would benefit from anti-PD-1 therapy. Additional work is needed to automate the entire assay, validate additional biomarkers and understand the dynamics and biology of the TME in serially sampled cancer patients. Our data suggest that the FAST-FNA assay is a novel and powerful tool which can be utilized to obtain timely diagnostic and therapeutic insight into the early changes induced within the TME with various applied treatments. Prospective validation of the FAST-FNA assay in randomized large-scale trials is ongoing.
Supplementary Material
Translational Relevance.
In this study, we develop a multiplexed fine needle technology to aspirate cells directly from solid tumors without the need for more invasive core or surgical based biopsies. The FAST-FNA method facilitates the comprehensive and quantitative assessment of cellular and functional immune biomarkers within the TME at the single cell level and in situations when the samples are too scant to perform flow cytometry. Serial immune profiling of the TME by FAST-FNA is an advancement in the field in both concept and methodology that allows for the early detection of changes induced within the TME by various applied therapeutics, providing a platform for the development and discovery of quantitative multi-dimensional scores and/or biomarkers that may allow for the improved and timely prediction of treatment response.
Acknowledgments
We are grateful to Dr. Hannes Mikula (TU Wien, Austria) for synthesis of TCO building blocks and Mark Smyth (QIMR Berghofer Medical Research Institute, Australia) for providing the MC38 cell line. We thank Dr. Peter Sadow for assistance with IHC imaging. We are grateful to the patients who participated in this study, especially the patient who agreed to the serial FNA collections. We also thank the clinical staff members, Esdras Lopez and Talia Saal, for arranging the sample collection. We acknowledge the following funding sources for certain aspects of the work: CSB development fund, MGH Scholar Fund, UH3CA202637, T32CA079443, R01CA206890, P01CA069246, U01CA206997, P01CA240239, R01CA229777, U01CA233360, DOD-W81XWH1910199, DOD-W81XWH1910194; J.Oh was supported in part by a Tosteson MGH Research Institute Fellow award.
Conflict of interest statement
The authors declare the filing of a patent which was assigned to Massachusetts General Hospital. The following disclosures are not related to the subject matter of this work. S.P. has received consultancy payments from Abbvie, Astrazeneca/MedImmune, Cue Biopharma, Fusion Pharmaceuticals, MSD/Merck, Newlink Genetics, Oncolys Biopharma, Replimmune, Scopus Biopharma, and Sensei Biopharma. She has received grants/research support from Abbvie, Astrazeneca/MedImmune, Cue Biopharma, Merck, and Tesaro. M.J.P. has received consultancy payments from Aileron Therapeutics, AstraZeneca, Elstar Therapeutics, KSQ Therapeutics, MPM Capital, Siamab Therapeutics, Third Rock Ventures and Tidal Therapeutics. R.W. is a consultant to ModeRNA, Tarveda Pharmaceuticals, Lumicell, Seer, Earli, Alivio Therapeutics, Aikili Biosystems and Accure Health. H.L. is a consultant to Exosome Diagnostics, Accure Health, and Aikili Biosystems. WCF, JO, JCTC, CL, SF report no industrial interactions.
References
- 1.Topalian SL, Hodi FS, Brahmer JR, Gettinger SN, Smith DC, McDermott DF et al. Safety, activity, and immune correlates of anti-PD-1 antibody in cancer. N Engl J Med 2012;366:2443–54. [DOI] [PMC free article] [PubMed] [Google Scholar]
- 2.Lantuejoul S, Sound-Tsao M, Cooper WA, Girard N, Hirsch FR, Roden AC et al. PD-L1 Testing for Lung Cancer in 2019: Perspective From the IASLC Pathology Committee. J Thorac Oncol 2020;15:499–519. [DOI] [PubMed] [Google Scholar]
- 3.Cramer JD, Burtness B, Ferris RL. Immunotherapy for head and neck cancer: Recent advances and future directions. Oral Oncol 2019;99:104460. [DOI] [PMC free article] [PubMed] [Google Scholar]
- 4.Burtness B, Harrington KJ, Greil R, Soulières D, Tahara M, de Castro G et al. Pembrolizumab alone or with chemotherapy versus cetuximab with chemotherapy for recurrent or metastatic squamous cell carcinoma of the head and neck (KEYNOTE-048): a randomised, open-label, phase 3 study. Lancet 2019;394:1915–28. [DOI] [PubMed] [Google Scholar]
- 5.Hellmann MD, Paz-Ares L, Bernabe Caro R, Zurawski B, Kim SW, Carcereny Costa E et al. Nivolumab plus Ipilimumab in Advanced Non-Small-Cell Lung Cancer. N Engl J Med 2019;381:2020–31. [DOI] [PubMed] [Google Scholar]
- 6.Larkin J, Chiarion-Sileni V, Gonzalez R, Grob JJ, Rutkowski P, Lao CD et al. Five-Year Survival with Combined Nivolumab and Ipilimumab in Advanced Melanoma. N Engl J Med 2019;381:1535–46. [DOI] [PubMed] [Google Scholar]
- 7.Motzer RJ, Tannir NM, McDermott DF, Arén Frontera O, Melichar B, Choueiri TK et al. Nivolumab plus Ipilimumab versus Sunitinib in Advanced Renal-Cell Carcinoma. N Engl J Med 2018;378:1277–90. [DOI] [PMC free article] [PubMed] [Google Scholar]
- 8.Ho AY, Barker CA, Arnold BB, Powell SN, Hu ZI, Gucalp A et al. A phase 2 clinical trial assessing the efficacy and safety of pembrolizumab and radiotherapy in patients with metastatic triple-negative breast cancer. Cancer 2019 [DOI] [PubMed] [Google Scholar]
- 9.Hegde PS, Chen DS. Top 10 Challenges in Cancer Immunotherapy. Immunity 2020;52:17–35. [DOI] [PubMed] [Google Scholar]
- 10.Frenk NE, Spring L, Muzikansky A, Vadvala HV, Gurski JM Jr, Henderson LE et al. High-content biopsies facilitate molecular analyses and do not increase complication rates in patients with advanced solid tumors. JCO Precision Oncology 2017;1:1–9. [DOI] [PubMed] [Google Scholar]
- 11.Ko J, Oh J, Ahmed MS, Carlson JCT, Weissleder R. Ultra-fast cycling for multiplexed cellular fluorescence imaging. Angew Chem Int Ed Engl 2020 [DOI] [PMC free article] [PubMed] [Google Scholar]
- 12.Mosely SI, Prime JE, Sainson RC, Koopmann JO, Wang DY, Greenawalt DM et al. Rational Selection of Syngeneic Preclinical Tumor Models for Immunotherapeutic Drug Discovery. Cancer Immunol Res 2017;5:29–41. [DOI] [PubMed] [Google Scholar]
- 13.Zhang Y, Zhang Z. The history and advances in cancer immunotherapy: understanding the characteristics of tumor-infiltrating immune cells and their therapeutic implications. Cell Mol Immunol 2020;17:807–21. [DOI] [PMC free article] [PubMed] [Google Scholar]
- 14.Ostroumov D, Fekete-Drimusz N, Saborowski M, Kühnel F, Woller N. CD4 and CD8 T lymphocyte interplay in controlling tumor growth. Cell Mol Life Sci 2018;75:689–713. [DOI] [PMC free article] [PubMed] [Google Scholar]
- 15.Lund FE, Randall TD. Effector and regulatory B cells: modulators of CD4+ T cell immunity. Nat Rev Immunol 2010;10:236–47. [DOI] [PMC free article] [PubMed] [Google Scholar]
- 16.Boldison J, Da Rosa LC, Davies J, Wen L, Wong FS. Dendritic cells license regulatory B cells to produce IL-10 and mediate suppression of antigen-specific CD8 T cells. Cell Mol Immunol 2020;17:843–55. [DOI] [PMC free article] [PubMed] [Google Scholar]
- 17.Helmink BA, Reddy SM, Gao J, Zhang S, Basar R, Thakur R et al. B cells and tertiary lymphoid structures promote immunotherapy response. Nature 2020;577:549–55. [DOI] [PMC free article] [PubMed] [Google Scholar]
- 18.Cabrita R, Lauss M, Sanna A, Donia M, Skaarup Larsen M, Mitra S et al. Tertiary lymphoid structures improve immunotherapy and survival in melanoma. Nature 2020;577:561–5. [DOI] [PubMed] [Google Scholar]
- 19.Petitprez F, de Reyniès A, Keung EZ, Chen TW, Sun CM, Calderaro J et al. B cells are associated with survival and immunotherapy response in sarcoma. Nature 2020;577:556–60. [DOI] [PubMed] [Google Scholar]
- 20.Engblom C, Pfirschke C, Pittet MJ. The role of myeloid cells in cancer therapies. Nat Rev Cancer 2016;16:447–62. [DOI] [PubMed] [Google Scholar]
- 21.Weissleder R, Pittet MJ. The expanding landscape of inflammatory cells affecting cancer therapy. Nat Biomed Eng 2020 [DOI] [PMC free article] [PubMed] [Google Scholar]
- 22.Garris CS, Arlauckas SP, Kohler RH, Trefny MP, Garren S, Piot C et al. Successful Anti-PD-1 Cancer Immunotherapy Requires T Cell-Dendritic Cell Crosstalk Involving the Cytokines IFN-γ and IL-12. Immunity 2018;49:1148–1161.e7. [DOI] [PMC free article] [PubMed] [Google Scholar]
- 23.Binnewies M, Mujal AM, Pollack JL, Combes AJ, Hardison EA, Barry KC et al. Unleashing Type-2 Dendritic Cells to Drive Protective Antitumor CD4+ T Cell Immunity. Cell 2019;177:556–571.e16. [DOI] [PMC free article] [PubMed] [Google Scholar]
- 24.Zolkind P, Przybylski D, Marjanovic N, Nguyen L, Lin T, Johanns T et al. Cancer immunogenomic approach to neoantigen discovery in a checkpoint blockade responsive murine model of oral cavity squamous cell carcinoma. Oncotarget 2018;9:4109–19. [DOI] [PMC free article] [PubMed] [Google Scholar]
- 25.Muraoka D, Seo N, Hayashi T, Tahara Y, Fujii K, Tawara I et al. Antigen delivery targeted to tumor-associated macrophages overcomes tumor immune resistance. J Clin Invest 2019;129:1278–94. [DOI] [PMC free article] [PubMed] [Google Scholar]
- 26.Axelrod ML, Cook RS, Johnson DB, Balko JM. Biological Consequences of MHC-II Expression by Tumor Cells in Cancer. Clin Cancer Res 2019;25:2392–402. [DOI] [PMC free article] [PubMed] [Google Scholar]
- 27.Wang B, Li Q, Qin L, Zhao S, Wang J, Chen X. Transition of tumor-associated macrophages from MHC class II(hi) to MHC class II(low) mediates tumor progression in mice. BMC Immunol 2011;12:43. [DOI] [PMC free article] [PubMed] [Google Scholar]
- 28.Chen X, Yan B, Lou H, Shen Z, Tong F, Zhai A et al. Immunological network analysis in HPV associated head and neck squamous cancer and implications for disease prognosis. Mol Immunol 2018;96:28–36. [DOI] [PubMed] [Google Scholar]
- 29.Gameiro SF, Ghasemi F, Barrett JW, Koropatnick J, Nichols AC, Mymryk JS et al. Treatment-naïve HPV+ head and neck cancers display a T-cell-inflamed phenotype distinct from their HPV- counterparts that has implications for immunotherapy. Oncoimmunology 2018;7:e1498439. [DOI] [PMC free article] [PubMed] [Google Scholar]
- 30.Lyford-Pike S, Peng S, Young GD, Taube JM, Westra WH, Akpeng B et al. Evidence for a role of the PD-1:PD-L1 pathway in immune resistance of HPV-associated head and neck squamous cell carcinoma. Cancer Res 2013;73:1733–41. [DOI] [PMC free article] [PubMed] [Google Scholar]
- 31.Kumar AT, Knops A, Swendseid B, Martinez-Outschoom U, Harshyne L, Philp N et al. Prognostic Significance of Tumor-Associated Macrophage Content in Head and Neck Squamous Cell Carcinoma: A Meta-Analysis. Front Oncol 2019;9:656. [DOI] [PMC free article] [PubMed] [Google Scholar]
- 32.He KF, Zhang L, Huang CF, Ma SR, Wang YF, Wang WM et al. CD163+ tumor-associated macrophages correlated with poor prognosis and cancer stem cells in oral squamous cell carcinoma. Biomed Res Int 2014;2014:838632. [DOI] [PMC free article] [PubMed] [Google Scholar]
- 33.Peltanova B, Raudenska M, Masarik M. Effect of tumor microenvironment on pathogenesis of the head and neck squamous cell carcinoma: a systematic review. Mol Cancer 2019;18:63. [DOI] [PMC free article] [PubMed] [Google Scholar]
- 34.Sade-Feldman M, Yizhak K, Bjorgaard SL, Ray JP, de Boer CG, Jenkins RW et al. Defining T Cell States Associated with Response to Checkpoint Immunotherapy in Melanoma. Cell 2019;176:404. [DOI] [PMC free article] [PubMed] [Google Scholar]
- 35.Miller BC, Sen DR, Al Abosy R, Bi K, Virkud YV, LaFleur MW et al. Subsets of exhausted CD8+ T cells differentially mediate tumor control and respond to checkpoint blockade. Nat Immunol 2019;20:326–36. [DOI] [PMC free article] [PubMed] [Google Scholar]
- 36.Kurtulus S, Madi A, Escobar G, Klapholz M, Nyman J, Christian E et al. Checkpoint Blockade Immunotherapy Induces Dynamic Changes in PD-1-CD8+ Tumor-Infiltrating T Cells. Immunity 2019;50:181–194.e6. [DOI] [PMC free article] [PubMed] [Google Scholar]
- 37.Leblond AL, Rechsteiner M, Jones A, Brajkovic S, Dupouy D, Soltermann A. Microfluidic-Based Immunohistochemistry Combined With Next-Generation Sequencing on Diagnostic Tissue Sections for Detection of Tumoral BRAF V600E Mutation. Am J Clin Pathol 2019;152:59–73. [DOI] [PubMed] [Google Scholar]
- 38.Li H, Brewer G, Ongo G, Normandeau F, Omeroglu A, Juncker D. Immunohistochemistry Microarrays. Anal Chem 2017;89:8620–5. [DOI] [PubMed] [Google Scholar]
- 39.Jackson HW, Fischer JR, Zanotelli VRT, Ali HR, Mechera R, Soysal SD et al. The single-cell pathology landscape of breast cancer. Nature 2020;578:615–20. [DOI] [PubMed] [Google Scholar]
- 40.Ji AL, Rubin AJ, Thrane K, Jiang S, Reynolds DL, Meyers RM et al. Multimodal Analysis of Composition and Spatial Architecture in Human Squamous Cell Carcinoma. Cell 2020;182:1661–2. [DOI] [PMC free article] [PubMed] [Google Scholar]
- 41.Udall M, Rizzo M, Kenny J, Doherty J, Dahm S, Robbins P et al. PD-L1 diagnostic tests: a systematic literature review of scoring algorithms and test-validation metrics. Diagn Pathol 2018;13:12. [DOI] [PMC free article] [PubMed] [Google Scholar]
- 42.Kulangara K, Zhang N, Corigliano E, Guerrero L, Waldroup S, Jaiswal D et al. Clinical Utility of the Combined Positive Score for Programmed Death Ligand-1 Expression and the Approval of Pembrolizumab for Treatment of Gastric Cancer. Arch Pathol Lab Med 2019;143:330–7. [DOI] [PubMed] [Google Scholar]
Associated Data
This section collects any data citations, data availability statements, or supplementary materials included in this article.