

Abstract
Micropeptides (microproteins) encoded by transcripts previously annotated as long noncoding RNAs (lncRNAs) are emerging as important mediators of fundamental biological processes in health and disease. Here, we applied two computational tools to identify putative micropeptides encoded by lncRNAs that are expressed in the human pancreas. We experimentally verified one such micropeptide encoded by a β cell- and neural cell-enriched lncRNA TCL1 Upstream Neural Differentiation-Associated RNA (TUNAR, also known as TUNA, HI-LNC78, or LINC00617). We named this highly conserved 48-amino-acid micropeptide beta cell- and neural cell-regulin (BNLN). BNLN contains a single-pass transmembrane domain and localizes at the endoplasmic reticulum (ER) in pancreatic β cells. Overexpression of BNLN lowered ER calcium levels, maintained ER homeostasis, and elevated glucose-stimulated insulin secretion in pancreatic β cells. We further assessed the BNLN expression in islets from mice fed a high-fat diet and a regular diet and found that BNLN is suppressed by diet-induced obesity (DIO). Conversely, overexpression of BNLN enhanced insulin secretion in islets from lean and obese mice as well as from humans. Taken together, our study provides the first evidence that lncRNA-encoded micropeptides play a critical role in pancreatic β cell functions and provides a foundation for future comprehensive analyses of micropeptide function and pathophysiological impact on diabetes.
Keywords: computational biology, diabetes, islets, lncRNA, endoplasmic reticulum, micropeptides, sORF
Graphical abstract
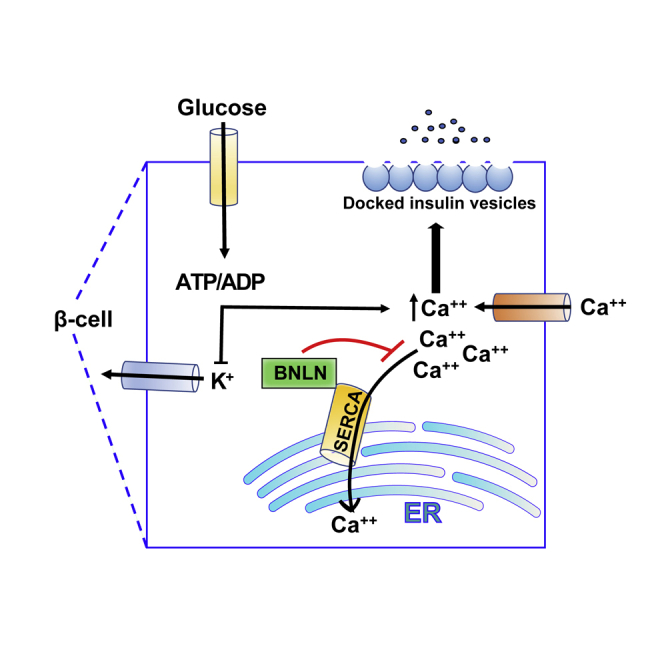
In this study, we identified one islet lncRNA, TUNAR, contains a sORF encoding for micropeptide BNLN. We further demonstrated that BNLN regulates insulin secretion in the pancreatic β cells in health and diseases. Our study provides important insights into the molecular mechanisms that underlie the fine-tuning of glucose-induced insulin secretion by translational function of lncRNA.
Introduction
Large-scale projects such as ENCODE and FANTOM have found thousands of long noncoding RNAs (lncRNAs) in the human genome.1, 2, 3, 4 lncRNAs play an essential role in regulating islet function in health and diseases, including diabetes.5 It has been demonstrated that lncRNAs are key components of the islet regulatome, with more than 1,000 lncRNAs identified in human islets and mouse β cells.6,7 These lncRNAs play critical roles in islet and β cell survival, cell development, and physiological functions through regulation of the islet transcriptome.5, 6, 7 Of note, a genome-wide association study that examined type 2 diabetes (T2D) susceptibility loci demonstrated that dysregulation of lncRNAs is involved in pancreatic pathologies in humans.5 In addition, dysregulation of lncRNAs has been implicated in diabetes complications, such as diabetic nephropathy and retinopathy.6,8 Recently, several circulating lncRNAs have been identified as biomarkers of diabetes and diabetic complications.9,10 Although much knowledge has accumulated correlating dysregulation of lncRNA with islet pathology, the functional roles and molecular mechanisms of these lncRNAs remain poorly understood.
By definition, lncRNAs do not contain protein-coding open reading frames (ORFs), which comprise a start codon, in-frame codons, and a stop codon. To accurately identify bona fide protein-coding ORFs, most ORF-finding computational algorithms have historically used a cutoff of 100 amino acids as the minimum size for detection. This filtering strategy dramatically reduces the likelihood of false-positive detection but may also result in some genes that contain small open reading frames (sORFs) being mis-annotated as lncRNAs.11 Indeed, recent studies have revealed that some lncRNAs do contain sORFs that encode micropeptides (or microprotein, a protein that is less than 100 amino acids in length).12, 13, 14, 15, 16, 17, 18, 19, 20 There is emerging evidence that micropeptides are important regulators of fundamental biological processes such as embryonic development19 and metabolism.16,21 However, whether and how micropeptides modulate islet biology is largely unknown.
In this study, we employed two computational algorithms, PhyloCSF and RNAcode, to comprehensively survey the protein-coding potential of lncRNAs expressed in the human pancreatic islet.22,23 Among the novel micropeptides encoding lncRNA transcripts we identified, we characterized one putative micropeptide encoded by TUNAR (also known as TUNA, HI-LNC78, or LINC00617), which is highly expressed in human β cells and neural cells. We named this highly conserved micropeptide beta cell and neural cell-regulin (BNLN). Pancreatic β cells synthesize and secrete insulin to govern systemic glucose homeostasis.24 We found that BNLN localizes at the ER in pancreatic β cells. Robust and highly functional ER fluctuations/adaptations are required for β cells to synthesize insulin to maintain systemic glucose metabolic homeostasis.25 The ER also plays an important role in coordinating intracellular Ca2+ signaling, which regulates insulin secretion.26,27 In both rodent models and humans, obesity and diabetes are characterized by ER dysfunction, which leads to β cell death and impaired islet function.28,29 We further showed that TUNAR is downregulated in islets from obese mice, and gain of function of BNLN increases glucose-induced insulin secretion in islets from obese mice, as well as from human donors. These findings provide a first evidence of the biological function of pancreatic micropeptides in health and disease.
Results
An lncRNA, TUNAR, encodes a conserved 48-amino-acid micropeptide in the human pancreas
Recent studies have discovered that a few lncRNAs harbor sORFs that encode sORF-encoded peptides (SEPs) or micropeptides.12, 13, 14, 15, 16, 17, 18, 19, 20 We hypothesized that there are additional transcripts currently annotated as lncRNAs that may encode micropeptides. To prioritize the search for potential micropeptide genes, we used two computational tools, PhyloCSF and RNAcode, to comprehensively evaluate the coding potential of lncRNAs that are expressed in human pancreatic islets.22,23 We found several lncRNAs that are highly expressed in human pancreatic islets and contained putative sORFs (Figure 1A). TCL1 Upstream Neural Differentiation-Associated RNA, TUNAR (also known as TUNA, HI-LNC78, or LINC00617) ranked at the top in both the expression level in human islets and the coding potential (Figure 1A). Of note, TUNAR’s PhyloCSF and RNAcode scores were higher than many recently identified micropeptides (Figure 1B). In addition to the pancreas, TUNAR is highly expressed in the brain, pituitary gland, testis, fallopian tubes, and the uterus (Figure S1). Knockdown of TUNAR has been associated with reduced insulin content and impaired glucose-stimulated insulin secretion (GSIS) in a human β cell line, as well as impaired neural differentiation of mouse embryonic stem cells (mESCs).6,30 Genomic annotation indicated that TUNAR spans ∼49.2 kb and has 3 transcript isoforms: RefSeq: NR_132399.1, NR_132398.1, and NR_038861.1 (Figure 1C). Further analysis of RNA-sequencing (RNA-seq) read splice junctions visualized with sashimi plot revealed that NR_038861.1 is the major isoform in the pancreas (data not shown). Our computational pipeline predicted an sORF at the beginning of the last exon (which is shared among all three transcript isoforms) that is highly conserved among 100 vertebrate genomes assessed by the UCSC genome browser PhyloP track (Figure 1C). Moreover, ribosomal profiling (Ribo-seq) datasets suggest that this region is actively translated (Figure S2A). We then extracted other species’ DNA sequences (multiz100way) corresponding to the predicted sORF and translated them to protein sequences. The predicted micropeptide sequence was highly conserved (Figure 1D; Figure S3; Table S1) and was found in 88 species out of the 100 vertebrate species (conserved down to fish).
Figure 1.

Identification of lncRNAs that have coding potential in the human pancreas
(A) Scott plot of lncRNA expression level in human islets and coding potential. Expression level was measured by log2(TPM + 1). Coding potential was measured by log2(PhyloCSF score + 1). (B) PhyloCSF score and RNAcode score for 12 lncRNAs that have recently been found to encode micropeptides. TUNAR is the micropeptide encoding lncRNA identified in this study. (C) Genomic architecture of the TUNAR locus. 100 vertebrates sequence conservation shows a conserved region at the beginning of last exon. (D) Multi-species alignment of predicted TUNAR encoding micropeptide BNLN. A conserved transmembrane domain is located at the C terminus. Position of three potential ATG start codons and one non-canonical CTG start codon are marked with black arrows.
To experimentally validate the translation potential of the predicted sORF within TUNAR, we inserted three reporter (GFP, hRluc, and FLAG) coding sequences (CDS) without ATG start codon either in-frame or out-of-frame before the stop codon of the full-length TUNAR transcript (RefSeq: NR_038861.1; Figure 2A). As expected, GFP and Renilla luciferase were translated when inserted in-frame (Figures 2B and 2C). However, no translation was observed when GFP or hRluc were inserted out-of-frame by deletion of one or two bases between the predicted sORF and GFP/hRluc (Figures 2B and 2C). Consistent with these results, western blot analysis showed a band of ∼10 kilodaltons (kDa) only when FLAG was inserted in-frame (Figure 2D). To test the endogenous translational potential, we knocked in (in-frame or out-of-frame) FLAG tag before the predicted stop codon of Tunar in mESCs. We observed translation of FLAG tag only in the in-frame knockin cell (Figure S2C). There are 3 potential ATG initiating codons in-frame with the predicted reading frame in TUNAR (Figure 1D). Multispecies alignment showed that more than half of all the species contain the 1st ATG, all 88 species have the 2nd, and 87 species have 3rd ATG of TUNAR (Figure S3). Therefore, we generated ATG deletion constructs for each of these potential initiating codons and found that removing the 2nd ATG abolished translation of TUNAR (Figures 2E and 2F). Hence, TUNAR contains an sORF from the 2nd ATG start codon to the stop codon that translates a 48-amino-acid micropeptide. To keep consistency with the previous nomenclature, we named this micropeptide BNLN.
Figure 2.

TUNAR encodes a novel micropeptide, BNLN
(A) Schematic representation of BNLN reporter constructs. BNLN coding sequence (CDS) is shown in pink block. (B) Representative images (20×) and (C) activity of Renilla luciferase in HEK293T cells transfected with the indicated BNLN constructs as in (A) for 48 h. Scale bar: 50 μm. The data were normalized to firefly luciferase. ∗∗∗∗p value less than 0.0001 when compared to in-frame construct (n = 4 experimental replicates). AU, arbitrary units. (D) Representative western blots of BNLN expression in HEK293T cells transfected with the indicated BNLN constructs. CT, non-transfected cell control. (E) Representative western blots of BNLN expression in cells transfected with the indicated BNLN constructs for 48 h. (F) Levels of mRNAs encoding for BNLN in HEK293T cells expressing full-length, ATG-deleted, and CTG-deleted BNLN CDS. The data were normalized to ACTB expression level. ∗∗∗p value less than 0.0001 when compared to the full BNLN-expressing cells (n = 6, experimental replicates). Data are shown as means ± SEM; statistical significance was determined by ANOVA followed by Sidak’s multiple comparisons test in (C) and (F). p < 0.05.
BNLN localizes at the endoplasmic reticulum (ER) in pancreatic β cells
BNLN/TUNAR is highly expressed in the human islet (Figure 1A). In situ hybridization analysis in islets from human donors showed that BNLN expression is enriched in the insulin-producing β cells (Figure 3A), which is in agreement with the analysis of previous RNA-seq data.5,6 Our in silico sequence analysis revealed that BNLN harbors a single-pass transmembrane domain at its C terminus (Figure 1D; Figure S2B). The multispecies alignment showed that this transmembrane domain is extremely conserved and present in all 88 species (Figure 1D; Figure S3). To determine the sub-cellular localization of BNLN, we generated N-terminal and C-terminal GFP-FLAG-tagged BNLN constructs (Figure 3B). We then performed immunofluorescent analysis in INS-1 cells. As shown in Figure 3C, in contrast to the GFP control, which was dispersed throughout cells, BNLN mainly localized at the ER in the INS-1 cell, with detectable expression in lysosomes, mitochondria, peroxisomes, and Golgi (Figure 3D). To further assess whether BNLN is secreted or expressed extracellularly, we generated a BNLN construct fused with HiBiT (Figure 3E). In the Nano-Glo HiBiT detection system, HiBiT-tagged protein is recognized by the complementing polypeptide LgBiT; the bound complex then reconstitutes a luminescent signal. As shown in Figure 3F, BNLN mainly localized intracellularly in INS-1 cells. Taken together, these data show that BNLN is primarily located at the ER of pancreatic β cells.
Figure 3.

BNLN localizes at the endoplasmic reticulum in β cells
(A) Representative confocal images (60×) of TUNAR in human islets. Small molecular in situ hybridization of BNLN and INSULIN (β cell marker). Scale bar: 5 μm. (B) Representative western blots of BNLN expression in INS-1 cells transfected with the indicated BNLN constructs for 48 h. (C) Representative confocal images (63×) of BNLN in INS-1 cells co-transfected with FLAG-GFP-BNLN and KDEL-RFP (24 h post transfection). CT vector: FLAG-GFP construct. Scale bar: 10 μm. (D) Representative confocal images (63×) of BNLN in INS-1 cells transfected with BNLN-GFP and stained with lysotracker (lysosomes), mitotracker (mitochondria), Acaa1 antibody (peroxisomes), and TGN38 antibody (Golgi). Scale bar: 10 μm. (E) Model of HiBiT protein tagging system in monitoring BNLN localization. INS-1 cells were transfected with HiBiT-tagged BNLN; the cell surface HiBiT was recognized by recombinant LgBiT and NanoBiT substrate in live cells. (F) Expression of cell surface HiBiT-BNLN level in INS-1 cells 24 h after transfecting with the HiBiT-BNLN construct. The level of cell surface HiBiT-BNLN was measured by using LgBiT and the extracellular substrate and normalized to the total expression of the construct by lysing the cells with the lytic substrate in the presence of LgBiT. Data are shown as means ± SEM, and statistical significance was determined by Student’s t test (p < 0.05, n = 3 experimental replicates). ∗∗∗∗p value less than 0.0001 when compared to intracellular signal.
BNLN modulates ER calcium homeostasis and ER function in the β cell
ER calcium homeostasis has a pivotal role in insulin production and secretion in β cells.24 To determine the functional effect of BNLN in the ER, we first assessed the ER Ca2+ ([Ca2+]ER) level by using an ER Ca2+ biosensor (ER-GCaMP6-150) in INS-1 cells overexpressing BNLN or the control construct. Overexpression of BNLN lowered [Ca2+]ER level in the high glucose (17 mM) condition (Figures 4A and 4B), indicating a potential role of BNLN in modulating ER calcium influx. Glucose-stimulated β cells display oscillations of the interrelated cytosolic Ca2+ ([Ca2+]c) and [Ca2+]ER. To evaluate the influence of BNLN on [Ca2+]c homeostasis, we generated FLAG- or V5-tagged BNLN constructs and measured [Ca2+]c by a FLIPR Tetra system. Overexpression of BNLN increased [Ca2+]c in INS-1 cells under both basal and high-glucose conditions (Figures 4C and 4D). We observed this effect with both FLAG- and V5-tagged BNLN constructs. To further assess the effect of BNLN on depolarization-induced calcium dynamics, we measured [Ca2+]c in INS-1 in the absence or presence of KCl. As shown in Figures 4E and 4F, while BNLN overexpression increased high-glucose-induced [Ca2+]c, it did not alter KCl-mediated [Ca2+]c flux, indicating a regulatory role of BNLN independent from depolarization-dependent [Ca2+]c flux that is primarily driven by voltage-dependent calcium channels.
Figure 4.

BNLN regulates glucose-induced calcium dynamics in pancreatic β cells
(A) Representative ER Ca2+ recording of INS-1 cells co-transfected with V5-BNLN and an ER calcium probe (GCaMP6s) after stimulation with high glucose (17 mmol/L) with a microplate reader at 37°C. CT, control V5 vector. (B) Quantification of the area under a curve in (C) (n = 3 experimental replicates). (C) Representative cytoplasmic Ca2+ recording of INS-1 cells transfected with V5-BNLN or FLAG-BNLN after stimulation with high glucose (17 mmol/L). The fluorescent signal was measured in the emission/excitation spectrum of Fluo-8 with FLIPR Tetra System at 37°C. (D) Quantification of the area under a curve in (E) (n = 6–7 experimental replicates). (E) Representative cytoplasmic Ca2+ recording of INS-1 cells overexpressed with FLAG-GFP-BNLN before (2.5 mmol/L glucose) and after stimulation with high glucose (17 mmol/L) in the absence or presence of KCl (40 mmol/L). The fluorescent signal was measured in the emission/excitation spectrum of Fluo-8 with a microplate reader at 37°C. (F) Quantification of the area under a curve in (E) (n = 8–9 experimental replicates). (G) ATF6LD-cluc secretion measured in INS-1 cells with BNLN overexpression in the presence of low glucose (2.5 mmol/L) or high glucose (16.7 mmol/L) for 1–2 h at 37°C. Data were normalized to Gluc secretion (n = 13–15 experimental replicates). (H) Representative western blots of BNLN and SERCA3 in HEK293T cells transfected with the indicated constructs for 24 h. (I) PLA assay for SERCA3 interaction with BNLN in INS-1 cells cultured in low glucose (2.5 mmol/L) or challenged with high glucose (17 mmol/L). Scale bar: 10 μm. −Ab, no antibody control. A model of PLA assay is shown on top of the panel. V5-SERCA3 and FLAG-GFP-BNLN were recognized by primary antibodies and secondary antibodies coupled with connector oligos. Data are shown as means ± SEM. ∗p value equal to 0.05 when compared to the CT vector group in (C) and ∗∗∗∗p value less than 0.0001 when compared to the CT vector group in (B), (D), and (F) and compared to treatment of low-glucose in cells with same construct in (G); ###p value equal to 0.0001 when compared to the CT group in cells treated with the same concentrations of glucose in (G). Statistical significance was determined by Student’s t test in (B) and (F), and ANOVA followed by Tukey’s multiple comparisons test in (D) and (G), p < 0.05.
Calcium level is tightly regulated to maintain ER chaperone activity and protein folding.31 We found that BNLN reduced [Ca2+] in the ER of INS-1 cells (Figures 4A and 4B). To determine whether the BNLN-mediated lowering [Ca2+]ER effect alters ER function, we examined the functional impact of BNLN on ER homeostasis, using an ATF6 luminal domain (ATF6LD) Cypridina noctiluca (Cluc) secretion reporter assay in INS-1 cells. In this assay, cells with abundant ER chaperones retain the ATF6LD-Cluc in the ER and secrete minimal luciferase, while cells with limited ER chaperone availability release the chimeric protein, promoting luciferase secretion into the medium.32 We found that the high-glucose challenge (17 mmol/L) led to a decreased ER chaperone availability (increased ATF6LD-cluc secretion) in INS-1 cells, which was ameliorated by BNLN overexpression (decreased ATF6LD-cluc secretion) (Figure 4G). These data indicated that BNLN-mediated calcium dynamics in the ER did not impair ER function in INS-1 cells. In contrast, BNLN primed the β cell ER against the high-glucose-induced ER stress.
It has been demonstrated that some micropeptides exert their functions through a physical interaction with other proteins by forming functional complexes.12,13,15,20 To identify potential BNLN-interacting protein partners in pancreatic β cells, we performed a protein pull-down assay followed by mass spectrometry analysis, using lysates from INS-1 cells with BNLN-FLAG overexpression. GFP-FLAG overexpression was used as a control construct. One protein enriched in BNLN-FLAG pull-down compared to the GFP-FLAG pull-down was sarco-endoplasmic reticulum Ca2+-ATPases 3 (SERCA3; Table S2), a major calcium transporter in the ER. We further validated this interaction by co-immunoprecipitation (coIP)-western blot analysis in HEK293 cells with BNLN and SERCA3 overexpression (Figure 4H). To determine the impact of glucose on the interaction of BNLN with SERCA3, we further performed a proximity ligation assay (PLA) in INS-1 cells in the presence of low (2.5 mmol/L) or high (17 mmol/L) glucose. As shown in Figure 4I, a low level of interaction between BNLN and SERCA3 occurred in low-glucose conditions (2.5 mmol/L), and this interaction was elevated in the presence of high glucose (17 mmol/L). Taken together, these data indicated an important role of BNLN in modulating calcium dynamics in the pancreatic β cells.
BNLN enhances glucose-stimulated insulin secretion
Ca2+ oscillations in pancreatic β cells are critical for their responsiveness to changes in glucose levels.33 To establish the functional role of BNLN in the pancreatic β cell, we first measured GSIS in INS-1 cells with BNLN overexpression using adenovirus-mediated gene delivery. As shown in Figure 5A, BNLN overexpression significantly increased GSIS in INS-1 cells compared to cells overexpressed with the control vector. To verify that this effect was mediated by the translated micropeptide and not the RNA transcript, we transfected INS-1 cells with the 2nd ATG-deletion BNLN construct (which does not produce the micropeptide) and found that this construct did not affect GSIS (Figure 5B). To further examine the BNLN-mediated insulin secretion, we transduced islets isolated from lean mice with the adenovirus-mediated BNLN construct. As shown in Figure 5C, GSIS was significantly enhanced in islets overexpressing BNLN. To define whether endogenous BNLN is required for GSIS, we generated an adenovirus-mediated shTunar construct using a previously validated short hairpin RNA (shRNA) sequence targeting Tunar.30 We then measured GSIS in mouse islets transduced with adenovirus-expressing Tunar shRNA or control (lacZ shRNA). As shown in Figures 5D and 5E, suppression of BNLN decreased insulin secretion compared to control. Together, these data indicate that BNLN plays an important role in regulating insulin secretion in islets.
Figure 5.

BNLN regulates glucose-stimulated insulin secretion
(A) Glucose stimulated insulin secretion in INS-1 cells overexpressed with FLAG-GFP-BNLN in low glucose (2.5 mmol/L) or high glucose (17 mmol/L) for 1 h each (n = 3–4 experimental replicates). The data were normalized to insulin content. Representative western blots of BNLN expression are shown on the top of panel. (B) GSIS in INS-1 cells overexpressed with the indicated constructs for 48 h (n = 3–4 experimental replicates). The data were normalized to low glucose. (C) GSIS measured in isolated islets from mice fed a regular diet (RD) (N = 5–10 age-matched male mice; 12 weeks) followed transduction of adeno-GFP (CT) or adeno-BNLN constructs (48 h). The data were normalized to insulin content. (D) GSIS measured in isolated islets from mice transduced with Ad-shLacZ and Ad-shTunar (n = 3–4 biological replicates). The data were normalized to insulin content. (E) Levels of mRNAs encoding for Tunar in islets isolated from mice in (D). The data were normalized to Hprt expression in the islets (n = 3–4 biological replicates). (F) GSIS measured in isolated islets from mice fed a HFD (N = 3–6 age-matched male mice biological replicates; 12 weeks on HFD) followed transduction of adeno-GFP (CT) or adeno-BNLN constructs (48 h). The data were normalized to insulin content. (G) Levels of mRNAs encoding for BNLN in islets isolated from mice fed a RD or a HFD (12 weeks). The data were normalized to Hprt expression in the islets (n = 3–4 biological replicates). (H–K) Representative GSIS measured in islets from human donors followed transduction of adeno-GFP (CT) or adeno-BNLN constructs (48 h; N = 5–7 human donors). The data were normalized to insulin content. In (F), GSIS was performed on a male non-diabetic human donor of 69 years of age, 27.2 BMI; in (G), GSIS was performed on a male non-diabetic human donor of 18 years of age, 19 BMI. (I) Insulin content measured in islets from human donors followed transduction of adeno-GFP (CT) or adeno-BNLN constructs (48 h). Data are represented as a difference in intracellular insulin content after performing GSIS between CT and BNLN human islets. Data are shown as means ± SEM. ∗p value equal to 0.05, ∗∗p value equal to 0.01, ∗∗∗∗p value less than 0.0001 when compared to treatment of low glucose in cells/islets with same type of construct in (A), (C), (D), and (G), to the CT vector group in (B) and (E), to the RD group in (F); #p value less than 0.05, ##p value less than 0.01, ###p value less than 0.0001 when compared to the CT group in cells/islets incubated with the same concentrations of glucose in (C), (D), and (G). Statistical significance was determined by Student’s t test in (E), (F), (J), and (K), and ANOVA followed by Tukey’s multiple comparisons test in (A), (B), (C), (D), and (G), p < 0.05.
Obesity results in dysregulated GSIS in pancreatic islets. To establish the pathophysiological relevance of BNLN expression, we next assessed the expression level of Tunar transcripts in mouse islets from lean mice and mice with DIO. Tunar expression was significantly downregulated in islets from obese mice (Figure 5F). To test whether BNLN could rescue obesity-associated islet dysfunction, we further examined GSIS in lean and obese mouse islets following BNLN overexpression. As shown in Figure 5G, overexpression of BNLN significantly improved GSIS in islets from mice with DIO. Finally, to establish the functional relevance of BNLN in humans, we measured GSIS in human islets with BNLN overexpression (Table S3). Overexpression of BNLN significantly increased GSIS in islets from non-diabetic humans with minimal effect on insulin content (Figures 5H–5K). These data strongly implicate that BNLN functions as a small peptide to modulate insulin secretion in β cells.
Discussion
Obesity and diabetes are characterized by dysregulation of insulin secretion from pancreatic β cells. Although lncRNAs have been implicated in this process,5, 6, 7 there is no evidence of the regulatory role of lncRNA-encoded micropeptides in pancreatic β cell function thus far. Our study offers the first insight into the impact of micropeptides in β cell physiology. We showed that the lncRNA TUNAR (also known as TUNA, HI-LNC78, or LINC00617) encodes BNLN, a 48-amino-acid micropeptide. We further demonstrated that BNLN regulates glucose-induced insulin secretion in β cells and intact islets in part through modulating ER homeostasis.
lncRNAs regulate key biological processes by mediating transcriptional activation, heterochromatin formation, interaction with microRNAs, and other mechanisms.34,35 However, recent studies have revealed that some transcripts identified as lncRNAs actually do contain sORFs that encode micropeptides (microproteins).12, 13, 14, 15, 16, 17, 18, 19, 20 In this study, we applied two computational programs, PhyloCSF and RNAcode, to prioritize the search for additional micropeptide-encoding lncRNAs expressed in human pancreas. It should be noted that both PhyloCSF and RNAcode depend on the quality of whole-genome sequence alignment. False negatives could result from poor or incorrect whole-genome sequence alignment. Among the predicted micropeptide-encoding lncRNAs, we chose a single lncRNA, TUNAR, for further characterization because it ranked at the top of both the expression level in human islets and the coding potential. In addition, TUNAR has been shown to be important for ESC pluripotency and neural differentiation.36,37 Dysregulation of TUNAR has been implicated in the progression of Huntington’s disease38 and breast cancer.39 Notably, a recent study showed that knocking down TUNAR suppresses insulin secretion in a human β cell line.6 Multiple molecular mechanisms have been proposed underlying functions of TUNAR in the context of diverse biological processes. For example, it has been suggested that TUNAR forms an RNA-multiprotein complex to activate pluripotency genes in a β cell line.36 Our computational and experimental studies identified an sORF encoding BNLN, a 48-amino-acid micropeptide within the last exon of TUNAR. Overexpression of this micropeptide increased GSIS, while deletion of the start codon (ATG) abolished the micropeptide’s function (Figure 5B). However, we could not completely rule out a role of TUNAR lncRNA in this process. Therefore, future studies will focus on dissecting the contributions of TUNAR RNA and BNLN micropeptide on the β cell transcriptome, development and differentiation, and metabolic functions. In addition to TUNAR/BNLN, several potential micropeptide-encoding lncRNAs are expressed at high levels in human islets, suggesting important roles for maintaining pancreatic functions.
Accumulating evidence demonstrates that transmembrane micropeptides tightly modulate intracellular and extracellular signaling cascades.40 We found that BNLN contains a transmembrane domain at the C terminus. To determine the sub-cellular localization, cellular function, and molecular mechanisms of BNLN in β cells, we generated a set of epitope-tagged BNLN constructs. It is possible that epitope tags altered the signal sequences and function of BNLN; however, we did not observe any functional differences between the differently tagged BNLN constructs (Figure 4C). Further studies with specific anti-BNLN antibodies will be necessary to confirm subcellular localization of the endogenous micropeptide.
ER calcium homeostasis is required for insulin production and secretion in β cells.24 Ca2+ serves as a critical co-factor for protein chaperones and foldases needed to support high levels of protein translation and pro-insulin processing.31 Moreover, the ER of β cells contributes to a tight regulation of cytosolic Ca2+ by taking up Ca2+ when the cell is depolarized (cytosolic Ca2+ is elevated) and slowly releasing Ca2+ when the cell is repolarized.41 In pancreatic islets, the ER primarily takes up cytosolic Ca2+ by two SERCA isoforms: ubiquitously expressed SERCA2b, and SERCA3, which is expressed only in the islet β cell.42,43 While SERCA2b regulates basal [Ca2+]c,43 it has been suggested that SERCA3 is responsible for replenishing ER Ca2+ when the cytosolic Ca2+ level is elevated by depolarization,44 thus prolonging the Ca2 oscillation. We showed that overexpression of BNLN did not alter KCl-induced [Ca2+]c peak but decreased [Ca2+]ER and increased [Ca2+]c in response to stimulatory glucose concentrations (Figure 4E). This is in line with a study from Ravier et al.,45 who showed that SERCA3 null islets exhibited decreased ER Ca2+ influx, leading to an increased cytosolic Ca2+ oscillatory amplitude and enhanced insulin secretion. Our study mainly relied on INS-1 cells as a surrogate for β cells, and determining how BNLN modulates islet Ca2+ oscillation/kinetics in health and obesity/diabetes requires further studies.
We found that, in β cells, BNLN interacts with SERCA3 (Figures 4H and 4I) and decreases Ca2+ buffer capacity of the ER in response to high glucose (Figures 4A and 4B), indicating a potential inhibitory role of BNLN on SERCA3. However, whether this is primarily the result of reduction of SERCA3 enzyme activity requires further investigation. Furthermore, sustained high concentration of glucose elicits ER stress in the β cell.31 Disturbed ER homeostasis leads to impaired ER Ca2+ efflux, Ca2+-induced Ca2+ release, as well as dysfunction of insulin production in the β cell. We found that the high-glucose-induced ER stress was ameliorated by BNLN overexpression, while BNLN decreased ER Ca2+ level. Further study is needed to comprehensively delineate the impact of BNLN on ER homeostasis and ER Ca2+ leakage in β cells under diverse ER stress conditions. Notably, glucose and amino acids promote ER Ca2+ uptake in the absence of external Ca2+,33,46 suggesting that cytosolic Ca2+-binding proteins and other intracellular Ca2+ storage represent an important source of Ca2+ that can be pumped by the ER. Future study will be required to establish the functional impact of BNLN on other protein-binding partners (Table S2).
In summary, our study demonstrates that TUNAR, a previously annotated lncRNA, encodes a conserved 48-amino-acid micropeptide BNLN, which modulates Ca2+ homeostasis in β cells, consequently regulating GSIS. This study indicates that dysregulation of BNLN in the pancreas might contribute to the obesity-associated malfunction of insulin secretion. Our study provides important insights into the molecular mechanisms that underlie the fine-tuning of glucose-induced insulin secretion by a translational function of a lncRNA. In addition, our study offers a broader impact on understanding an intersection between lncRNA biology and pathophysiological processes in islets, which is relevant in obesity and type 2 diabetes. It remains an intriguing possibility that insights from this study could be exploited for therapeutic interventions in obesity and type 2 diabetes.
Materials and methods
Prioritizing putative micropeptide-encoding lncRNAs in human pancreas
RNA-seq data of human pancreas islets were downloaded from EBI ArrayExpress database (E-MTAB-1294).5 RNA-seq reads were quality checked using the FastQC tool (https://www.bioinformatics.babraham.ac.uk/projects/fastqc). Low-quality and adaptor sequences were trimmed using the Trimmomatic.47 Expression of transcripts was quantified using the Salmon,48 and estimates of transcript abundance for gene-level analysis were imported and summarized using the tximport49 function of the R/Bioconductor software suite.50 Transcripts that have TPM above 1 were evaluated for their coding potential with PhyloCSF and RNAcode. We downloaded 100-species whole-genome alignments (multiz100way) from the UCSC database. A custom python script was used to extract and prepare multispecies DNA sequence alignments for each transcript of protein-coding (<100 amino acids) genes and lncRNAs. We filtered for transcripts that had at least 2 species that have more than 60-nucleotide DNA sequence in the multispecies alignments. PhyloCSF and RNAcode were run with these multispecies DNA sequence alignments as input. To prioritize search of putative micropeptide encoded by lncRNAs, we ranked genes by both the expression level in human islets and the coding potential.
Animals
Animal care and experimental procedures were performed with approval from the University of Iowa’s Institutional Animal Care and Use Committee. C57BL/6J mice (The Jackson Laboratory, 000664, Bar Harbor, ME, USA) were kept on a 12 h light/dark cycle and were fed the regular diet (RD) (7319 Teklad global diet, St. Louis, MO, USA). Mice used in generating the DIO model were placed on a 60% kcal high-fat diet (HFD; Research Diets, D12492, New Brunswick, NJ, USA) immediately after weaning, at 3 weeks of age.
Human islets
Human islet study was reviewed by the institutional review board at the University of Iowa and deemed non-human study. Human islets were received from the Alberta Diabetes Institute Islet Core with reported viability and purity above 80%. Islet were cultured in (Connaught Medical Research Laboratories (CMRL) 1066 (Thermo Fisher Scientific, 11530037, Waltham, MA, USA) medium with 1% human serum albumin, 1% Pen-Strep (Thermo Fisher Scientific, 15140163, Waltham, MA, USA), and 1% L-glutamine (Thermo Fisher Scientific, 25030164, Waltham, MA, USA) overnight at 37°C upon arrival for recovery upon shipping. The eight donors were: age, 20–69 years; BMI, 19–33.9; Hba1c, 4.9–5.8; males; cause of death, neurological.
Cell culture, transfection, and luciferase assay
The rat insulinoma cells (INS-1/832/3)51 were cultured in Roswell Park Memorial Institute (RPMI)-1640 medium (Thermo Fisher Scientific, 11875119, Waltham, MA, USA) supplemented with 10% fetal bovine serum (FBS), 10 mmol/L HEPES (Thermo Fisher Scientific, 15630130, Waltham, MA, USA), 2 mmol/L L-glutamine, 1 mmol/L sodium pyruvate (Sigma-Aldrich, P2256, St. Louis, MO, USA), and 50 μmol/L 2-mercaptoethanol (VWR, 97064-880, Radnor, PA, USA). Cells were transfected with DNA constructs (1 μg/well in 12-well plate) using Lipofectamine 2000 reagent (Invitrogen, 11668019, Calsbad, CA, USA) in Opti-MEM medium (Thermo Fisher Scientific, 31985088, Waltham, MA, USA). At 48 h post transfection, the transfected cells were trypsinized (Trypsin-EDTA 0.05%; Thermo Fisher Scientific, 25300054, Waltham, MA, USA), mixed, and re-plated in an appropriate plate in order to achieve homogeneous population across wells for subsequent analyses. The HEK293T cells (ATCC, Manassas, VA, USA) were cultured in DMEM medium with 10% FBS and 1% penicillin-streptomycin. Cells were transfected with DNA constructs (0.5 μg/well of 24-well plate) using Lipofectamine 3000 reagent (Thermo Fisher, L3000015, Waltham, MA, USA) in Opti-MEM medium (Thermo Fisher Scientific, 31985-062, Waltham, MA, USA). At 48 h post transfection, the activities of firefly luciferase and Renilla luciferase were measured using the Luciferase Assay System (Promega, E1500, Madison, WI, USA) and Renilla Luciferase Assay System (Promega, E2810, Madison, WI, USA), separately.
Constructs, adenovirus preparation, and transduction
The BNLN constructs were generated by sequence- and ligation-independent cloning (SLIC) method.52 The detailed information of constructs used in each figure is listed in Table S2. Briefly, tRFP and Renilla luciferase-GFP-expressing sequences were fused to the C terminus of human BNLN (in-frame and out-of-frame; fs1, fs2). The recombined fragments were then inserted into the pCAGEN vector (Addgene, 11179, Watertown, MA, USA). To determine transcription initial site and BNLN localization, full-length human BNLN, ATGs-, and CTG-deleted BNLN (dATG1, dATG2, dATG3, dCTG) were fused with FLAG and cloned into pcDNA3.1(−) (Invitrogen, V79520, Carlsbad, CA, USA) vector. To test endogenous translation of BNLN, we knocked in FLAG tag right before predicted stop codon in mESCs with CRISPR (guide-RNA: 5′-GAAAGGCCCCATTCAGACCT-3′). KDEL plasmid was obtained from Addgene (114177, Watertown, MA, USA). The HiBiT-BNLN and V5-BNLN constructs were generated by fusing HiBiT vector (Promega, Maddison, WI, USA) and V5 sequence, respectively, in-frame with the N terminus of BNLN. The fused fragments were then inserted into the pQCXIP vector (Addgene, 631516, Watertown, MA, USA) by using NEBuilder HiFi DNA Assembly Cloning Kit (New England Biolabs, E5520S, Ipswich, MA, USA).
ER-GCaMP6-1553 was provided by Addgene (Watertown, MA, USA). Validated shRNA sequences targeting Tunar were used to knockdown Tunar/Bnln in mouse islets (shTunar: 5′GGCACCATGAAGGAGTCATTT-3′), shRNA sequences targeting lacZ were used as control. Adenoviruses carrying mouse TUNAR BNLN were generated using the ViraPower adenoviral expression system (Invitrogen, Carlsbad, CA, USA). Adenoviruses were amplified in HEK293A cells (ATCC, Manassas, VA, USA) and purified by CsCl gradient centrifugation. The viruses were titered using Adeno-X Rapid Titer Kit (Takara Bio, 632250, Kusatsu, Shiga, Japan) and transduced into the cells as previously described.54 Cultured intact mouse or human islets were resuspended in 0.1 mmol/L EGTA (Sigma-Adlrich, 234626, St. Louis, MO, USA) in serum-free CMRL followed by transduction of indicated adenoviral constructs at 10,000 plaque-forming units per islet equivalent (pfu/IEQ) for 1 h at room temperature before transferring to CMRL medium with 10% heat-inactivated FBS for culture overnight. The culture medium was replaced the next day, and the islets were cultured for additional 24 h before subjecting them to GSIS assay.
Nano-Glo HiBiT extracellular detection system
INS-1 cells were transfected with FLAG-GFP or HiBiT-BNLN as described above and seeded in an opaque 96-well plate (Fisher Scientific, 08-771-26, Waltham, MA, USA) at ∼15,000 cells/well in the culture medium. The experiment was carried out according to the manufacturer’s protocol (Promega, N2422, Madison, WI, USA). Briefly, the transfected cells were incubated with Nano-Glo HiBiT extracellular buffer, LgBiT protein, and Nano-Glo HiBiT extracellular substrate, and luminescence was detected after 5–10 min using a luminescence microplate reader (SpectraMax, Molecular Devices, San Jose, CA, USA). The expression of extracellular HiBiT-BNLN was normalized to the total intracellular pool of HiBiT-BNLN by lysing the cells and measuring luminescence with Nano-Glo HiBiT lytic detection system (Promega, N2422, Madison, WI, USA), following the protocol.
Western blotting and immunoprecipitation
Cells were lysed with a lysis buffer containing 0.4% of NP-40, protease inhibitor cocktail (Sigma-Aldrich, P8340, St. Louis, MO, USA), and Na3VPO4 (Sigma-Aldrich, St. Louis, MO, USA). Protein concentration was determined by Pierce BCA kit (Thermo Fisher Scientific, 23225, Waltham, MA, USA), and samples were subjected to SDS-polyacrylamide gel electrophoresis, as previously described.44 For immunoprecipitation assay, cells were lysed in radioimmunoprecipitation assay (RIPA) buffer (50 mmol/L Tris, 150 mmol/L NaCl, 1% NP40, 0.25% sodium deoxycholate). 1 mg proteins were immunoprecipitated with protein A/G magnetic beads (Thermo Fisher, 88802, Waltham, MA, USA) conjugated with anti-IgG (Cell Signaling Technology, 2729, Danvers, MA, USA), anti-FLAG (Thermo Fisher, A36797, Waltham, MA, USA) and eluted by 4× lithium dodecyl sulfate (LDS; Invitrogen, NP0008, Carlsbad, CA, USA). Membranes were immunoblotted with anti-V5 (ab15528, Cambridge, UK), anti-FLAG, and anti-beta actin (ab8227, Cambridge, UK) at a 1:1,000 dilution. Secondary antibodies were horseradish peroxidase-conjugated goat-anti-mouse-IgG (Santa Cruz Biotechnology, sc-2005, Dallas, TX, USA) and horseradish peroxidase-conjugated mouse-anti-rabbit-IgG (Santa Cruz Biotechnology, sc-2357, Dallas, TX, USA) at a 1:10,000 dilution. Signal was detected using the ChemiDoc Touch Imaging System (BioRad, Hercules, CA), and densitometry analyses of western blot images were performed by using the Image Lab software (BioRad, Hercules, CA, USA).
Proximity ligation in situ hybridization (PLISH)
In situ hybridization was performed as previously described,55 with some modifications. Briefly, human islets were fixed and sectioned following the typical formalin-fixed paraffin-embedded tissue-processing protocol. The sections were then incubated in citrate-based target unmasking solution (Vector Laboratories, H-3300, Burlingame, CA, USA) with 0.05% lithium dodecyl sulfate (Sigma, L4632, St. Louis, MO, USA) at 65°C for 30 min. The slides were then incubated with 0.05 mg/mL pepsin (Sigma-Aldrich, P6887, St. Louis, MO, USA) in 0.1 mol/L HCl for 10 min at 37°C and processed with the typical proximity ligation in situ hybridization.55 RNA sequences that were targeted by short-paired hybridization probes were:
Human INS-1: 5′-CTGGTGGAAGCTCTCTACCTAGTGTGCGGGGAACGAGGCT-3′;
Human INS-2: 5′-GCTGGAGAACTACTGCAACTAGACGCAGCCCGCAGGCAGC-3′;
Human GCG-1: 5′-TGGACTCCAGGCGTGCCCAAGATTTTGTGCAGTGGTTGAT-3′;
Human GCG-2: 5′-AGATGAACACCATTCTTGATAATCTTGCCGCCAGGGACTT-3′;
Human GCG-3: 5′-TCTTCACAACATCACCTGCTAGCCACGTGGGATGTTTGAA-3′;
Human BNLN: 5′-TCTTGGCAATGCTGGGGATTATCGGGACCATTCTGAACCT-3′;
Human BNLN: 5′-AGCAGGCTTGACCCGCACATACCACCCAATCAAATGCACC-3′;
Human BNLN: 5′-ATTCCAGATCGCTGACAGATATCACATATTTGAAAAGATG-3′;
Human BNLN: 5′-CTTCACTTGACGAGCTATTTAGTGGAAAAACCACAGGCGC-3′;
Human BNLN: 5′-GCAGACCTTAGATGCACCCTATCTTTACTGAGAATTATGC-3′;
Human BNLN: 5′-TTTGATTTTAGCGGTCATGTACCGCGAGAGTTGGGAAGAA-3′.
Immunocytochemistry and confocal microscopy
INS-1 cells were then fixed in 4% paraformaldehyde for 10 min at room temperature, blocked in 5% goat serum, incubated with Hoechst 33342 (Thermo Fisher Scientific, H3570, Waltham, MA, USA), and mounted with a glass coverslip. For subcellular organelle localization, Lystroacker Red DND-99 (Thermo Fisher Scientific, L7528, Waltham, MA, USA), Mitotracker Red CMXRos (Thermo Fisher Scientific, M7512, Waltham, MA, USA), ACAA1A antibody (Gene Tex, GTX114229, Zeeland, MI, USA), RFP-KDEL plasmid, and TGN38 antibody (Novus, NB300-575, Littleton, CO, USA) were used to detect lysosomes, mitochondria, peroxisomes, the ER, and Golgi, respectively. Images were acquired using a Zeiss 700-point scanning confocal microscope with a 63× lens with oil (Zeiss, Oberkochen, Germany). Images were analyzed by Fiji software. During analysis, single z stacks were processed, and images from different channels were merged. For PLISH assays, stack images were taken using the 60× lens of Olympus microscopy (FV3000, confocal laser scanning microscope).
Quantitative real-time RT-PCR
Total RNA was isolated using the Trizol reagent (Invitrogen, 15596026, Carlsbad, CA, USA) and reverse transcribed into cDNA using a PrimeScript RT Master Mix (Takara RR036A, Kusatsu, Shiga, Japan). Quantitative real-time RT-PCR analysis was performed using TB Green Premix Ex Taq (Clontech, RR420A, Mountain View, CA, USA) and the following primers: BNLN-F: 5′-TTC TCC TCG CCT TCC TGC-3′; BNLN-R: 5′-CAT CTT GGT TGC AAA TGT CT-3′; ACTB-F: 5′-CTC TTC CAG CCT TCC TTC-3′; ACTB-R: 5′-ATC TCC TTC TGC ATC CTG TC-3′; Hprt-F: 5′-CAG TCC CAG CGT CGT GAT TA-3′; Hprt-R: 5′-GGC CTC CCA TCT CCT TCA TG-3′; Bnln-F: 5′-GGA GAA TGA GGC AGG AAC CC-3′; Bnln-R: 5′ACA CGC TCT CTT CCT TGC TC-3′.
Calcium imaging
[Ca2+]c measurement
INS-1 832/3 cells were transfected with FLAG-GFP or FLAG-GFP-BNLN. 24 h after transfection, the INS-1 cells were plated at ∼25,000 cells/well in a HTB9-coated Greiner Sensoplate glass bottom 96-well plate (Millipore Sigma, St. Louis, MO, USA). Prior to imaging, the cells were loaded with Screen Quest Fluo-8 no wash calcium red dye (AAT Bioquest, 36314) indicator in the DMEM (Thermo Fisher Scientific, A1443001, Waltham, MA, USA) culture medium supplemented with 2.5 mmol/L glucose and 0.1% BSA for 1 h at 37°C. A fluorescent microplate reader (CLARIOstar PLUS, BMG Labtech, Germany) was used to inject glucose (final concentration of 20 mmol/L) to cells and to acquire fluorescent signal every 0.6 s for 10 min.
For measurement of [Ca2+]c using Fluorescent Imaging Plate Reader(R) (FLIPR) Tetra System (Molecular Devices, San Jose, CA, USA), INS-1 cells were transfected with pQCXIP, FLAG-BNLN, or V5-BNLN (1 μg DNA/well) in a 12-well plate (3 wells/each DNA construct) with Lipofectamine 2000, as described above. A suspension of INS-1 cells was pipetted in a 384-well culture black microplate with optic bottom plate (Greiner-Bio, 781090, St. Louis, MO, USA) at ∼17,000 cells/well in 25 μL of the low-glucose DMEM culture medium. 25 μL of Fluo-8 calcium dye was added to the cell suspension. The plate was incubated at 37°C for 30 min, followed by another 30 min incubation at room temperature in the dark. Meanwhile, a 384-well compound plate (Costar, 3657) was loaded with low glucose (27.5 mmol/L), high glucose (181.5 mmol/L), and potassium chloride as a positive control (220 mmol/L). The FLIPR was utilized to transfer the solutions from the compound plate into the black plate and to read the Ca2+ signal. The basal signal was measured for 20 s every second, then the solutions were added (5 μL/each), and the response signal was read for 10 min every 0.8 s.
[Ca2+]ER measurement
INS-1 cells were co-transfected with ER-GCaMP6s and pQCXIP or V5-BNLN using Lipofectamine 2000, as described above. The next day, the cells were plated at ∼25,000 cells/well in a HTB-9 coated plate, as described above. 24 h later, the cells were subjected to treatment with DMEM containing 2.5 mM glucose at 37°C for 1 h. Basal signal was acquired in the GFP excitation/emission spectrum using the fluorescent microplate reader as described above every 0.8 s for 1 min. Then a high-glucose solution (17 mM final concentration) was injected, and the fluorescent signal was collected for 5 min.
Murine islet isolation
The islets were isolated as previously described.56 Briefly, lean C57BL/6J male mice (12–20 weeks of age) and mice with diet-induced obesity (12–16 weeks of HFD) were anesthetized with isoflurane, and the pancreas was perfused with Hank’s balanced salt solution (HBSS) containing type V collagenase (0.8 mg/mL) via the common bile duct. The pancreas was then removed and digested at 37°C for 10–12 min with physical agitation to release islets. Islets were further washed with RPMI-1640 with 1% FBS and purified on Histopaque 1077 and 1119 gradients (Sigma-Aldrich, 10771, 11191, St. Louis, MO, USA). The islets were then collected, washed, and cultured in RPMI-1640 supplemented with 10% FBS, 1% Pen-Strep, and 1% HEPES in 30 mm dishes at 37°C.
GSIS
For GSIS in murine islets, 30–40 islets of similar size were picked and placed in separate wells in a plastic 12-well plate (Fisher Scientific, 07-200-82, Waltham, MA, USA). The islets were rinsed with 1 mL of Secretion Assay Buffer (SAB) adjusted to pH 7.2, containing 0.114 mol/L sodium chloride (Sigma-Aldrich, S9888, St. Louis, MO, USA), 0.47 mmol/L potassium chloride (Sigma-Aldrich, P9333, St. Louis, MO, USA), 0.12 mmol/L potassium dihydrogen phosphate (Sigma-Aldrich, 1.04871, St. Louis, MO, USA), 0.116 mmol/L magnesium sulfate (Sigma-Aldrich, M2643, St. Louis, MO, USA), 20 mmol/L HEPES (Thermo Fisher Scientific, 15630130, Waltham, MA, USA), 2.5 mmol/L calcium chloride (Sigma-Aldrich, 449709, St. Louis, MO, USA), 0.2% bovine serum albumin, and 0.2% sodium bicarbonate (Sigma-Aldrich, S5761, St. Louis, MO, USA).56 The islets were then equilibrated in SAB containing low glucose (2.5 mmol/L) for 1 h at 37°C. Next, the islets were incubated in fresh SAB with low glucose for an additional 1–2 h at 37°C. The supernatant was collected for measuring basal insulin secretion. The islets were then incubated with SAB containing high glucose (16.7 mmol/L) for 1–2 h at 37°C. The supernatant was collected for measuring glucose-stimulated insulin secretion. The islets were lysed in acidified ethanol, and insulin content was measured. Secreted insulin and insulin content were analyzed with STELLUX Chemi Rodent Insulin ELISA (ALPCO, 80-INSMR-CH01, Salem, NH, USA), according to the manufacturer’s protocol.
For GSIS in human islets, 30–40 islets of similar size were picked and subjected to GSIS similar to murine islets. Secreted insulin and insulin content were analyzed with STELLUX Chemi Human Insulin ELISA (ALPCO, 80-INSHU-CH01, Salem, NH, USA), according to the manufacturer’s protocol.
GSIS in INS-1 cells
100% confluent cells were rinsed with SAB and equilibrated with low-glucose SAB for 1–2 h at 37°C. Fresh SAB containing low glucose was added to the cells for an additional 1–2 h at 37°C. The supernatant was then collected for measuring basal insulin secretion. SAB containing high glucose was added to the cells and incubated for an additional 1–2 h at 37°C before supernatant collection. The cells were lysed, and protein was extracted for insulin content. Secreted insulin and insulin content were analyzed with STELLUX Chemi Rodent Insulin ELISA (ALPCO, Salem, NH, USA), according to the manufacturer’s protocol.
Statistics
The data are presented as mean ± standard error of the mean or standard deviation as noted; n represents the number of individual experiments, and N represents the number of human donors or mice. Statistical differences of numeric parameters between two groups were determined with Student’s t test. For statistical analysis of differences between multiple groups, one way and two-way ANOVA were applied, followed by post hoc Tukey’s test. The statistical analyses were performed in Prism.
Acknowledgments
We are grateful to the Alberta Diabetes Institute Islet Core (Canada) for providing us the human islets, and the contributions of the donors whose islets were used, as well as the physicians, nurses, and researchers who procured the specimens. We also thank Dr. Michael Welsh (University of Iowa) for providing technical supports in RNA imaging and Dr. Monica Nagendran and Dr. Tushar Desai (Stanford University School of Medicine) for sharing the proximity ligation in situ hybridization protocol with the Welsh lab. We thank Dr. Timothy Ryan (Weill Cornell Medicine) for donating the ER-GCaMP6-15 to Addgene and Alyona Li for technical support with graphic illustrations. We would like to thank members of the Yang, Cao, and Amendt laboratories for helpful discussion and suggestions. The computational part of this work was supported in part through computational resources provided by The University of Iowa. This work was supported in part by funding from College of Dentistry, The University of Iowa. L.Y. is supported by the NIH (DK108835-01A1) and the American Diabetes Association (1-18-IBS-149); Z.Y.Z. is supported by the American Heart Association (19PRE34380258).
Author contributions
M.L. and F.S. performed the experiments and analyzed the data. Q.W.Q, W.J.Y., Z.Y.Z., B.Y.C., D.S., Y.W.G., and A.V.P. performed the experiments. J.S., Y.I., S.B.S., and L.S.S. provided critical reagents and scientific suggestions on this study. H.J.C. and L.Y. conceived and supervised the study and wrote the manuscript.
Declaration of interests
The authors declare no competing interests.
Footnotes
Supplemental information can be found online at https://doi.org/10.1016/j.omtn.2021.06.027.
Contributor Information
Ling Yang, Email: ling-yang@uiowa.edu.
Huojun Cao, Email: huojun-cao@uiowa.edu.
Supplemental information
References
- 1.Forrest A.R.R., Kawaji H., Rehli M., Baillie J.K., de Hoon M.J.L., Haberle V., Lassmann T., Kulakovskiy I.V., Lizio M., Itoh M., et al. FANTOM Consortium and the RIKEN PMI and CLST (DGT) A promoter-level mammalian expression atlas. Nature. 2014;507:462–470. doi: 10.1038/nature13182. [DOI] [PMC free article] [PubMed] [Google Scholar]
- 2.Davis C.A., Hitz B.C., Sloan C.A., Chan E.T., Davidson J.M., Gabdank I., Hilton J.A., Jain K., Baymuradov U.K., Narayanan A.K., et al. The Encyclopedia of DNA elements (ENCODE): data portal update. Nucleic Acids Res. 2018;46(D1):D794–D801. doi: 10.1093/nar/gkx1081. [DOI] [PMC free article] [PubMed] [Google Scholar]
- 3.Dunham I., Kundaje A., Aldred S.F., Collins P.J., Davis C.A., Doyle F., et al. ENCODE Project Consortium An integrated encyclopedia of DNA elements in the human genome. Nature. 2012;489:57–74. doi: 10.1038/nature11247. [DOI] [PMC free article] [PubMed] [Google Scholar]
- 4.Hon C.-C., Ramilowski J.A., Harshbarger J., Bertin N., Rackham O.J.L., Gough J., Denisenko E., Schmeier S., Poulsen T.M., Severin J., et al. An atlas of human long non-coding RNAs with accurate 5′ ends. Nature. 2017;543:199–204. doi: 10.1038/nature21374. [DOI] [PMC free article] [PubMed] [Google Scholar]
- 5.Morán I., Akerman I., van de Bunt M., Xie R., Benazra M., Nammo T., Arnes L., Nakić N., García-Hurtado J., Rodríguez-Seguí S., et al. Human β cell transcriptome analysis uncovers lncRNAs that are tissue-specific, dynamically regulated, and abnormally expressed in type 2 diabetes. Cell Metab. 2012;16:435–448. doi: 10.1016/j.cmet.2012.08.010. [DOI] [PMC free article] [PubMed] [Google Scholar]
- 6.Akerman I., Tu Z., Beucher A., Rolando D.M.Y., Sauty-Colace C., Benazra M., Nakic N., Yang J., Wang H., Pasquali L., et al. Human Pancreatic β Cell lncRNAs Control Cell-Specific Regulatory Networks. Cell Metab. 2017;25:400–411. doi: 10.1016/j.cmet.2016.11.016. [DOI] [PMC free article] [PubMed] [Google Scholar]
- 7.Wong W.K.M., Sørensen A.E., Joglekar M.V., Hardikar A.A., Dalgaard L.T. Non-Coding RNA in Pancreas and β-Cell Development. Noncoding RNA. 2018;4:41. doi: 10.3390/ncrna4040041. [DOI] [PMC free article] [PubMed] [Google Scholar]
- 8.Alvarez M.L., DiStefano J.K. Functional characterization of the plasmacytoma variant translocation 1 gene (PVT1) in diabetic nephropathy. PLoS ONE. 2011;6:e18671. doi: 10.1371/journal.pone.0018671. [DOI] [PMC free article] [PubMed] [Google Scholar]
- 9.Carter G., Miladinovic B., Patel A.A., Deland L., Mastorides S., Patel N.A. Circulating long noncoding RNA GAS5 levels are correlated to prevalence of type 2 diabetes mellitus. BBA Clin. 2015;4:102–107. doi: 10.1016/j.bbacli.2015.09.001. [DOI] [PMC free article] [PubMed] [Google Scholar]
- 10.de Gonzalo-Calvo D., Kenneweg F., Bang C., Toro R., van der Meer R.W., Rijzewijk L.J., Smit J.W., Lamb H.J., Llorente-Cortes V., Thum T. Circulating long-non coding RNAs as biomarkers of left ventricular diastolic function and remodelling in patients with well-controlled type 2 diabetes. Sci. Rep. 2016;6:37354. doi: 10.1038/srep37354. [DOI] [PMC free article] [PubMed] [Google Scholar]
- 11.Makarewich C.A., Olson E.N. Mining for Micropeptides. Trends Cell Biol. 2017;27:685–696. doi: 10.1016/j.tcb.2017.04.006. [DOI] [PMC free article] [PubMed] [Google Scholar]
- 12.Anderson D.M., Anderson K.M., Chang C.-L., Makarewich C.A., Nelson B.R., McAnally J.R., Kasaragod P., Shelton J.M., Liou J., Bassel-Duby R., Olson E.N. A micropeptide encoded by a putative long noncoding RNA regulates muscle performance. Cell. 2015;160:595–606. doi: 10.1016/j.cell.2015.01.009. [DOI] [PMC free article] [PubMed] [Google Scholar]
- 13.Anderson D.M., Makarewich C.A., Anderson K.M., Shelton J.M., Bezprozvannaya S., Bassel-Duby R., Olson E.N. Widespread control of calcium signaling by a family of SERCA-inhibiting micropeptides. Sci. Signal. 2016;9:ra119. doi: 10.1126/scisignal.aaj1460. [DOI] [PMC free article] [PubMed] [Google Scholar]
- 14.Cai B., Li Z., Ma M., Wang Z., Han P., Abdalla B.A., Nie Q., Zhang X. LncRNA-Six1 Encodes a Micropeptide to Activate Six1 in Cis and Is Involved in Cell Proliferation and Muscle Growth. Front. Physiol. 2017;8:230. doi: 10.3389/fphys.2017.00230. [DOI] [PMC free article] [PubMed] [Google Scholar]
- 15.D’Lima N.G., Ma J., Winkler L., Chu Q., Loh K.H., Corpuz E.O., Budnik B.A., Lykke-Andersen J., Saghatelian A., Slavoff S.A. A human microprotein that interacts with the mRNA decapping complex. Nat. Chem. Biol. 2017;13:174–180. doi: 10.1038/nchembio.2249. [DOI] [PMC free article] [PubMed] [Google Scholar]
- 16.Makarewich C.A., Baskin K.K., Munir A.Z., Bezprozvannaya S., Sharma G., Khemtong C., Shah A.M., McAnally J.R., Malloy C.R., Szweda L.I., et al. MOXI Is a Mitochondrial Micropeptide That Enhances Fatty Acid β-Oxidation. Cell Rep. 2018;23:3701–3709. doi: 10.1016/j.celrep.2018.05.058. [DOI] [PMC free article] [PubMed] [Google Scholar]
- 17.Matsumoto A., Pasut A., Matsumoto M., Yamashita R., Fung J., Monteleone E., Saghatelian A., Nakayama K.I., Clohessy J.G., Pandolfi P.P. mTORC1 and muscle regeneration are regulated by the LINC00961-encoded SPAR polypeptide. Nature. 2017;541:228–232. doi: 10.1038/nature21034. [DOI] [PubMed] [Google Scholar]
- 18.Nelson B.R., Makarewich C.A., Anderson D.M., Winders B.R., Troupes C.D., Wu F., Reese A.L., McAnally J.R., Chen X., Kavalali E.T., et al. A peptide encoded by a transcript annotated as long noncoding RNA enhances SERCA activity in muscle. Science. 2016;351:271–275. doi: 10.1126/science.aad4076. [DOI] [PMC free article] [PubMed] [Google Scholar]
- 19.Pauli A., Norris M.L., Valen E., Chew G.-L., Gagnon J.A., Zimmerman S., Mitchell A., Ma J., Dubrulle J., Reyon D., et al. Toddler: an embryonic signal that promotes cell movement via Apelin receptors. Science. 2014;343:1248636. doi: 10.1126/science.1248636. [DOI] [PMC free article] [PubMed] [Google Scholar]
- 20.Stein C.S., Jadiya P., Zhang X., McLendon J.M., Abouassaly G.M., Witmer N.H., Anderson E.J., Elrod J.W., Boudreau R.L. Mitoregulin: A lncRNA-Encoded Microprotein that Supports Mitochondrial Supercomplexes and Respiratory Efficiency. Cell Rep. 2018;23:3710–3720.e8. doi: 10.1016/j.celrep.2018.06.002. [DOI] [PMC free article] [PubMed] [Google Scholar]
- 21.Lee C., Zeng J., Drew B.G., Sallam T., Martin-Montalvo A., Wan J., Kim S.J., Mehta H., Hevener A.L., de Cabo R., Cohen P. The mitochondrial-derived peptide MOTS-c promotes metabolic homeostasis and reduces obesity and insulin resistance. Cell Metab. 2015;21:443–454. doi: 10.1016/j.cmet.2015.02.009. [DOI] [PMC free article] [PubMed] [Google Scholar]
- 22.Lin M.F., Jungreis I., Kellis M. PhyloCSF: a comparative genomics method to distinguish protein coding and non-coding regions. Bioinformatics. 2011;27:i275–i282. doi: 10.1093/bioinformatics/btr209. [DOI] [PMC free article] [PubMed] [Google Scholar]
- 23.Washietl S., Findeiss S., Müller S.A., Kalkhof S., von Bergen M., Hofacker I.L., Stadler P.F., Goldman N. RNAcode: robust discrimination of coding and noncoding regions in comparative sequence data. RNA. 2011;17:578–594. doi: 10.1261/rna.2536111. [DOI] [PMC free article] [PubMed] [Google Scholar]
- 24.Fu Z., Gilbert E.R., Liu D. Regulation of insulin synthesis and secretion and pancreatic Beta-cell dysfunction in diabetes. Curr. Diabetes Rev. 2013;9:25–53. [PMC free article] [PubMed] [Google Scholar]
- 25.Araki E., Oyadomari S., Mori M. Impact of endoplasmic reticulum stress pathway on pancreatic beta-cells and diabetes mellitus. Exp. Biol. Med. (Maywood) 2003;228:1213–1217. doi: 10.1177/153537020322801018. [DOI] [PubMed] [Google Scholar]
- 26.Berridge M.J. The endoplasmic reticulum: a multifunctional signaling organelle. Cell Calcium. 2002;32:235–249. doi: 10.1016/s0143416002001823. [DOI] [PubMed] [Google Scholar]
- 27.Zhang I.X., Raghavan M., Satin L.S. The Endoplasmic Reticulum and Calcium Homeostasis in Pancreatic Beta Cells. Endocrinology. 2020;161:bqz028. doi: 10.1210/endocr/bqz028. [DOI] [PMC free article] [PubMed] [Google Scholar]
- 28.Engin F., Nguyen T., Yermalovich A., Hotamisligil G.S. Aberrant islet unfolded protein response in type 2 diabetes. Sci. Rep. 2014;4:4054. doi: 10.1038/srep04054. [DOI] [PMC free article] [PubMed] [Google Scholar]
- 29.Safra M., Ben-Hamo S., Kenyon C., Henis-Korenblit S. The ire-1 ER stress-response pathway is required for normal secretory-protein metabolism in C. elegans. J. Cell Sci. 2013;126:4136–4146. doi: 10.1242/jcs.123000. [DOI] [PMC free article] [PubMed] [Google Scholar]
- 30.Lin N., Chang K.-Y., Li Z., Gates K., Rana Z.A., Dang J., Zhang D., Han T., Yang C.S., Cunningham T.J., et al. An evolutionarily conserved long noncoding RNA TUNA controls pluripotency and neural lineage commitment. Mol. Cell. 2014;53:1005–1019. doi: 10.1016/j.molcel.2014.01.021. [DOI] [PMC free article] [PubMed] [Google Scholar]
- 31.Arruda A.P., Hotamisligil G.S. Calcium Homeostasis and Organelle Function in the Pathogenesis of Obesity and Diabetes. Cell Metab. 2015;22:381–397. doi: 10.1016/j.cmet.2015.06.010. [DOI] [PMC free article] [PubMed] [Google Scholar]
- 32.Fu S., Yalcin A., Lee G.Y., Li P., Fan J., Arruda A.P., Pers B.M., Yilmaz M., Eguchi K., Hotamisligil G.S. Phenotypic assays identify azoramide as a small-molecule modulator of the unfolded protein response with antidiabetic activity. Sci. Transl. Med. 2015;7:292ra98. doi: 10.1126/scitranslmed.aaa9134. [DOI] [PMC free article] [PubMed] [Google Scholar]
- 33.Gilon P., Chae H.Y., Rutter G.A., Ravier M.A. Calcium signaling in pancreatic β-cells in health and in Type 2 diabetes. Cell Calcium. 2014;56:340–361. doi: 10.1016/j.ceca.2014.09.001. [DOI] [PubMed] [Google Scholar]
- 34.Batista P.J., Chang H.Y. Long noncoding RNAs: cellular address codes in development and disease. Cell. 2013;152:1298–1307. doi: 10.1016/j.cell.2013.02.012. [DOI] [PMC free article] [PubMed] [Google Scholar]
- 35.Sarropoulos I., Marin R., Cardoso-Moreira M., Kaessmann H. Developmental dynamics of lncRNAs across mammalian organs and species. Nature. 2019;571:510–514. doi: 10.1038/s41586-019-1341-x. [DOI] [PMC free article] [PubMed] [Google Scholar]
- 36.Angcajas A.B., Hirai N., Kaneshiro K., Karim M.R., Horii Y., Kubota M., Fujimura S., Kadowaki M. Diversity of amino acid signaling pathways on autophagy regulation: a novel pathway for arginine. Biochem. Biophys. Res. Commun. 2014;446:8–14. doi: 10.1016/j.bbrc.2014.01.117. [DOI] [PubMed] [Google Scholar]
- 37.Ulitsky I., Shkumatava A., Jan C.H., Sive H., Bartel D.P. Conserved function of lincRNAs in vertebrate embryonic development despite rapid sequence evolution. Cell. 2011;147:1537–1550. doi: 10.1016/j.cell.2011.11.055. [DOI] [PMC free article] [PubMed] [Google Scholar]
- 38.Dai J., Ma J., Yu B., Zhu Z., Hu Y. [ARTICLE WITHDRAWN] Long Noncoding RNA TUNAR Represses Growth, Migration, and Invasion of Human Glioma Cells Through Regulating miR-200a and Rac1. Oncol. Res. 2018;27:107–115. doi: 10.3727/096504018X15205622257163. [DOI] [PMC free article] [PubMed] [Google Scholar]
- 39.Li H., Zhu L., Xu L., Qin K., Liu C., Yu Y., Su D., Wu K., Sheng Y. Long noncoding RNA linc00617 exhibits oncogenic activity in breast cancer. Mol. Carcinog. 2017;56:3–17. doi: 10.1002/mc.22338. [DOI] [PubMed] [Google Scholar]
- 40.Makarewich C.A. The hidden world of membrane microproteins. Exp. Cell Res. 2020;388:111853. doi: 10.1016/j.yexcr.2020.111853. [DOI] [PMC free article] [PubMed] [Google Scholar]
- 41.Bertram R., Sherman A. Filtering of calcium transients by the endoplasmic reticulum in pancreatic beta-cells. Biophys. J. 2004;87:3775–3785. doi: 10.1529/biophysj.104.050955. [DOI] [PMC free article] [PubMed] [Google Scholar]
- 42.Misquitta C.M., Mack D.P., Grover A.K. Sarco/endoplasmic reticulum Ca2+ (SERCA)-pumps: link to heart beats and calcium waves. Cell Calcium. 1999;25:277–290. doi: 10.1054/ceca.1999.0032. [DOI] [PubMed] [Google Scholar]
- 43.Klionsky D.J., Abdelmohsen K., Abe A., Abedin M.J., Abeliovich H., Acevedo Arozena A., Adachi H., Adams C.M., Adams P.D., Adeli K., et al. Guidelines for the use and interpretation of assays for monitoring autophagy (3rd edition) Autophagy. 2016;12:1–222. doi: 10.1080/15548627.2015.1100356. [DOI] [PMC free article] [PubMed] [Google Scholar]
- 44.Arredouani A., Guiot Y., Jonas J.C., Liu L.H., Nenquin M., Pertusa J.A., Rahier J., Rolland J.F., Shull G.E., Stevens M., et al. SERCA3 ablation does not impair insulin secretion but suggests distinct roles of different sarcoendoplasmic reticulum Ca(2+) pumps for Ca(2+) homeostasis in pancreatic beta-cells. Diabetes. 2002;51:3245–3253. doi: 10.2337/diabetes.51.11.3245. [DOI] [PubMed] [Google Scholar]
- 45.Ravier M.A., Daro D., Roma L.P., Jonas J.C., Cheng-Xue R., Schuit F.C., Gilon P. Mechanisms of control of the free Ca2+ concentration in the endoplasmic reticulum of mouse pancreatic β-cells: interplay with cell metabolism and [Ca2+]c and role of SERCA2b and SERCA3. Diabetes. 2011;60:2533–2545. doi: 10.2337/db10-1543. [DOI] [PMC free article] [PubMed] [Google Scholar]
- 46.Zarain-Herzberg A., García-Rivas G., Estrada-Avilés R. Regulation of SERCA pumps expression in diabetes. Cell Calcium. 2014;56:302–310. doi: 10.1016/j.ceca.2014.09.005. [DOI] [PubMed] [Google Scholar]
- 47.Bolger A.M., Lohse M., Usadel B. Trimmomatic: a flexible trimmer for Illumina sequence data. Bioinformatics. 2014;30:2114–2120. doi: 10.1093/bioinformatics/btu170. [DOI] [PMC free article] [PubMed] [Google Scholar]
- 48.Patro R., Duggal G., Love M.I., Irizarry R.A., Kingsford C. Salmon provides fast and bias-aware quantification of transcript expression. Nat. Methods. 2017;14:417–419. doi: 10.1038/nmeth.4197. [DOI] [PMC free article] [PubMed] [Google Scholar]
- 49.Soneson C., Love M.I., Robinson M.D. Differential analyses for RNA-seq: transcript-level estimates improve gene-level inferences. F1000Res. 2015;4:1521. doi: 10.12688/f1000research.7563.1. [DOI] [PMC free article] [PubMed] [Google Scholar]
- 50.Gentleman R.C., Carey V.J., Bates D.M., Bolstad B., Dettling M., Dudoit S., Ellis B., Gautier L., Ge Y., Gentry J., et al. Bioconductor: open software development for computational biology and bioinformatics. Genome Biol. 2004;5:R80. doi: 10.1186/gb-2004-5-10-r80. [DOI] [PMC free article] [PubMed] [Google Scholar]
- 51.Hohmeier H.E., Mulder H., Chen G., Henkel-Rieger R., Prentki M., Newgard C.B. Isolation of INS-1-derived cell lines with robust ATP-sensitive K+ channel-dependent and -independent glucose-stimulated insulin secretion. Diabetes. 2000;49:424–430. doi: 10.2337/diabetes.49.3.424. [DOI] [PubMed] [Google Scholar]
- 52.Beigi F., Gonzalez D.R., Minhas K.M., Sun Q.A., Foster M.W., Khan S.A., Treuer A.V., Dulce R.A., Harrison R.W., Saraiva R.M., et al. Dynamic denitrosylation via S-nitrosoglutathione reductase regulates cardiovascular function. Proc. Natl. Acad. Sci. USA. 2012;109:4314–4319. doi: 10.1073/pnas.1113319109. [DOI] [PMC free article] [PubMed] [Google Scholar]
- 53.de Juan-Sanz J., Holt G.T., Schreiter E.R., de Juan F., Kim D.S., Ryan T.A. Axonal Endoplasmic Reticulum Ca2+ Content Controls Release Probability in CNS Nerve Terminals. Neuron. 2017;93:867–881.e6. doi: 10.1016/j.neuron.2017.01.010. [DOI] [PMC free article] [PubMed] [Google Scholar]
- 54.Yang L., Calay E.S., Fan J., Arduini A., Kunz R.C., Gygi S.P., Yalcin A., Fu S., Hotamisligil G.S. METABOLISM. S-Nitrosylation links obesity-associated inflammation to endoplasmic reticulum dysfunction. Science. 2015;349:500–506. doi: 10.1126/science.aaa0079. [DOI] [PMC free article] [PubMed] [Google Scholar]
- 55.Nagendran M., Riordan D.P., Harbury P.B., Desai T.J. Automated cell-type classification in intact tissues by single-cell molecular profiling. eLife. 2018;7:e30510. doi: 10.7554/eLife.30510. [DOI] [PMC free article] [PubMed] [Google Scholar]
- 56.Stephens S.B., Schisler J.C., Hohmeier H.E., An J., Sun A.Y., Pitt G.S., Newgard C.B. A VGF-derived peptide attenuates development of type 2 diabetes via enhancement of islet β-cell survival and function. Cell Metab. 2012;16:33–43. doi: 10.1016/j.cmet.2012.05.011. [DOI] [PMC free article] [PubMed] [Google Scholar]
Associated Data
This section collects any data citations, data availability statements, or supplementary materials included in this article.