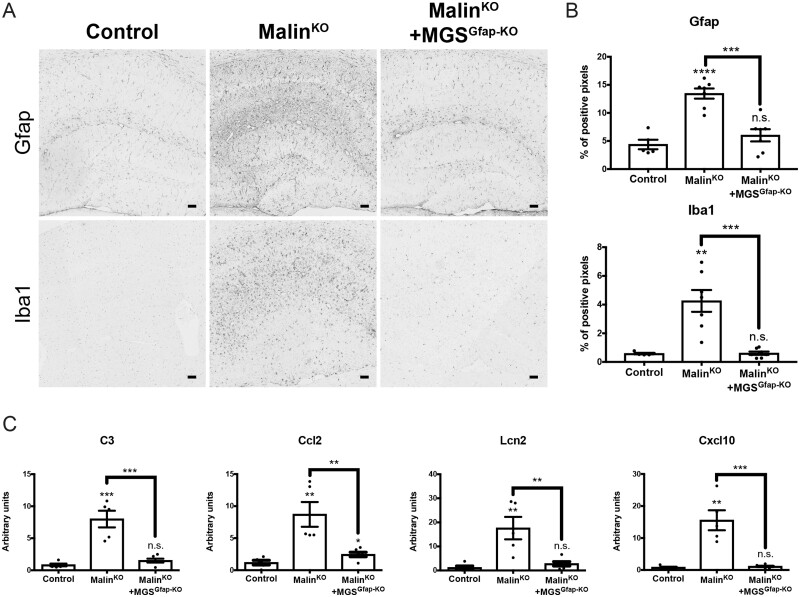
Figure 4.
Analysis of brain damage in malinKO+MGSGfap-KO mice. Neuroinflammation markers are increased in the brains of old malinKO mice but normalized in malinKO+MGSGfap-KO mice. (A) GFAP and Iba1 immunostainings of hippocampi from the different groups. (B) Quantification of hippocampal area of the immunostainings. Data are expressed as mean ± SEM of percentage of positive pixels [control (n = 5), malinKO (n = 7), malinKO+MGSGfap-KO (n = 7)]. (C) Quantitative PCR analysis of genes involved in the inflammatory response. Data are expressed as mean ± SEM of 2ΔΔCt in relative units for each genotype analysed [control (n = 5), malinKO (n = 5), malinKO+MGSGfap-KO (n = 6)]. **P < 0.01; ***P < 0.001; ****P < 0.0001; n.s. = non-significant.

