Abstract
Background
Circular RNAs (circRNAs) are a novel family of endogenous RNAs. Recent studies have demonstrated that circRNAs are potential novel biomarkers for diagnosing cancers. However, little is known about the role of circRNAs in gastric cancer (GC). This study aimed to identify the relationship between GC and a new circRNA named hsa_circ_001888.
Methods
Hsa_circ_001888 expression levels were measured by quantitative reverse transcription‐polymerase chain reaction (qRT‐PCR) in GC cell lines, tissues, and plasma samples. Then, the associations between the expression level of hsa_circ_001888 and the clinicopathological features of patients with GC were further investigated. A receiver operating characteristic (ROC) curve was generated to evaluate the diagnostic value of hsa_circ_001888.
Results
In this study, hsa_circ_001888 was first found to be significantly downregulated in GC cell lines (AGS and MKN‐45), tissues, and plasma samples compared to control samples. Clinicopathological features showed that the expression of hsa_circ_001888 in GC tissues was associated with differentiation and in GC plasma linked with serum CEA and CA19‐9 levels. The areas under the ROC curves of hsa_circ_001888 in tissues and plasma were 0.654 and 0.66, respectively.
Conclusions
Hsa_circ_001888 may serve as a potential biomarker in the diagnosis of GC and may be involved in GC development.
Keywords: biomarker, circular RNA, diagnosis, gastric cancer, hsa_circ_001888
This study aimed to identify the relationship between gastric cancer (GC) and a new circRNA named hsa_circ_001888. The results indicated that hsa_circ_001888 was significantly downregulated in GC cell lines, tissues and plasma samples compared to control samples. Hsa_circ_001888 may serve as a potential biomarker in the diagnosis of GC with high degrees of specificity, sensitivity and accuracy.
1. INTRODUCTION
Gastric cancer (GC) remains one of the most common gastrointestinal malignancies worldwide, with a high mortality rate and a poor survival rate.1, 2 It is the fourth most common cancer, the third leading cause of cancer‐related death worldwide, and the most frequently diagnosed gastrointestinal cancer among East Asian populations.1 Due to the lack of characteristic clinical symptoms and reliable biomarkers, most patients with GC are not diagnosed early in the course of the disease. Although the various diagnostics and treatments have been improved, the 5‐year survival rate of GC remains low since it is often diagnosed at a late stage.3 Therefore, exploring a novel type of ideal cancer biomarker may help to improve the early diagnosis of GC.
Circular RNAs (circRNAs) are a novel family of endogenous RNAs with characteristics such as diversity, abundance, conservation and stability.4, 5 Unlike linear RNAs, circRNAs form covalently closed‐loop structures without 5′ end caps or 3′ polyadenylated tails.5, 6 Recent studies demonstrated that circRNAs have several critical functions in the pathogenesis of human disease and can be potential novel biomarkers in diagnosing cancers. Increasing evidence has shown that circRNAs are associated with a wide variety of cancers, such as colorectal cancer, laryngeal cancer and breast cancer, among other cancers.7 However, the role and function of circRNAs in GC remains largely vague.8, 9
This study aimed to identify the association between GC and a new circRNA named hsa_circ_001888 (Alians, hsa_circ_0001228; http://circbase.org/). Its gene is located at chr22: 37868480‐37870715, and its associated gene symbol is MFNG (O‐fucosylpeptide‐3‐beta‐N‐acetylglucosaminyltransferase). Its spliced sequence length is 2235nt (Figure 1). In this study, we first verified that hsa_circ_001888 expression levels were significantly different in GC cell lines, GC tissues, and GC plasma samples. Then, the relationship between hsa_circ_001888 expression levels and the patient clinicopathological factors was further investigated. Our data indicated that hsa_circ_001888 may serve as a novel potential biomarker in the diagnosis of GC.
FIGURE 1.
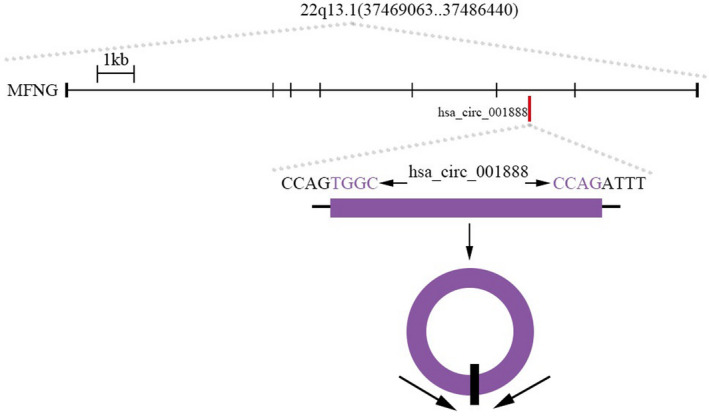
The genomic loci of the MFNG gene and hsa_circ_001888
2. MATERIALS AND METHODS
2.1. Patients and sample collection
GC tissues and paired adjacent normal tissues were obtained from 114 surgical patients between April 2014 and December 2017 at Ningbo First Hospital, China. The tissue samples were soaked immediately in RNA‐fixer Reagent (Bioteke, Beijing, China) after surgical removal from patients’ bodies and were stored at −80°C until analysis. Paired adjacent normal tissues were taken 5 cm from the cancer edge of GC and contained no obvious tumor cells, as assessed by two professional pathologists. No radiotherapy or chemotherapy was given to these patients before surgery. A total of 48 patients’ plasma samples were collected from peripheral veins before any treatment was applied. Based on age‐ and gender‐matching standards, 48 healthy people at Ningbo First Hospital, China, also had fresh plasma samples collected. All blood samples were treated with ethylenediaminetetraacetic acid (EDTA) as the anticoagulant and stored at −80°C until analysis as previously described.
Tumors were staged according to the Tumor‐Node‐Metastasis (TNM) staging system of the International Union Against Cancer. Histological grade was assessed according to the National Comprehensive Cancer Network (NCCN) Clinical Practice Guideline of Oncology (V.1.2011).
The Human Research Ethics Committee from Ningbo First Hospital approved all aspects of this study. All participants voluntarily joined this research with written informed consent before clinical trial in the study.
2.2. Cell culture
Normal human gastric mucosa epithelial cell lines (GES‐1) and human GC cell line AGS were purchased from the Shanghai Institute of Biochemistry and Cell Biology, Chinese Academy of Science (Shanghai, China). Another GC line MKN‐45 was purchased from the National Collection of Authenticated Cell Cultures. All cells were cultured in RPMI‐1640 medium (Life Technologies, Grand Island, USA) supplemented with 10% fetal bovine serum (Biochannel, Hangzhou, China) and cultured at 37°C in a humidified atmosphere with 5% CO2.
2.3. Total RNA extraction
The total RNA of the tissue samples and the cell samples was extracted by TRIzol reagent (Promega, USA) according to the manufacturer's protocol, whereas total RNA in plasma was extracted by TRIzol LS reagent (Promega). Then, the concentration and purity of total RNA were detected by a NanoDrop ND‐2000 spectrophotometer (Thermo Fisher Scientific, Wilmington, DE). Finally, RNA was stored at −80°C until analysis.
2.4. Reverse transcription
Total RNA samples were reverse‐transcribed into cDNA with random primers using the GoScript Reverse transcription system (Promega, Madison, USA) according to manufacturer‐provided protocols. The conditions of RNA reverse transcription were as follows: incubation at 25°C for 5 min, 42°C for 1 h, 70°C for 15 min and at 4°C for forever.
2.5. Polymerase chain reaction
Real‐time quantitative reverse transcription‐polymerase chain reaction (qRT‐PCR) was performed using GoTaqTM 2‐step RT‐qPCR System (Promega) on the StepOnePlus QPCR Detection System (Life Technologies) following the manufacturer's instructions. Glyceraldehyde‐3‐phosphate dehydrogenase (GADPH) mRNA was used to normalize the levels of the circRNA. The sequences of hsa_circ_001888 divergent primers were as follows: Forward: 5′‐ TCCAGTGGCTCCCGTTTC‐3′ and Reverse: 5′‐ CGCCCAGCTTGCACTCA‐3′. The primers were synthesized by BGI Genomics (Guangdong, China). The reaction conditions were as follows: 95°C for 5 min for a not start, followed by 40 cycles at 95°C for 15 s, 60°C for 30 s and 72°C for 30 s. The Cq values were recorded for both hsa_circ_001888 and GADPH.
All reactions were performed in triplicate. The appearance of a single‐peak in the melt‐curve suggested the specificity of the PCR products. Relative quantification of gene expression was analyzed using ΔCq method. All results are expressed as the mean ± SD.
2.6. Statistical analysis
Statistical analysis was performed with the Statistical Product and Service Solutions software 21.0 (SPSS, Chicago, IL, USA) and GraphPad Prism (GraphPad Software, La Jolla, CA, USA). The student t test and one‐way analysis of variance (ANOVA) were used to evaluate the differences between groups as appropriate. A receiver operating characteristic (ROC) curve was constructed to evaluate the diagnostic value of hsa_circ_001888. p‐values <0.05 were considered statistically significant.
3. RESULTS
3.1. Expression of hsa_circ_001888 in GC cell lines and tissues
In this study, we first concluded that the sequence was completely consistent with that in CircBase. Then, we found that the expression levels of hsa_circ_001888 in human GC lines, AGS and MKN‐45, were reduced than the levels in the GES‐1 (Figure 2).
FIGURE 2.
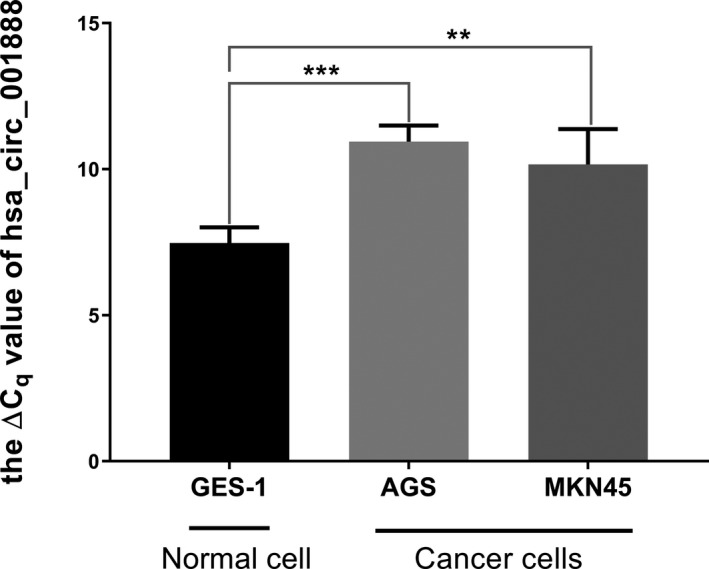
The relative expression of hsa_circ_001888 in gastric cancer cell lines. Hsa_circ_001888 expression levels in two human gastric cancer lines (AGS and MKN‐45) and normal gastric mucosa epithelial cell line (GES‐1) were determined by qRT‐PCR. Data are expressed as mean ± SD of three independent experiments. ** means p < 0.01, *** means p < 0.001
Furthermore, we explored hsa_circ_001888 expression levels in GC tissues and plasma samples of patients with GC. Similar to the results in the cell lines, our data suggested that hsa_circ_001888 was significantly decreased in GC tissues (p < 0.001, Figure 3). Its expression levels were significantly downregulated in 70.18% (80/114) GC tissues compared with the adjacent normal tissues. Moreover, hsa_circ_001888 levels in plasma samples of patients with GC were lower than those in healthy controls (p < 0.001, Figure 4). Its expression levels were significantly downregulated in 68.75% (33/48) GC plasma samples compared with healthy controls. The evidence suggested that hsa_circ_001888 was downregulated in either GC tissues or GC plasma samples compared to the control groups and may have the potential to be a biomarker for GC.
FIGURE 3.
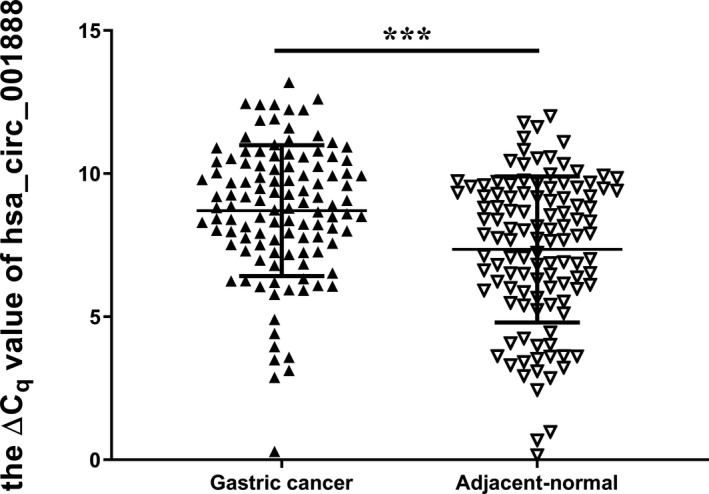
The expression levels of hsa_circ_001888 in gastric cancer tissues and adjacent normal tissues. Hsa_circ_001888 and GAPDH expression levels were detected by qRT‐PCR. The ΔCq method was used to analyze the relative expression of hsa_circ_001888. Data are expressed as mean ± SD of three independent experiments. n = 114, *** means p < 0.001
FIGURE 4.
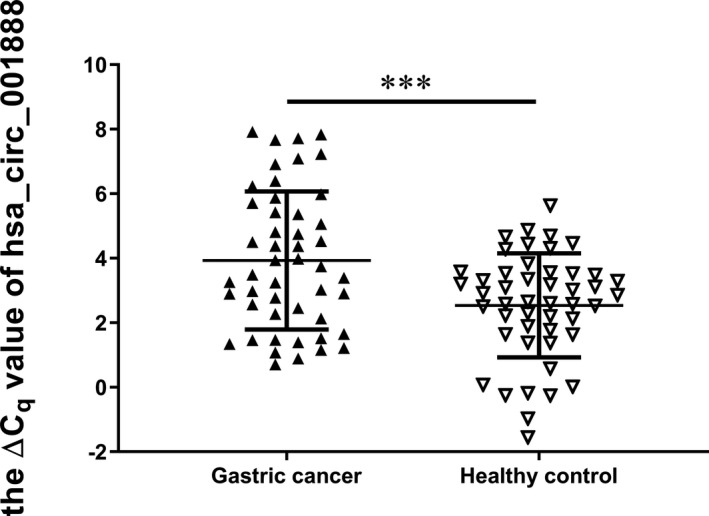
The expression levels of hsa_circ_001888 in gastric cancer plasma samples and healthy controls. Hsa_circ_001888 and GAPDH expression levels were detected by qRT‐PCR. Data are expressed as mean ± SD of three independent experiments. n = 48, *** means p < 0.001)
3.2. Relationships between hsa_circ_001888 expression levels and clinicopathological factors
Based on the above findings, we next analyzed the correlation between hsa_circ_001888 expression levels and the clinicopathological factors in patients with GC.
As shown in Table 1, the hsa_circ_001888 level in GC tissues was correlated with differentiation (p = 0.027). However, no association was found between its levels with other clinicopathological features, such as age, gender, invasion, carcinoembryonic antigen (CEA), carbohydrate antigen 19‐9 (CA19‐9) and lymphatic metastasis.
TABLE 1.
The relationship of hsa_circ_001888 expression levels (ΔCq) in gastric cancer tissues with clinicopathological factors of patients with gastric cancer
| Factors | No. of patients (%) | Mean ± SD | p value |
|---|---|---|---|
| Age (y) | |||
| <60 | 27 (23.68) | 7.86 ± 2.89 | 0.072 |
| ≥60 | 87 (76.32) | 8.97 ± 2.01 | |
| Gender | |||
| Male | 82 (71.93) | 8.76 ± 2.43 | 0.687 |
| Female | 32 (28.07) | 8.57 ± 1.91 | |
| Diameter (cm) | |||
| ≥5 | 47 (41.23) | 8.41 ± 2.18 | 0.250 |
| <5 | 67 (58.77) | 8.91 ± 2.35 | |
| Differentiation | |||
| Well + moderate | 20 (0.18) | 9.72 ± 1.59 | 0.027 * |
| Poor + undifferentiation | 94 (0.82) | 8.49 ± 2.36 | |
| TNM Stage | |||
| 0&Ⅰ&Ⅱ | 21 (0.18) | 9.04 ± 2.46 | 0.463 |
| Ⅲ&Ⅳ | 93 (0.82) | 8.63 ± 2.25 | |
| Invasion | |||
| Tis&T1 | 6 (0.06) | 8.03 ± 2.11 | 0.458 |
| T2&T3&T4 | 108 (0.94) | 8.75 ± 2.30 | |
| Lymphatic metastasis | |||
| N0 | 19 (0.17) | 9.08 ± 2.46 | 0.434 |
| N1&N2&N3 | 95 (0.83) | 8.63 ± 2.26 | |
| Distal metastasis | |||
| M0 | 105 (0.92) | 8.68 ± 2.28 | 0.721 |
| M1 | 9 (0.08) | 8.97 ± 2.47 | |
| Venous invasion | |||
| Absent | 38 (0.33) | 8.91 ± 2.15 | 0.512 |
| Present | 76 (0.67) | 8.61 ± 2.36 | |
| Perineural invasion | |||
| Absent | 49 (0.43) | 8.92 ± 2.36 | 0.394 |
| Present | 65 (0.57) | 8.55 ± 2.23 | |
| CEA | |||
| Positive | 31 (0.27) | 8.52 ± 2.08 | 0.600 |
| Negative | 83 (0.73) | 8.78 ± 2.37 | |
| CA19‐9 | |||
| Positive | 24 (0.21) | 8.79 ± 1.39 | 0.797 |
| Negative | 90 (0.79) | 8.69 ± 2.48 | |
Bold indicates statistical significant value (p < 0.05).
As shown in Table 2, its expression level in GC plasma was linked with CEA (p < 0.001) and CA19‐9 (p = 0.036) expression. These results indicated that GC patients with positive CEA and CA19‐9 expression in plasma may have higher hsa_circ_001888 levels.
TABLE 2.
The relationship of hsa_circ_001888 expression levels (ΔCq) in plasma from patients with gastric cancer and clinicopathological factors of patients with gastric cancer
| Factors | No. of patients (%) | Mean ± SD | p value |
|---|---|---|---|
| Age (y) | |||
| <60 | 14 (0.29) | 4.32 ± 2.26 | 0.424 |
| ≥60 | 34 (0.71) | 3.77 ± 2.11 | |
| Gender | |||
| Male | 26 (0.54) | 3.91 ± 2.49 | 0.952 |
| Female | 22 (0.46) | 3.95 ± 1.71 | |
| Diameter (cm) | |||
| ≥5 | 21 (0.43) | 4.33 ± 2.06 | 0.259 |
| <5 | 27 (0.56) | 3.62 ± 2.19 | |
| Differentiation | |||
| Well + moderate | 15 (0.31) | 4.47 ± 2.02 | 0.241 |
| Poor + undifferentiation | 33 (0.69) | 3.68 ± 2.18 | |
| TNM Stage | |||
| 0&Ⅰ&Ⅱ | 23 (0.48) | 3.53 ± 2.10 | 0.213 |
| Ⅲ&Ⅳ | 25 (0.52) | 4.30 ± 2.16 | |
| Invasion | |||
| Tis&T1 | 10 (0.21) | 3.35 ± 2.26 | 0.339 |
| T2&T3&T4 | 38 (0.79) | 4.0 ± 2.12 | |
| Lymphatic metastasis | |||
| N0 | 19 (0.40) | 3.68 ± 2.17 | 0.514 |
| N1&N2&N3 | 29 (0.60) | 4.10 ± 2.15 | |
| Distal metastasis | |||
| M0 | 47 (0.98) | 3.85 ± 2.09 | 0.065 |
| M1 | 1 (0.02) | 7.83 | |
| Venous invasion | |||
| Absent | 23 (0.48) | 3.62 ± 1.96 | 0.346 |
| Present | 25 (0.52) | 4.21 ± 2.30 | |
| Perineural invasion | |||
| Absent | 29 (0.60) | 3.75 ± 2.11 | 0.479 |
| Present | 19 (0.40) | 4.20 ± 2.22 | |
| CEA | |||
| Positive | 39 (0.81) | 3.38 ± 1.89 | <0.001 * |
| Negative | 9 (0.19) | 6.30 ± 1.50 | |
| CA19‐9 | |||
| Positive | 43 (0.90) | 3.71 ± 2.08 | 0.036 * |
| Negative | 5 (0.10) | 5.82 ± 1.82 | |
Bold indicates statistical significant value (p < 0.05).
3.3. ROC curve of hsa_circ_001888 level
A ROC curve was established to explore the diagnostic values of hsa_circ_001888 (Figure 5). The area under the ROC curve (AUC) in GC tissues was 0.654. When the cut‐off value was 7.15, the specificity and sensitivity were 80.70% and 44.74%, respectively. The false‐negative rate and false‐positive rate were 55.26% and 19.30%, respectively.
FIGURE 5.
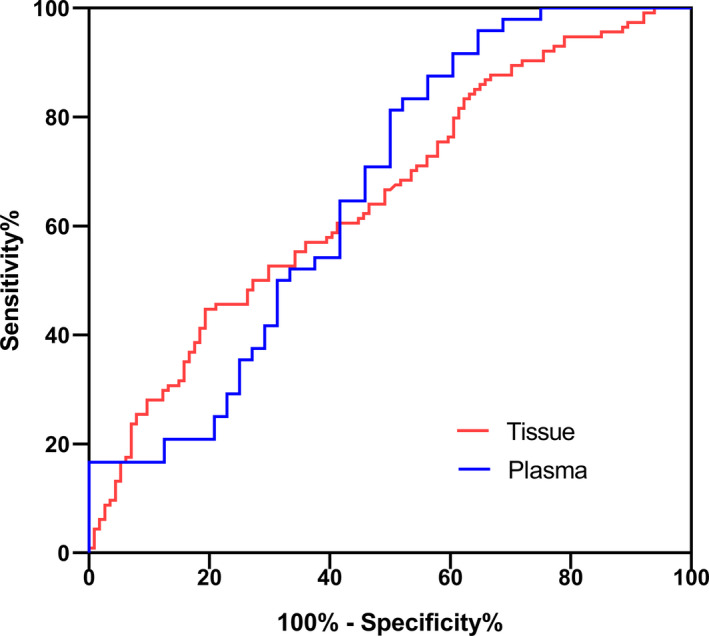
ROC curve of hsa_circ_001888
The AUC of hsa_circ_001888 in plasma was up to 0.66. When the cut‐off value was 3.67, the specificity and sensitivity were 50.0% and 81.25%, respectively. The false‐negative rate and false‐positive rate were 18.75% and 50.0%, respectively.
4. DISCUSSION
CircRNAs are a novel family of endogenous RNAs characterized by a covalently closed‐loop structure. CircRNAs were first observed in RNA viruses as early as the 1970s. They were thought to be the by‐products of splicing errors at that time.10, 11 With the development of high‐throughput RNA sequencing technologies and bioinformatics methods, circRNAs were found to be extensively expressed in human cells and closely involved in the regulation of gene expression.12
Based on different originating mechanisms, circRNAs can be divided into three types: exonic circRNAs (ecircRNAs), circular intronic RNAs (ciRNAs) and extron‐intron circRNAs (eiciRNAs). Each type of circRNA can regulate gene expression. The formation of circRNAs involves the occurrence of direct back splicing or exon skipping.4, 13 CircRNAs have the significant properties that they are highly conserved and have a remarkably stable half‐life >48 h.4, 14 Therefore, circRNAs are regarded as useful biomarkers in diagnosing diseases.
Recent studies found that circRNAs containing miRNA response elements (MREs) can work as miRNA sponges.14, 15 For example, CiRS‐7 containing 74 miR‐7 binding sites can act as a miR‐7 sponge with high miRNA‐binding capacity and can participate in post‐transcriptional regulation.5 MiR‐7 plays a key role in Parkinson's disease, which indicates the potential role of CiRS‐7 in the progression of Parkinson's disease.16 As a super miRNA sponge, CiRS‐7 can act as an oncogene, promote tumor progression in various types of cancers, including GC.17, 18 Some circRNAs have the potential to be translated into proteins or peptides due to the presence of internal ribosomal entry sites (IRES) and open reading frames (ORFs).19 CircRNAs with protein translation functions may act as a novel type of protein‐coding RNA. Some circRNAs can interact with RNA‐binding proteins (RBPs) and regulated them during human epithelial‐mesenchymal transition (EMT).20 EMT is a critical cellular process in cancer metastasis and invasion.21
The function of circRNA in the diagnosis of GC also has been reported in recent years. Li et al.22 demonstrated the downregulation of hsa_circ_0001017 and hsa_circ_0061276 in GC tissues and plasma by RT‐droplet digital PCR (ddPCR). Zhang et al.23 reported that hsa_circ_0023642 was upregulated in GC and correlated with malignant progression of GC by acting as a miR‐223 sponge. Zhang et al.24 reported that circLARP4 can facilitate the expression of miR‐424‐5p target LATS1 and YAP by acting as a sponge of miR‐424‐5p. Another research displayed that hsa_circ_001649 restrained GC by sponging miR‐20a and then inactivated Wnt/β‐catenin and ERK pathways.25 CiRS‐7 was also reported to be significantly upregulated in GC tissues and linked to poor survival.18 CiRS‐7 can serve as a sponge of miR‐7, then decrease the expression of miR‐7‐mediated PTEN, increase the level of PI3K, AKT phosphorylation.18 Li et al.26 showed a downregulated circRNA in GC, Circ_104916, can inhibit cell proliferation, migration and invasion by decreasing the expression of Slug. The upregulation of E‐cadherin and downregulation of N‐cadherin, Slug, and Vimentin by western blot after Circ_104916 over‐expression, indicates the relationship of Circ_104916 in EMT.26
Although an increasing number of circRNAs have been identified and their potential functions have been researched, their diagnostic value remains largely unknown. In this study, hsa_circ_001888 was chosen as a targeted circRNA in GC because it is one of the circRNAs that may be associated with GC according to the bioinformatics analysis in the CircBase database. The results showed that hsa_circ_001888 were downregulated in two GC cell lines compared with GES‐1. These results are consistent with the bioinformatics analysis results. Then, we first explore hsa_circ_001888 expression levels in the tissues and plasma samples from various stages of gastric carcinogenesis. We explored hsa_circ_001888 was downregulated in GC tissues as well as in the plasma of patients with GC. Furthermore, we found the potential diagnostic value of hsa_circ_001888 in GC.
Differentiation is a crucial factor in the evaluation of the prognosis of GC.27 The results of the association between hsa_circ_001888 expression level and clinicopathological data showed that the expression of hsa_circ_001888 was more downregulated in poorly differentiated and undifferentiated tumors than in well‐differentiated ones (p = 0.011). The results indicated a close relationship between low expression levels of hsa_circ_001888 in GC and differentiation. However, further research will need to investigate the detailed molecular mechanisms of hsa_circ_001888 involved in GC progression. We next estimated the diagnostic value of hsa_circ_001888 in GC. By using ROC curve analysis, we found that in tissues, the AUC was 0.654; the specificity and sensitivity were 80.70% and 44.74%, respectively.
CEA and CA19‐9 are the most common and widely used plasma‐based biomarkers in the screening process for GC and other tumors in clinics. A study found that CEA and CA19‐9 positivity were significantly associated with depth of invasion, hepatic metastasis in GC.28 Tissue CEA expression is directly associated with long‐term prognosis.29 However, the positive rate of serum CEA and CA19‐9 in GC screening was low. Our research found that hsa_circ_001888 expression level was significantly associated with serum CEA (p < 0.001) and CA19‐9 expression (p = 0.036) levels. Ye et al.30 reported that hsa_circ_0001874 was downregulated in GC and correlated with the expression of CEA. Hsa_circ_0001895 was also related to CEA expression.31 The results indicate the possible interactive function of circRNA and CEA in GC diagnosing. By using ROC curve analysis, we found that in plasma, the AUC was 0.66; the specificity and sensitivity were 50.0% and 81.25%, respectively. Our data indicate that hsa_circ_001888 is a potential biomarker for GC with high degrees of accuracy.
The limitation of this study is that a relatively small sample size was used. More samples should be analyzed in future. The detailed molecular mechanisms of hsa_circ_001888 still need further research to explore.
In conclusion, our research implied that hsa_circ_001888 expression levels were significantly downregulated not only in GC tissues and cell lines but also in GC plasma samples. The expression of hsa_circ_001888 in GC tissues was associated with tumor cell differentiation. The decreased levels of hsa_circ_001888 in plasma of patients were significantly associated with serum CEA and CA19‐9 levels. Hsa_circ_001888 is a potential biomarker for the diagnosis of GC.
CONFLICTS OF INTEREST
The authors declare that they are no conflicts of interest in this work.
AUTHOR CONTRIBUTIONS
All authors equally contributed to this paper.
ACKNOWLEDGEMENTS
This study was supported by grants from the Zhejiang Medical and Health Project (No. 2021KY983), the Zhejiang Medical and Health Project (No.2019KY578), and the Zhejiang Medical and Health Project (No. 2018ZH025). We thank Xiaojiao Zhen and Peifei Li for their technical expertise. Finally, Peina Shi wants to thank, in particular, the invaluable support received from Zehua He.
Shi P, Song H, Ding X. Reduced expression of circRNA hsa_circ_001888 in gastric cancer and its clinical significance. J Clin Lab Anal. 2021;35:e23953. 10.1002/jcla.23953
DATA AVAILABILITY STATEMENT
The data used to support the findings of this study are available from the corresponding author upon request.
REFERENCES
- 1.Torre LA, Bray F, Siegel RL, Ferlay J, Lortet‐Tieulent J, Jemal A. Global cancer statistics, 2012. CA Cancer J Clin. 2015;65(2):87‐108. [DOI] [PubMed] [Google Scholar]
- 2.Chen W, Zheng R, Baade PD, et al. Cancer statistics in China, 2015. CA Cancer J Clin. 2016;66(2):115‐132. [DOI] [PubMed] [Google Scholar]
- 3.Allemani C, Weir HK, Carreira H, et al. Global surveillance of cancer survival 1995–2009: analysis of individual data for 25,676,887 patients from 279 population‐based registries in 67 countries (CONCORD‐2). Lancet (London, England). 2015;385(9972):977‐1010. [DOI] [PMC free article] [PubMed] [Google Scholar]
- 4.Jeck WR, Sorrentino JA, Wang K, et al. Circular RNAs are abundant, conserved, and associated with ALU repeats. RNA (New York, NY). 2013;19(2):141‐157. [DOI] [PMC free article] [PubMed] [Google Scholar]
- 5.Memczak S, Jens M, Elefsinioti A, et al. Circular RNAs are a large class of animal RNAs with regulatory potency. Nature. 2013;495(7441):333‐338. [DOI] [PubMed] [Google Scholar]
- 6.Salzman J, Gawad C, Wang PL, Lacayo N, Brown PO. Circular RNAs are the predominant transcript isoform from hundreds of human genes in diverse cell types. PLoS ONE. 2012;7(2):e30733. [DOI] [PMC free article] [PubMed] [Google Scholar]
- 7.Lei B, Tian Z, Fan W, Ni B. Circular RNA: a novel biomarker and therapeutic target for human cancers. Int J Med Sci. 2019;16(2):292‐301. [DOI] [PMC free article] [PubMed] [Google Scholar]
- 8.Shi P, Wan J, Song H, Ding X. The emerging role of circular RNAs in gastric cancer. Am J Cancer Res. 2018;8(10):1919‐1932. [PMC free article] [PubMed] [Google Scholar]
- 9.Li P, Chen S, Chen H, et al. Using circular RNA as a novel type of biomarker in the screening of gastric cancer. Clin Chim Acta. 2015;444:132‐136. [DOI] [PubMed] [Google Scholar]
- 10.Hsu MT, Coca‐Prados M. Electron microscopic evidence for the circular form of RNA in the cytoplasm of eukaryotic cells. Nature. 1979;280(5720):339‐340. [DOI] [PubMed] [Google Scholar]
- 11.Cocquerelle C, Mascrez B, Hétuin D, Bailleul B. Mis‐splicing yields circular RNA molecules. FASEB J. 1993;7(1):155‐160. [DOI] [PubMed] [Google Scholar]
- 12.Chen LL. The biogenesis and emerging roles of circular RNAs. Nat Rev Mol Cell Biol. 2016;17(4):205‐211. [DOI] [PubMed] [Google Scholar]
- 13.Ashwal‐Fluss R, Meyer M, Pamudurti NR, et al. circRNA biogenesis competes with pre‐mRNA splicing. Mol Cell. 2014;56(1):55‐66. [DOI] [PubMed] [Google Scholar]
- 14.Hansen TB, Jensen TI, Clausen BH, et al. Natural RNA circles function as efficient microRNA sponges. Nature. 2013;495(7441):384‐388. [DOI] [PubMed] [Google Scholar]
- 15.Zhang Y, Wang M, Zang X, et al. CircHN1 affects cell proliferation and migration in gastric cancer. J Clin Lab Anal. 2020;34(10):e23433. [DOI] [PMC free article] [PubMed] [Google Scholar]
- 16.Junn E, Lee KW, Jeong BS, Chan TW, Im JY, Mouradian MM. Repression of alpha‐synuclein expression and toxicity by microRNA‐7. Proc Natl Acad Sci USA. 2009;106:13052‐13057. [DOI] [PMC free article] [PubMed] [Google Scholar]
- 17.Chen J, Yang J, Fei X, Wang X, Wang K. CircRNA ciRS‐7: a novel oncogene in multiple cancers. Int J Biol Sci. 2021;17(1):379‐389. [DOI] [PMC free article] [PubMed] [Google Scholar]
- 18.Pan H, Li T, Jiang Y, et al. Overexpression of circular RNA ciRS‐7 abrogates the tumor suppressive effect of miR‐7 on gastric cancer via PTEN/PI3K/AKT signaling pathway. J Cell Biochem. 2018;119(1):440‐446. [DOI] [PubMed] [Google Scholar]
- 19.Pamudurti NR, Bartok O, Jens M, et al. Translation of CircRNAs. Mol Cell. 2017;66(1):9‐21.e27. [DOI] [PMC free article] [PubMed] [Google Scholar]
- 20.Conn SJ, Pillman KA, Toubia J, et al. The RNA binding protein quaking regulates formation of circRNAs. Cell. 2015;160(6):1125‐1134. [DOI] [PubMed] [Google Scholar]
- 21.Nieto MA. Epithelial plasticity: a common theme in embryonic and cancer cells. Science (New York, NY). 2013;342(6159):1234850. [DOI] [PubMed] [Google Scholar]
- 22.Li T, Shao Y, Fu L, et al. Plasma circular RNA profiling of patients with gastric cancer and their droplet digital RT‐PCR detection. J Mol Med (Berl). 2018;96(1):85‐96. [DOI] [PubMed] [Google Scholar]
- 23.Zhang Y, Xia L, Wu J, Xu X, Li G. Hsa_circ_0023642 promotes proliferation, invasion, and migration of gastric cancer by sponging microRNA‐223. J Clin Lab Anal. 2020;34(10):e23428. [DOI] [PMC free article] [PubMed] [Google Scholar]
- 24.Zhang J, Liu H, Hou L, et al. Circular RNA_LARP4 inhibits cell proliferation and invasion of gastric cancer by sponging miR‐424‐5p and regulating LATS1 expression. Mol Cancer. 2017;16(1):151. [DOI] [PMC free article] [PubMed] [Google Scholar]
- 25.Sun H, Wang Q, Yuan G, et al. Hsa_circ_0001649 restrains gastric carcinoma growth and metastasis by downregulation of miR‐20a. J Clin Lab Anal. 2020;34(6):e23235. [DOI] [PMC free article] [PubMed] [Google Scholar]
- 26.Li J, Zhen L, Zhang Y, et al. Circ‐104916 is downregulated in gastric cancer and suppresses migration and invasion of gastric cancer cells. OncoTargets and therapy. 2017;10:3521‐3529. [DOI] [PMC free article] [PubMed] [Google Scholar]
- 27.Shen ZL, Song KY, Ye YJ, et al. Significant differences in the clinicopathological characteristics and survival of gastric cancer patients from two cancer centers in china and Korea. J Gastric Cancer. 2015;15(1):19‐28. [DOI] [PMC free article] [PubMed] [Google Scholar]
- 28.Ishigami S, Natsugoe S, Hokita S, et al. Clinical importance of preoperative carcinoembryonic antigen and carbohydrate antigen 19–9 levels in gastric cancer. J Clin Gastroenterol. 2001;32(1):41‐44. [DOI] [PubMed] [Google Scholar]
- 29.Wang W, Seeruttun SR, Fang C, et al. Prognostic significance of carcinoembryonic antigen staining in cancer tissues of gastric cancer patients. Ann Surg Oncol. 2016;23(4):1244‐1251. [DOI] [PubMed] [Google Scholar]
- 30.Ye Q, Qi C, Xi M, Ye G. Circular RNA hsa_circ_0001874 is an indicator for gastric cancer. J Clin Lab Anal. 2021;35(7):e23851. [DOI] [PMC free article] [PubMed] [Google Scholar]
- 31.Shao Y, Chen L, Lu R, et al. Decreased expression of hsa_circ_0001895 in human gastric cancer and its clinical significances. Tumour Biol. 2017;39(4):1010428317699125. [DOI] [PubMed] [Google Scholar]
Associated Data
This section collects any data citations, data availability statements, or supplementary materials included in this article.
Data Availability Statement
The data used to support the findings of this study are available from the corresponding author upon request.


