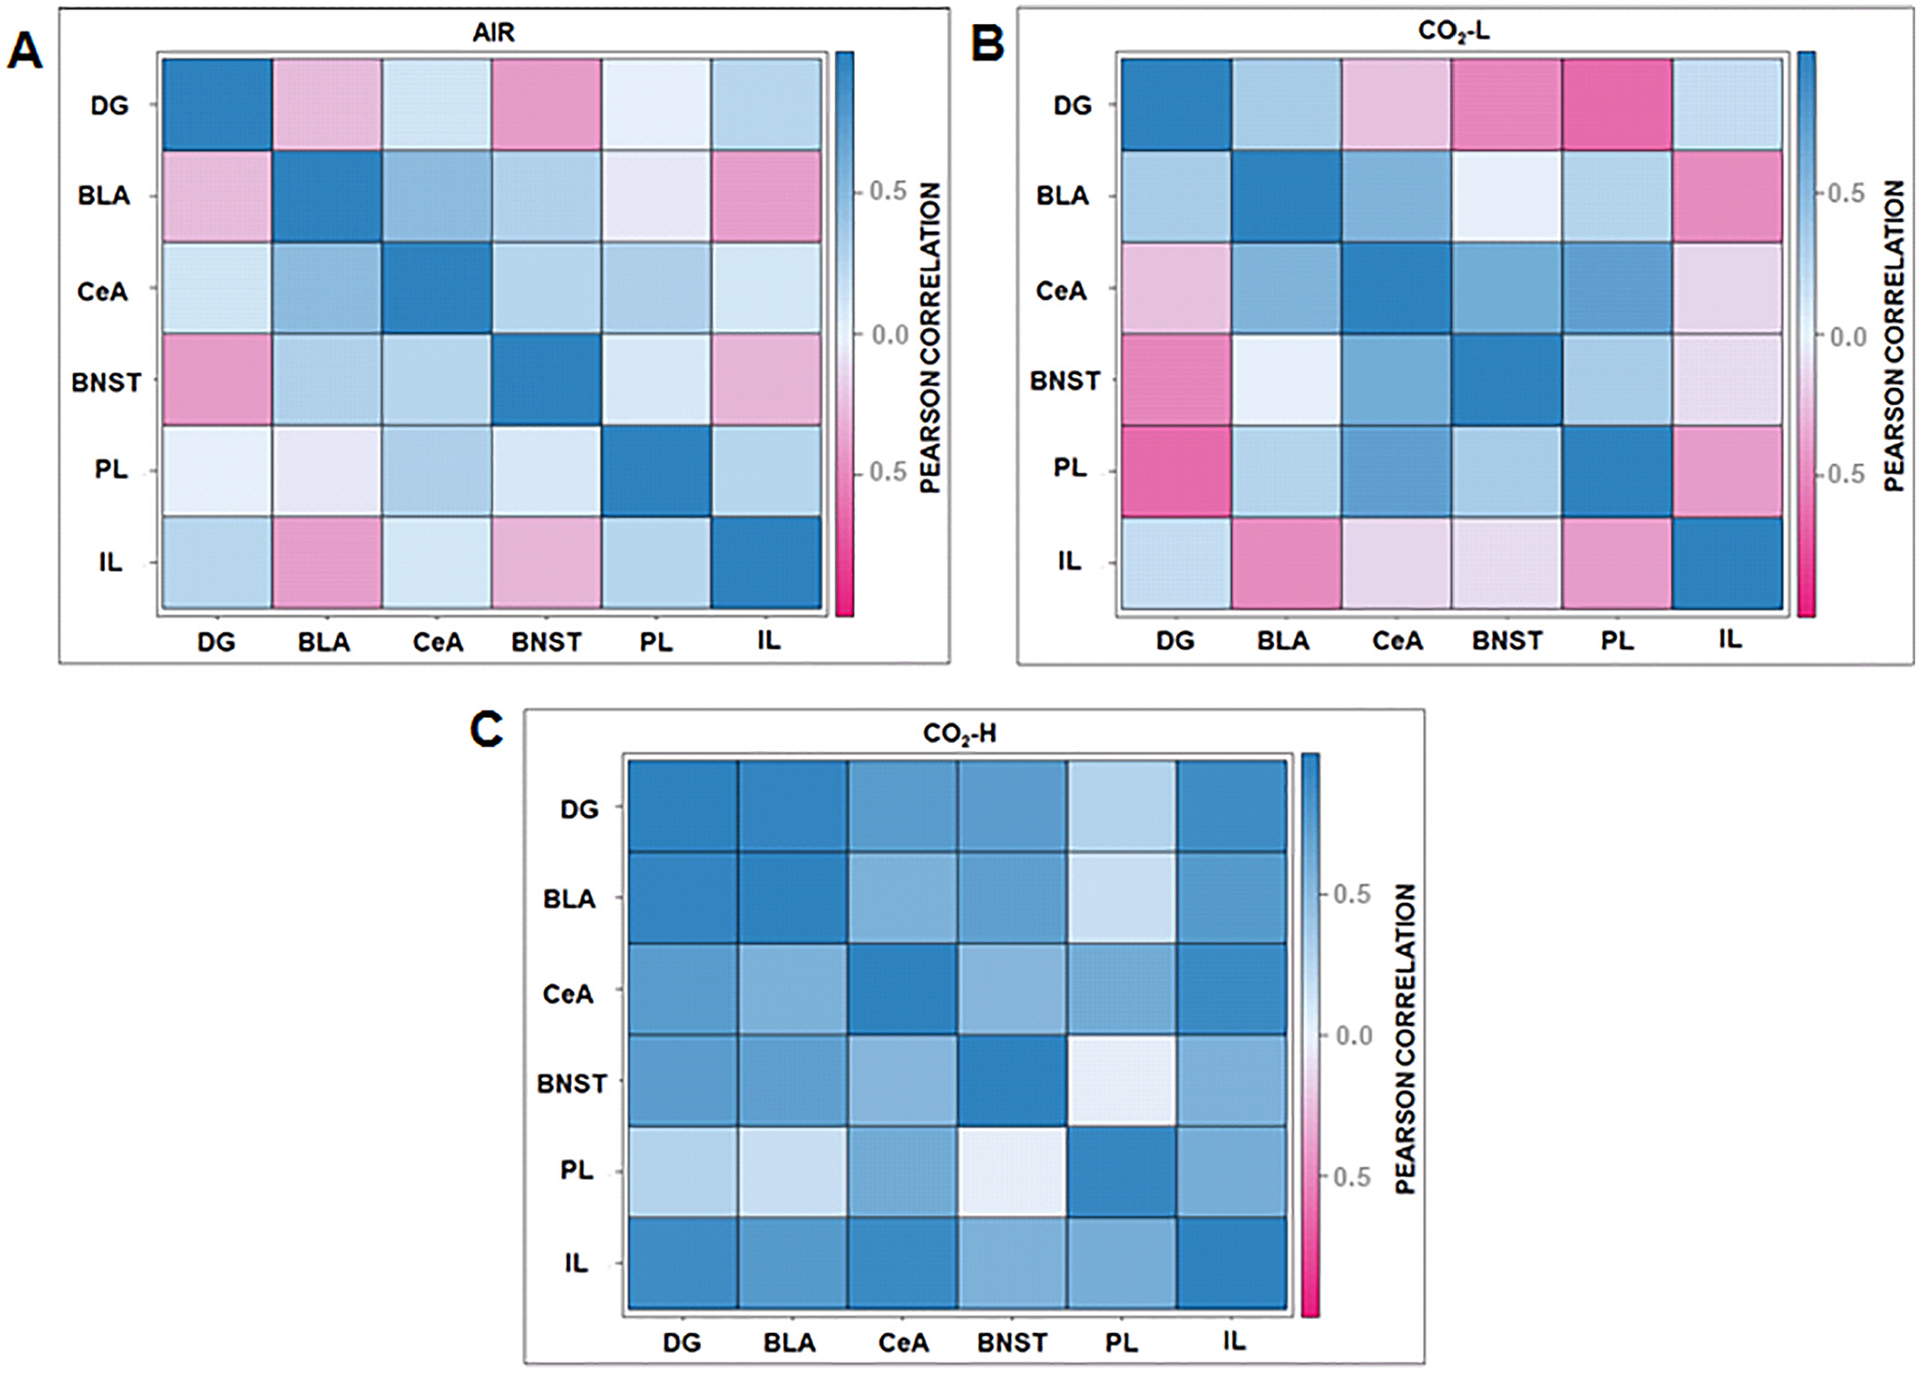
Fig. 7.

ΔFosB interregional correlation matrices reveal differential patterns of co-activation between (A) air, (B) CO2-L and (C) CO2-H. Co-activation patterns of forebrain areas such as the dDG and IL with the CeA, BLA, PL and BNST observed in air and CO2-L mice were disrupted in CO2-H mice. Positive dDG-amygdala and dDG-BNST co-activation patterns that were not observed in the other groups. An inverse co-activation association between IL-PL and IL-BLA was observed in CO2-L mice that was absent in CO2-H group. Dark blue represents strong positive correlations while dark pink represents strong negative correlations. Abbreviations: dDG, dorsal dentate gyrus; BLA, basolateral amygdala, CeA, central nucleus of the amygdala, IL, infralimbic cortex; PL, prelimbic cortex; BNST, bed nucleus of stria terminalis. (N = 6–8/group).
