

Abstract
Introduction
Despite high dementia prevalence in Hispanic populations globally, especially Caribbean Hispanics, no study has comparatively examined the association between education and dementia among Hispanics living in the Caribbean Islands and older adults in the United States.
Methods
We used data on 6107 respondents aged 65 and older in the baseline wave of the population‐based and harmonized 10/66 survey from Cuba, the Dominican Republic, and Puerto Rico, collected between 2003 and 2008, and 11,032 respondents aged 65 and older from the U.S.‐based Health and Retirement Study data in 2014, a total of 17,139 individuals. We estimated multivariable logistic regression models examining the association between education and dementia, adjusted for age, income, assets, and occupation. The models were estimated separately for the Caribbean population (pooled and by setting) and the U.S. population by race/ethnicity (Hispanic, Black, and White), followed by pooled models across all populations
Results
In the Caribbean population, the relative risk of dementia among low versus high educated adults was 1.45 for women (95% confidence interval [CI] 1.17, 1.74) and 1.92 (95% CI 1.35, 2.49) for men, smaller compared to those in the United States, especially among non‐Hispanic Whites (women: 2.78, 95% CI 1.94, 3.61; men: 5.98, 95% CI 4.02, 7.95).
Discussion
The differential associations between education and dementia across the Caribbean and US settings may be explained by greater disparities in social conditions in the United States compared to the Caribbean, such as access to health care, healthy behaviors, and social stressors, which serve as potentially important mediators.
Keywords: Caribbean, dementia, education, Hispanics, international comparison, older adults
1. INTRODUCTION
Dementia is among the leading causes of death and disability worldwide and has emerged as a significant societal issue and a global priority.1, 2 In the United States, dementia prevalence among Hispanics is approximately 50% higher than non‐Hispanic Whites.3, 4, 5 Variation in dementia prevalence exists across Hispanic subgroups: among Latin American Hispanics, those of Caribbean origin (Caribbean Hispanics) have the highest reported risk for dementia,3, 6, 7 with documented dementia prevalence of 10% to 12% among older adults residing in the Caribbean region.8, 9
The socioenvironmental risk factors underlying disparities in dementia between Hispanic and non‐Hispanic populations, and between Caribbean Hispanics and other populations in particular, remain poorly understood.10 Prior studies have attributed dementia disparities between Hispanic and non‐Hispanic populations to inequities in socioeconomic status,11, 12 access to health care,13 stress,14 and education.15 This builds upon a large body of extant literature highlighting the role of socioeconomic status and education in explaining racial disparities in a number of chronic health conditions,16, 17, 18, 19, 20 including cardiovascular disease,21, 22, 23, 24 diabetes,25, 26 and stroke.27, 28, 29, 30 Studies also find biological differences by genetic admixture of European, African, and native American ancestry, including differences in the frequencies of genetic variants that modify risks for Alzheimer's disease (AD), and alterations in inflammatory response and in AD cerebrospinal fluid (CSF) biomarkers.31, 32, 33
Education in particular has long been recognized as an important modifiable risk factor for dementia.34 Growing evidence shows that, as in high‐income countries, education has a protective effect against dementia in low‐ and middle‐income countries including the Caribbean islands.7, 35, 36 However, no study exists that directly compares the relationship between education and dementia among older adults living in the Caribbean islands versus Hispanic and other populations in the United States. Because the protective effect of education toward dementia may be mediated and/or modified by other risk factors, including cultural and environmental factors, this gap in the literature hinders our ability to design and implement culturally appropriate prevention strategies and interventions for reducing health disparities within Hispanic populations.37
In this study, we examined associations between education and dementia among older adults residing on three Caribbean islands with the largest Hispanic populations (Cuba, the Dominican Republic [DR], and Puerto Rico [PR]), and among older adults in the United States across racial/ethnic groups. We also examined the extent to which these education associations could be statistically explained by key mediating variables reflecting later‐life socioeconomic characteristics, including occupation, income, and wealth. We aimed to shed new light on risk factors of dementia burdens among Caribbean populations by explicitly comparing the education–dementia associations between those in the Caribbean islands and Hispanic, non‐Hispanic Black, and non‐Hispanic White populations in the United States.
2. METHODS
2.1. Data and study population
The 10/66 Dementia Research Group38 measured dementia in population‐based household‐level surveys of adults ages 65 and over in 11 low‐ and middle‐income countries and regions, including Cuba, PR, and DR. Harmonized questionnaires and field procedures were used across survey sites. The surveys collected detailed information on cognitive assessments, dementia diagnosis, sociodemographic characteristics, and other health and health‐care use measures. Further details are published elsewhere.39 We used data from the baseline surveys, collected on more than 2000 adults in metro catchment areas of each of the three Caribbean islands between 2003 and 2008. These catchment areas were broadly representative of the island/country metro areas.
RESEARCH IN CONTEXT
Systematic review: Prior research has identified education as an important risk factor for explaining dementia disparities between Hispanic and non‐Hispanic populations. Education is found to have a protective effect against dementia in middle and low‐income countries including the Caribbean. However, no study has compared associations between education and dementia in the Caribbean Islands to those in a high‐income country such as the United States.
Interpretation: We find lower relative risk of dementia between those with low versus high education in the Caribbean, compared to those in the United States, especially US non‐Hispanic Whites. These associations were only partially mediated by later‐life socioeconomic characteristics.
Future directions: Specific socioenvironmental factors that mediate or modify the relationship between education and dementia in both the Caribbean and US contexts need to be further explored.
2.2. Health and Retirement Study
We used US data from the Health and Retirement Study (HRS), a biennial longitudinal panel study that has surveyed a representative sample of approximately 20,000 adults over the age of 50 in the United States since 1992.40 The HRS collects rich data on cognition, demographics, socioeconomic characteristics, and health. At the time of analysis, the 2014 HRS was the most recent and finalized wave of data. We also conducted sensitivity analyses using the 2006 HRS wave, the year closest to the 10/66 data; results (not reported) were not sensitive to the HRS data year used.
2.3. Study population
We included all 10/66 respondents (all respondents in 10/66 were aged 65 and older) in the baseline surveys in Cuba, DR, and PR for whom dementia status, education, sex, and age variables (defined further below) were non‐missing. Our final Caribbean analytic sample included 6107 individuals, with 2929 in Cuba, 1188 in DR, and 1990 in PR. To ensure comparability across samples, we included all HRS respondents in the 2014 wave who were aged 65 and older, had non‐missing dementia status, education, sex, and age variables, and were Hispanic, non‐Hispanic Black (“Black”), or non‐Hispanic White (“White”). We relied on self‐reported race and ethnicity in HRS, and included Hispanics of all origins to increase sample size. About 60% of our Hispanic subsample were of Mexican origin, with the majority of the remaining 40% of Caribbean origin. Our final US analytic sample included 11,032 individuals, with 1153 Hispanic, 1726 Black, and 8153 White. The total study population was 17,139.
2.4. Dementia status
We use the 10/66 dementia diagnosis algorithm, defined as those scoring above a cutoff point of predicted probability of Diagnostic and Statistical Manual of Mental Disorders (DSM)‐IV dementia syndrome from a logistic regression equation with coefficients from the Geriatric Mental State (GMS), Community Screening Instrument for Dementia (CSI‐D), and 10 word list learning task.41 The equation and coefficients were developed in the 10/66 international pilot study,41 and this dementia diagnosis has been subsequently used in an extensive body of literature analyzing dementia in the 10/66 data.7, 33, 38, 39
2.5. Health and Retirement Study
Cognitive status in the HRS was assessed using a modified version of the Telephone Interview for Cognitive Status (TICS‐M). The TICS‐M score ranges from 0 to 27, with higher scores reflecting better cognitive performance, and is comprised of an immediate and delayed 10‐noun free recall test, a serial 7 subtraction test, and a backward count from 20 test. We applied the Langa‐Weir method5, 42 to this continuous score to classify respondents with dementia (TICS‐M score ≤ 6) or otherwise. The Langa‐Weir method was validated in prior work using the Aging, Demographics, and Memory Study (ADAMS),42, 43 a substudy of the HRS that involved 3‐ to 4‐hour in‐home neuropsychological and clinical assessments as well as expert clinician adjudication to obtain a gold standard diagnosis of dementia. The Langa‐Weir method uses an analogous algorithm that relies on proxy responses for respondents who could not answer the survey for themselves.44 Because our primary aim was to compare dementia and its determinants across subgroups defined by education and race/ethnicity, we did not use alternative classification schemes that explicitly incorporate information on education and race/ethnicity in their derivation of cut points for dementia45, 46 across these subgroups. However, we used those alternative measures of dementia in our sensitivity analysis as described further below.
2.6. Education
Educational attainment was measured differently between 10/66 and the HRS, due in part to contextual differences across regions. For 10/66 respondents, we categorized educational attainment as (1) not completing primary school, (2) completed primary school, or (3) secondary school or above. For HRS respondents, we categorized educational attainment as (1) no high school degree, (2) high school degree or equivalent, or (3) some college or above. While we could not use the same education categories between the Caribbean and US settings due to differences in education systems and levels of educational attainment, the current categorizations of education allow us to divide each population (Caribbean or US) into subgroups of comparable size, such that the subgroup in each level of education (low, medium, or high) occupies a similar position between the two settings in terms of relative educational attainment in the population. This approach is consistent with a large body of literature comparing the United States to low‐ and middle‐income countries that have lower average attainment.23, 47, 48, 49
2.7. Covariates
Sex was used as a stratifying variable or included as a covariate. Age and age squared were included as covariates in all models. We also examined three socioeconomic characteristics that may potentially mediate the relationship between education and dementia status: job category, income, and wealth. The respondent's best (in 10/66) or longest (in HRS) held job is available in detailed categories that differ between data sources. To maximize comparability, we dichotomized occupation into blue‐ versus white‐collar job (see Table S1 in supporting information for mapping between original and classified occupation categories). We classified HRS respondents who never worked into a separate job category. This category was not available for 10/66 respondents as it was not explicitly reported. We included logged income, measured at the respondent level in 10/66 and household level in HRS. For wealth, we used logged total wealth (including housing) for HRS respondents, and asset quartiles for 10/66 respondents, as only number of assets and its quartiles are available in 10/66.
2.8. Statistical analyses
We first estimated the predicted prevalence of dementia as a quadratic function of age, stratified by sex and education, which we compared across four populations taking into consideration the sample size in each: 10/66 respondents pooled across the three Caribbean settings, and HRS respondents by race/ethnicity (Hispanic, Black, and White).
We then estimated a series of logistic regression models with dementia as the dependent variable, and education and socioeconomic covariates as independent variables. Models were estimated separately for each population. In the first model we only controlled for age (as a quadratic) and included all individuals in the sample with non‐missing measures of dementia status, education, sex, and age (full sample). Because the HRS has a nontrivial proportion of respondents with missing job status, especially among Hispanics, we estimated a second model with identical specification to the first, but only included those individuals with non‐missing value for all variables (dementia status, education, age, job category, income, and wealth), to examine any changes in associations due to changes in sample. The third model controlled additionally for job category, and the fourth model included all controls in the third model plus income and wealth. The restricted sample in Models 2 to 4 was kept constant. We estimated all models pooled across sexes as well as stratified by sex.
To statistically compare the gap in dementia prevalence between the highest and lowest education groups across populations, we estimated pooled logistic regressions including all four populations, both pooled across sexes and stratified by sex. Each regression was analogous to Model 1 above, but includes only individuals with the highest (college or above in HRS and secondary school or above in 10/66) and lowest (no high school degree in HRS and not completing primary school in 10/66) levels of education, and includes indicators for each population and their interactions with level of education.
To test sensitivity to our dementia measure in the US population, we repeated our US analysis using three alternative classification models for dementia in the HRS. These models, referred to as the Hurd Model, Expert Model, and LASSO Model, have been validated against ADAMS, the dementia‐focused supplemental study of HRS with a smaller sample size, and have been shown to have greater sensitivity to racial/ethnic and sociodemographic disparities compared to the Langa‐Weir method.45, 46
The study was approved by University of California, Berkeley's Human Research Protection Program. Informed consent was not necessary as we used secondary data only.
3. RESULTS
Summary statistics pooled across sexes are shown in Table 1A and by sex in Table 1B. Dementia prevalence in the pooled Caribbean sample was 11%, and similar across the three Caribbean islands (Table 1A). In comparison, dementia prevalence was higher among Hispanic Americans (17.9%) and Black Americans (16.2%), and lower among White Americans (8.2%). In the pooled Caribbean sample, 40.5% of individuals had education in the highest group (secondary school or above). In comparison, more than 50% of the Hispanic American sample had low education (no high school degree), and half or more among Black and White Americans had medium education (high school degree or equivalent). Across all samples, females had higher dementia prevalence and a higher fraction in low education (except Black Americans) than males (Table 1B). Table S2 in supporting information shows analogous and similar statistics for the restricted samples.
TABLE 1A.
Summary statistics of study samples, overall
| Caribbean | United States | ||||||
|---|---|---|---|---|---|---|---|
| Cuba | Dominican Republic | Puerto Rico | Pooled Caribbean | Hispanic Americans | Black Americans | White Americans | |
| All | All | All | All | All | All | All | |
| PANEL A | |||||||
| N | 2929 | 1188 | 1990 | 6107 | 1153 | 1726 | 8153 |
| Dementia, % | 10.9 | 10.2 | 11.6 | 11.0 | 17.9 | 16.2 | 8.2 |
| Sex, % | |||||||
| Female | 65.0 | 69.4 | 67.2 | 66.6 | 57.2 | 63.3 | 58.4 |
| Male | 35.0 | 30.6 | 32.8 | 33.4 | 42.8 | 36.7 | 41.6 |
| Age, mean (SD) | 75.1 (7.0) | 74 (6.8) | 76.3 (7.4) | 75.3 (7.2) | 74.7 (7.6) | 74.9 (7.7) | 77.4 (8.0) |
| Education, %a | |||||||
| Low | 24.8 | 69.7 | 23.0 | 33.0 | 55.4 | 31.3 | 12.7 |
| Medium | 33.4 | 19.3 | 20.8 | 26.5 | 34.4 | 51.1 | 56.9 |
| High | 41.9 | 11.0 | 56.2 | 40.5 | 10.1 | 17.6 | 30.4 |
| PANEL B | |||||||
| N | 2442 | 1174 | 1989 | 5605 | 999 | 1478 | 7321 |
| Income, mean (SD)b | 241.2 (540.0) | 112.6 (199.3) | 666.9 (707.0) | 365.3 (604.2) | 41.4 (15.4) | 37.8 (44.9) | 70.4 (11.8) |
| Wealth, mean (SD) | – | – | – | – | 219.7 (601.1) | 187.4 (456.1) | 648.6 (1263.0) |
| Lowest asset quartilec, % | 16.0 | 28.7 | 27.5 | 22.7 | – | – | – |
| Occupation, % | |||||||
| White collar | 39.3 | 14.1 | 39.8 | 34.2 | 39.4 | 45.0 | 68.4 |
| Blue collar | 60.7 | 85.9 | 60.2 | 65.8 | 60.6 | 55.0 | 31.6 |
| Never worked | – | – | – | – | 10.7 | 5.1 | 2.5 |
For Caribbean samples, low, medium, and high education levels correspond to not completing primary school, completed primary school, and secondary school or above, respectively; for US samples, they correspond to no high school degree, high school degree or equivalent, and some college or above, respectively.
Income for US sample is in $1000s and measured at the household level; income for the Caribbean samples is measured at the individual level as no household income is available.
Asset quartiles are classified based on discrete number of assets. Only the lowest quartile is shown as the higher quartiles were not differentiated in the Puerto Rico data (all individuals with assets above the first quartile in Puerto Rico had the same number of assets).
TABLE 1B.
Summary statistics of study samples, by sex
| Caribbean | United States | |||||||||||||
|---|---|---|---|---|---|---|---|---|---|---|---|---|---|---|
| Cuba | Dominican Republic | Puerto Rico | Pooled Caribbean | Hispanic Americans | Black Americans | White Americans | ||||||||
| Female | Male | Female | Male | Female | Male | Female | Male | Female | Male | Female | Male | Female | Male | |
| PANEL A | ||||||||||||||
| N | 1904 | 1025 | 824 | 364 | 1338 | 652 | 4066 | 2041 | 660 | 493 | 1093 | 633 | 4759 | 3394 |
| Dementia, % | 11.7 | 9.4 | 10.8 | 8.8 | 11.6 | 11.5 | 11.5 | 9.9 | 19.8 | 15.2 | 17.1 | 14.5 | 8.6 | 7.7 |
| Age, mean (SD) | 75.3 (7.2) | 74.5 (6.6) | 74.2 (7.0) | 73.4 (6.3) | 76.1 (7.5) | 76.9 (7.3) |
75.4 (7.3) |
75.1 (6.9) | 75.0 (7.9) | 74.2 (7.2) | 75.2 (7.9) | 74.5 (7.3) | 77.6 (8.2) | 77.0 (7.7) |
| Education, %a | ||||||||||||||
| Low | 28.0 | 18.7 | 72.7 | 62.9 | 25.5 | 17.9 | 36.3 | 26.4 | 58.3 | 51.5 | 30.4 | 32.9 | 13.3 | 12.0 |
| Medium | 34.6 | 31.1 | 17.8 | 22.5 | 21.2 | 19.8 | 26.8 | 26.0 | 33.2 | 36.1 | 52.0 | 49.4 | 60.8 | 51.3 |
| High | 37.4 | 50.1 | 9.5 | 14.6 | 53.3 | 62.2 | 37.0 | 47.7 | 8.5 | 12.4 | 17.6 | 17.7 | 25.9 | 36.7 |
| PANEL B | ||||||||||||||
| N | 1421 | 1021 | 817 | 357 | 1337 | 652 | 3575 | 2030 | 558 | 441 | 930 | 548 | 4194 | 3127 |
| Income, mean (SD)b | 196.1 (363.7) | 303.4 (710.8) | 82.4 (138.8) | 181.8 (282.5) | 572.6 (513.3) | 860.1 (964.4) | 312.0 (455.3) | 462.0 (802.8) | 32.4 (74.1) | 52.8 (215.9) | 32.6 (39.2) | 46.6 (52.0) | 62.2 (115.0) | 81.5 (121.5) |
| Wealth, mean (SD) | – | – | – | – | – | – | – | – | 205.6 (537.1) | 237.6 (673.7) | 169.5 (432.5) | 217.7 (492.7) | 568.3 (1089.9) | 756.3 (1456.6) |
| Lowest asset quartilec, % | 17.4 | 13.9 | 27.8 | 30.8 | 31.4 | 19.3 | 25.0 | 18.6 | – | – | – | – | – | – |
| Occupation, % | ||||||||||||||
| White collar | 39.9 | 38.5 | 12.9 | 17.1 | 37.1 | 45.4 | 32.7 | 36.9 | 32.1 | 24.5 | 46.5 | 31.6 | 72.2 | 57.4 |
| Blue collar | 60.2 | 61.5 | 87.1 | 82.9 | 62.9 | 54.6 | 67.3 | 63.1 | 52.3 | 71.0 | 49.0 | 65.1 | 24.0 | 41.7 |
| Never worked | – | – | – | – | – | – | – | – | 15.6 | 4.5 | 6.1 | 3.3 | 3.8 | 0.9 |
For Caribbean samples, low, medium, and high education levels correspond to not completing primary school, completed primary school, and secondary school or above, respectively; for US samples, they correspond to no high school degree, high school degree or equivalent, and some college or above, respectively.
Income for US sample is in $1000s and measured at the household level; income for the Caribbean samples is measured at the individual level as no household income is available.
Asset quartiles are classified based on discrete number of assets. Only the lowest quartile is shown as the higher quartiles were not differentiated in the Puerto Rico data (all individuals with assets above the first quartile in Puerto Rico had the same number of assets).
Across all samples, the predicted dementia prevalence increased strongly with age (Figure 1). For the Caribbean, the differences were generally small across education levels. By contrast, among White Americans (with a comparable sample size as the pooled Caribbean sample), those with no high school degree had a markedly faster increase in dementia prevalence with age relative to higher education groups, especially after age 85. Among US Hispanics and Blacks, the patterns were less clear due to smaller sample sizes at older ages, although those with no high school degree still had higher dementia prevalence.
FIGURE 1.
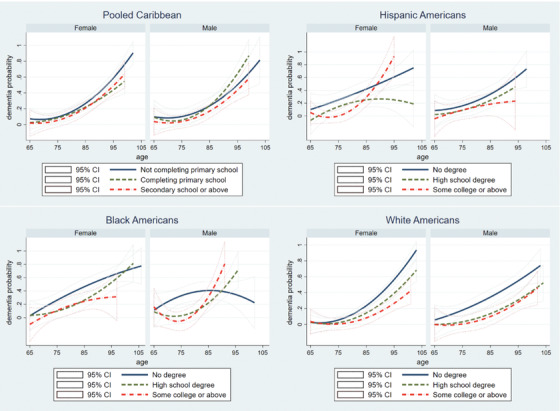
Age profile of dementia prevalence by education, sex, and population. Notes: dementia probabilities are shown as quadratic functions. CI, confidence interval
Table 2 focuses on regression results pooled across sexes and presents relative risk (RR) estimates from regressions by population. In the Caribbean population, relative to medium education, low education was associated with slightly higher risk of dementia after conditioning on age, without socioeconomic controls (Model 1: RR 1.22, 95% confidence interval [CI] 1.02, 1.42), and the relationship became insignificant after adding occupation, income, and wealth. Those with high education had lower dementia risk compared to those with medium education (Model 1: RR 0.72, 95% CI 0.58, 0.85), and the results barely changed after including socioeconomic controls. In the United States, high education had a generally similar associations with dementia as in the Caribbean for all racial/ethnic subgroups. Furthermore, occupation, income, and wealth explained part of this protection in some subgroups, particularly among Whites. In contrast, low education was associated with markedly higher dementia risk in the United States than the Caribbean across racial/ethnic subgroups, and this association was partially reduced after adding socioeconomic characteristics (Hispanics, Model 1: RR 2.24, 95% CI 1.53, 2.94; Hispanics, Model 4: RR 1.54, 95% CI 0.99, 2.08; Whites, Model 1: RR 2.26, 95% CI 1.92, 2.60; Whites, Model 4: RR 1.80, 95% CI 1.48, 2.13). In general, changing the sample from full (Model 1) to restricted (Model 2) made very little difference. The sex‐stratified results are shown in Table S3 in supporting information. Full regression results are shown in Table S4 in supporting information.
TABLE 2.
Regression‐adjusted relative risk of dementia by education and population
| Model 1a | Model 2 | Model 3 | Model 4 | ||
|---|---|---|---|---|---|
| Pooled Caribbeanb | Low education | 1.22 (1.02, 1.42) | 1.23 (1.02, 1.44) | 1.21 (1, 1.42) | 1.20 (0.99, 1.41) |
| High education | 0.72 (0.58, 0.85) | 0.67 (0.53, 0.8) | 0.72 (0.56, 0.88) | 0.72 (0.56, 0.88) | |
| Hispanic Americans | Low education | 2.24 (1.53, 2.94) | 2.15 (1.41, 2.89) | 1.66 (1.08, 2.25) | 1.54 (0.99, 2.08) |
| High education | 0.82 (0.25, 1.38) | 0.77 (0.18, 1.36) | 0.93 (0.25, 1.62) | 0.92 (0.24, 1.59) | |
| Black Americans | Low education | 2.04 (1.59, 2.48) | 2.15 (1.63, 2.67) | 1.86 (1.37, 2.35) | 1.71 (1.26, 2.17) |
| High education | 0.63 (0.35, 0.91) | 0.60 (0.29, 0.9) | 0.69 (0.34, 1.04) | 0.75 (0.38, 1.12) | |
| White Americans | Low education | 2.26 (1.92, 2.6) | 2.36 (1.96, 2.75) | 2.11 (1.74, 2.49) | 1.80 (1.48, 2.13) |
| High education | 0.61 (0.48, 0.73) | 0.61 (0.47, 0.75) | 0.68 (0.52, 0.84) | 0.79 (0.61, 0.97) |
All models are logistic regressions with an indicator for any dementia as the dependent variable, and control for age and age squared. Model 1 includes the full sample of individuals with non‐missing values of dementia status, age, and sex. Model 2 repeats Model 1 but using the restricted sample, defined to also exclude observations with missing values for occupation, income, and wealth. Model 3 uses the restricted sample, adding to Model 2 additional controls for occupation categories as listed in Table 1. Model 4 uses the restricted sample, adding to Model 3 additional controls for income and wealth/assets. Full model results with odds ratios are reported in Table S4.
Relative risks reported are those for each level of education relative to the omitted (medium education) category. For Caribbean samples, education categories include (1) not completing primary school (low), (2) completing primary school (omitted), and (3) secondary school or above (high). For US samples, education categories include (1) no degree (low), (2) high school degree (omitted), and (3) some college or above (high).
In Figure 2, the age‐adjusted dementia prevalence and its 95% CIs by sample (derived from Model 1 in Table 2) revealed a consistent dose response whereby lower levels of education were associated with higher dementia prevalence, with overlapped CIs in some cases.
FIGURE 2.
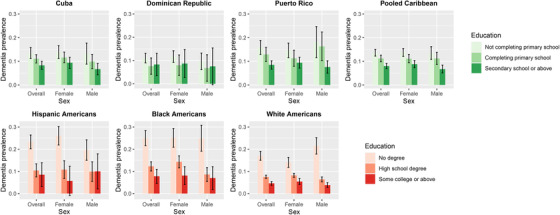
Age‐adjusted dementia prevalence by education, sex, and population. Notes: age‐adjusted dementia prevalence figures shown were based on logistic regressions of dementia on indicators of education, controlling for age, age squared, and sex. Adjusted prevalence was the average across all age groups in a population, overall and by sex.
In pooled regression models across the Caribbean and US populations and among adults in the lowest and highest education groups (Table 3 and Table S5 in supporting information), the RR of dementia for low (compared to high) education was 1.62 (95% CI 1.35, 1.89) in the Caribbean, compared to 3.94 (95% CI 3.06, 4.83) among White Americans (ratio of RRs: 2.43, 95% CI 1.77, 3.10), and 3.07 (95% CI 1.79, 4.36) among Black Americans (ratio of RRs: 1.90, 95% CI 1.05, 2.75). The RR and ratio of RRs among Hispanic Americans (relative to Caribbean) were slightly smaller and significant (RR: 2.59, 95% CI 0.97, 4.21; ratio of RRs: 1.60, 95% CI 0.57, 2.63). The differences between the Caribbean population and White Americans appeared larger among males (ratio of RRs: 3.12, 95% CI 1.76, 4.48) than females (ratio of RRs: 1.91, 95% CI 1.23, 2.59).
TABLE 3.
Comparison of dementia association with education in Caribbean versus United States
| Overall | Femalea | Malea | ||||
|---|---|---|---|---|---|---|
| Regression estimated RRb(95% CI) | Ratio of RR: US subpopulation/pooled Caribbean (95% CI) | Regression estimated RRb(95% CI) | Ratio of RR: US subpopulation/pooled Caribbean (95% CI) | Regression estimated RRb(95% CI) | Ratio of RR: US subpopulation/pooled Caribbean (95% CI) | |
| Pooled Caribbean | 1.62 | 1.45 | 1.92 | |||
| (1.35,1.89) | (1.17,1.74) | (1.35,2.49) | ||||
| Hispanic Americans | 2.59 | 1.60 | 3.98 | 2.74 | 1.88 | 0.98 |
| (0.97,4.21) | (0.57,2.63) | (1.34,11.81) | (0.91,8.24) | (0.40,3.37) | [0.16,1.80] | |
| Black Americans | 3.07 | 1.90 | 3.05 | 2.10 | 3.15 | 1.64 |
| (1.79,4.36) | (1.05,2.75) | (1.48,4.61) | (0.95,3.24) | (0.89,5.42) | [0.37,2.91] | |
| White Americans | 3.94 | 2.43 | 2.78 | 1.91 | 5.98 | 3.12 |
| (3.06,4.83) | (1.77,3.10) | (1.94,3.61) | (1.23,2.59) | (4.02,7.95) | [1.76,4.48] | |
| N | 9623 | 5819 | 3804 | |||
Abbreviations: CI, confidence interval; RR, relative risk.
Results reported in Columns (1)–(3) are each based on one regression, shown in Table S5, which predicts probability of dementia probability using an indicator of low education (omitted: high education), indicators for each US subpopulation by race/ethnicity (omitted: pooled Caribbean), interactions between low education and each US subpopulation by race/ethnicity, age and age squared. These regressions exclude individuals with medium education.
Relative risk reported are those of low education relative to high education.
Results for the US population by race/ethnicity were consistent when estimated using three additional classification models for dementia (Figure S1 in supporting information). Results using 2008 HRS data were also very similar (omitted).
4. DISCUSSION
In this study, we compared the associations between education and dementia across the Caribbean population and US populations by race/ethnicity. While higher levels of education were associated with lower risk of dementia across all populations we studied, there was considerable heterogeneity. We found substantially smaller differences in dementia risk between the highest and lowest education levels in the Caribbean population, compared to those in the United States, especially non‐Hispanic Whites. Further, controlling for later‐life socioeconomic characteristics, including occupation, income, and wealth, only partially reduced these associations between education and dementia.
Our study contributes to the small but growing literature comparing dementia prevalence, incidence, and associated risk factors across US‐dwelling and international populations, where social contexts may differ considerably. Among migrant populations in the United States, Caribbean Hispanics are the fourth largest group and the second largest group within Hispanics, on whom surprisingly little evidence exists. While a handful of previous studies found significantly higher dementia prevalence and incidence among Caribbean Hispanics relative to Whites,3, 50, 51 ours is the first to compare the associations between education and dementia between older individuals residing in the Caribbean region and those in the United States by race and ethnicity.
To help explain the varying associations between education and dementia observed across populations and contexts, it is helpful to consider key hypotheses regarding why we observe such associations at all. First, higher educated individuals may engage in more neuroprotective cognitive activity, physiologically delaying the onset, and slowing the speed of age‐related brain pathology.52 Second, education may facilitate higher cognitive reserve, allowing the brain to better cope with adverse brain pathology.53, 54 Stated differently, at the same level of brain pathology, those with lower education may show greater cognitive impairment than more educated individuals. Third, related to the more general fundamental cause theory,55 education attainment may causally improve middle and later life social conditions that in turn improve potential mediators such as income, access to health care, healthy behaviors, social stressors, etc.
In the United States, educational differences in dementia prevalence are larger between those with a high school degree and those with less than a high school degree (the middle and lowest education groups), relative to between those with a high school degree and college education (the middle and highest education groups). Consistent with the first two hypotheses (great neuroprotective cognitive activity, or higher cognitive reserve), this may be partially explained by a higher fraction of those with high school degree in white collar occupations, especially among Whites (with overall high proportion of individuals holding white‐collar jobs), relative to those with less than high school education. In the Caribbean settings, the comparison between those with secondary school (the highest group) and those with less education indicates a much smaller difference in dementia than the within‐US comparisons, which again may be related to an overall smaller fraction of individuals holding white‐collar jobs. However, controlling for occupation category only partially reduced the associations between education and dementia. Further controlling for income and wealth, which may capture residual variation in activities among occupations in the same category, also made little difference, suggesting that neither of the first two hypotheses (more neuroprotective activity or higher cognitive reserve) likely plays a dominant role. However, given that our measure of dementia is prevalence rather than incidence, the exact role of cognitive reserve may not be straightforward to interpret.
Alternatively, if the third hypothesis related to more general social conditions is underlying these results, that would be consistent with various potential pathways. For instance, it could be that the social environment (including family social support) is more equal across education groups in the Caribbean;56 or, potentially, that higher education is associated with unmeasured collider variables such as higher obesity, as has been observed in Latin America and the Caribbean, especially among men.57 The particularly large differences in dementia prevalence across education groups in the United States are also consistent with the hypothesis that the lowest education group in the United States is particularly disadvantaged in multiple social dimensions.58 Future studies should expand on the role of socioeconomic status, occupational complexity, vascular risk factors occurring through life, and other related factors that influence health disparities and dementia prevalence.
Our study has limitations. First, the classification procedure for assigning dementia status differed in the HRS and 10/66 due to questionnaire differences, which could influence the comparability of our estimates of dementia prevalence in addition to differences by education. We plan to address this possibility in future work. Second, it is possible that the US dementia classification methods used may have performed differently among subpopulations such as low‐educated Hispanics, causing biases in unknown directions. To explore this concern, we used three alternative dementia classification schemes in the HRS, and found consistent results. Third, we relied on relatively small sample sizes to examine associations between education and dementia among racial/ethnic minorities in the United States. Our sample size of Hispanic Americans was particularly small despite pooling across Hispanics of all origins, which limited our ability to draw statistical inferences or make direct comparisons due to differences in origins with the Caribbean population. Fourth, because of contextual differences, average education in the Caribbean is lower in each of the three education groups than the United States (the middle Caribbean education group is equivalent to 6 years of education, vs. 12 years in the corresponding US group). Thus, an alternative explanation of our results is that high school completion (as analyzed in the United States) confers particularly large benefits in terms of increased cognitive activity and reserve, whereas the lower absolute attainment levels compared in the Caribbean may be less impactful. Future work with larger samples will be needed to test whether high school completion in the Caribbean confers similarly large benefits. Fifth, as with all observational studies, we cannot rule out the possibility of unmeasured confounding. Finally, due to data limitations, we were not able to systematically examine other mediators such as cardiovascular disease or genetic risk variants linked to AD.
5. CONCLUSION
We find both a smaller disadvantage of low education and a potentially limited protective role of education against dementia in the Caribbean context compared to the United States. Given the remarkable heterogeneity in dementia risk factors such as social determinants of health in the Caribbean islands,9 further research is needed to examine specific risk factors that mediate or modify the relationship between education and dementia in those contexts, compared to high‐income countries, and inform culturally sensitive interventions in addressing dementia burden among Hispanic populations in both the Caribbean and United States.37
CONFLICTS OF INTEREST
WD has provided consultation to Urban Institute, the Robert Wood Johnson Foundation, NIH, and Annual Review of Public Health. JL, IJG, AH, JW, IJV, DA, ML, and JLR have nothing to disclose.
Supporting information
Supplementary Information
ACKNOWLEDGMENTS
JL, IJG, AH, IJV, DA, ML, and WD are supported by funding from the National Institutes of Health (NIH; Grant: R01AG064778). JL additional acknowledges funding from NIH Grant K01AG066946. WD additionally acknowledges funding from NIH Grant P30AG012839 and support from Robert Wood Johnson Foundation and Johns Hopkins University. JW acknowledges funding from NIH (Grant: T32AG000246) and support from University of Pennsylvania.
The funding source had no role in the design and conduct of the study; collection, management, analysis, and interpretation of the data; preparation, review, or approval of the manuscript; and decision to submit the manuscript for publication.
Li J, Llibre‐Guerra JJ, Harrati A, et al. Associations between education and dementia in the Caribbean and the United States: An international comparison. Alzheimer's Dement. 2021;7:e12204. 10.1002/trc2.12204
REFERENCES
- 1.Nichols E, Szoeke CE, Vollset SE, et al. Global, regional, and national burden of Alzheimer's disease and other dementias, 1990‐2016: a systematic analysis for the Global Burden of Disease Study 2016. Lancet Neurol. 2019;18(1):88‐106. [DOI] [PMC free article] [PubMed] [Google Scholar]
- 2.Reitz C, Brayne C, Mayeux R. Epidemiology of Alzheimer disease. Nat Rev Neurol. 2011;7(3):137‐152. [DOI] [PMC free article] [PubMed] [Google Scholar]
- 3.Gurland BJ, Wilder DE, Lantigua R, et al. Rates of dementia in three ethnoracial groups. Int J Geriatr Psychiatry. 1999;14(6):481‐493. [PubMed] [Google Scholar]
- 4.Haan MN, Mungas DM, Gonzalez HM, et al. Prevalence of dementia in older Latinos: the influence of type 2 diabetes mellitus, stroke and genetic factors. J Am Geriatr Soc. 2003;51(2):169‐177. [DOI] [PubMed] [Google Scholar]
- 5.Langa KM, Larson EB, Crimmins EM, et al. A comparison of the prevalence of dementia in the United States in 2000 and 2012. JAMA Intern. Med.. 2017;177(1):51‐58. [DOI] [PMC free article] [PubMed] [Google Scholar]
- 6.Nitrini R, Bottino C, Albala C, et al. Prevalence of dementia in Latin America: a collaborative study of population‐based cohorts. Int Psychogeriatr. 2009:622‐630. [DOI] [PMC free article] [PubMed] [Google Scholar]
- 7.Prince M, Acosta D, Ferri CP, et al. Dementia incidence and mortality in middle‐income countries, and associations with indicators of cognitive reserve: a 10/66 Dementia Research Group population‐based cohort study. Lancet North Am Ed. 2012;380(9836):50‐58. [DOI] [PMC free article] [PubMed] [Google Scholar]
- 8.Rodriguez JJL, Ferri CP, Acosta D, et al. Prevalence of dementia in Latin America, India, and China: a population‐based cross‐sectional survey. Lancet North Am Ed. 2008;372(9637):464‐474. [DOI] [PMC free article] [PubMed] [Google Scholar]
- 9.Parra MA, Baez S, Sedeño L, et al. Dementia in Latin America: Paving the way toward a regional action plan. Alzheimer's & Dementia. 2020. [DOI] [PMC free article] [PubMed] [Google Scholar]
- 10.Vega IE, Cabrera LY, Wygant CM, et al. Alzheimer's disease in the latino community: intersection of genetics and social determinants of health. J Alzheimer's Disease. 2017;58(4):979‐992. [DOI] [PMC free article] [PubMed] [Google Scholar]
- 11.Yaffe K, Falvey C, Harris TB, et al. Effect of socioeconomic disparities on incidence of dementia among biracial older adults: prospective study. BMJ : British Medical Journal. 2013;347:f7051. [DOI] [PMC free article] [PubMed] [Google Scholar]
- 12.EdPF Resende, Guerra JJL, Miller BL. Health and socioeconomic inequities as contributors to brain health. JAMA Neurol. 2019;76(6):633‐634. [DOI] [PMC free article] [PubMed] [Google Scholar]
- 13.Chin AL, Negash S, Hamilton R. Diversity and disparity in dementia: the impact of ethnoracial differences in Alzheimer disease. Alzheimer Dis Assoc Disord. 2011;25(3):187‐195. [DOI] [PMC free article] [PubMed] [Google Scholar]
- 14.Gilsanz P, Quesenberry CP, Mayeda ER, et al. Stressors in Midlife and Risk of Dementia. Alzheimer Dis Assoc Disord. 2019;33(3):200‐205. [DOI] [PMC free article] [PubMed] [Google Scholar]
- 15.Gross AL, Mungas DM, Crane PK, et al. Effects of education and race on cognitive decline: an integrative study of generalizability versus study‐specific results. Psychol Aging. 2015;30(4):863. [DOI] [PMC free article] [PubMed] [Google Scholar]
- 16.Braveman PA, Cubbin C, Egerter S, et al. Socioeconomic disparities in health in the United States: what the patterns tell us. Am J Public Health. 2010;100(S1):S186‐S196. [DOI] [PMC free article] [PubMed] [Google Scholar]
- 17.Braveman P. Health disparities and health equity: concepts and measurement. Annu Rev Public Health. 2006;27:167‐194. [DOI] [PubMed] [Google Scholar]
- 18.Farmer MM, Ferraro KF. Are racial disparities in health conditional on socioeconomic status? Soc Sci Med. 2005;60(1):191‐204. [DOI] [PubMed] [Google Scholar]
- 19.Kawachi I, Daniels N, Robinson DE. Health disparities by race and class: why both matter. Health Aff. 2005;24(2):343‐352. [DOI] [PubMed] [Google Scholar]
- 20.Williams DR, Jackson PB. Social sources of racial disparities in health. Health Aff. 2005;24(2):325‐334. [DOI] [PubMed] [Google Scholar]
- 21.Daviglus ML, Talavera GA, Avilés‐Santa ML, et al. Prevalence of major cardiovascular risk factors and cardiovascular diseases among Hispanic/Latino individuals of diverse backgrounds in the United States. JAMA. 2012;308(17):1775‐1784. [DOI] [PMC free article] [PubMed] [Google Scholar]
- 22.Bellou V, Belbasis L, Tzoulaki I, et al. Risk factors for type 2 diabetes mellitus: an exposure‐wide umbrella review of meta‐analyses. PLoS One. 2018;13(3):e0194127. [DOI] [PMC free article] [PubMed] [Google Scholar]
- 23.Dieci M, Llibre‐Rodriguez JJ, Acosta D, et al. Cuba's cardiovascular risk factors: international comparison of levels and education gradients. PLoS One. 2021;16(3):e0247831. [DOI] [PMC free article] [PubMed] [Google Scholar]
- 24.Sharma S, Malarcher AM, Giles WH, et al. Racial, ethnic and socioeconomic disparities in the clustering of cardiovascular disease risk factors. Ethn Dis. 2004;14(1):43‐48. [PubMed] [Google Scholar]
- 25.Zhang H, Rodriguez‐Monguio R. Racial disparities in the risk of developing obesity‐related diseases: a cross‐sectional study. Ethn Dis. 2012;22(3):308‐316. [PubMed] [Google Scholar]
- 26.McWilliams JM, Meara E, Zaslavsky AM, et al. Differences in control of cardiovascular disease and diabetes by race, ethnicity, and education: uS trends from 1999 to 2006 and effects of medicare coverage. Ann Intern Med. 2009;150(8):505‐515. [DOI] [PubMed] [Google Scholar]
- 27.Avendano M, Glymour MM. Stroke disparities in older Americans: is wealth a more powerful indicator of risk than income and education? Stroke. 2008;39(5):1533‐1540. [DOI] [PMC free article] [PubMed] [Google Scholar]
- 28.Bravata DM, Wells CK, Gulanski B, et al. Racial disparities in stroke risk factors: the impact of socioeconomic status. Stroke. 2005;36(7):1507‐1511. [DOI] [PubMed] [Google Scholar]
- 29.Cruz‐Flores S, Rabinstein A, Biller J, et al. Racial‐ethnic disparities in stroke care: the American experience: a statement for healthcare professionals from the American Heart Association/American Stroke Association. Stroke. 2011;42(7):2091‐2116. [DOI] [PubMed] [Google Scholar]
- 30.McGruder HF, Malarcher AM, Antoine TL, et al. Racial and ethnic disparities in cardiovascular risk factors among stroke survivors: united States 1999 to 2001. Stroke. 2004;35(7):1557‐1561. [DOI] [PubMed] [Google Scholar]
- 31.Schindler SE, Cruchaga C, Joseph A, et al. African Americans have differences in CSF soluble TREM2 and associated genetic variants. Neurology Genetics. 2021;7(2). [DOI] [PMC free article] [PubMed] [Google Scholar]
- 32.Morris JC, Schindler SE, McCue LM, et al. Assessment of racial disparities in biomarkers for Alzheimer disease. JAMA Neurol. 2019;76(3):264‐273. [DOI] [PMC free article] [PubMed] [Google Scholar]
- 33.Llibre‐Guerra JJ, Li Y, Allen IE, et al. Race, Genetic Admixture, and Cognitive Performance in the Cuban Population. The Journals of Gerontology: Series A. 2021. [DOI] [PubMed] [Google Scholar]
- 34.Norton S, Matthews FE, Barnes DE, Yaffe K, Brayne C. Potential for primary prevention of Alzheimer's disease: an analysis of population‐based data. Lancet Neurol. 2014;13(8):788‐794. [DOI] [PubMed] [Google Scholar]
- 35.JdJL Rodríguez. Aging and dementia: implications for Cuba's research community, public health and society. MEDICC Review. 2013;15(4):54‐59. [DOI] [PubMed] [Google Scholar]
- 36.Rodríguez JL, Valhuerdi A, Sanchez I, et al. The prevalence, correlates and impact of dementia in Cuba. Neuroepidemiology. 2008;31(4):243‐251. [DOI] [PMC free article] [PubMed] [Google Scholar]
- 37.Kivipelto M, Mangialasche F, Snyder HM, et al. World‐Wide FINGERS Network: a global approach to risk reduction and prevention of dementia. Alzheimer's & Dementia. 2020;16(7):1078‐1094. [DOI] [PMC free article] [PubMed] [Google Scholar]
- 38.Prince M, Ferri CP, Acosta D, et al. The protocols for the 10/66 dementia research group population‐based research programme. BMC public health. 2007;7(1):165. [DOI] [PMC free article] [PubMed] [Google Scholar]
- 39.Prina AM, Acosta D, Acosta I, et al. Cohort profile: the 10/66 study. Int J Epidemiol. 2017;46(2):406‐406i. [DOI] [PMC free article] [PubMed] [Google Scholar]
- 40.Sonnega A, Faul JD, Ofstedal MB, et al. Cohort Profile: the Health and Retirement Study (HRS). Int J Epidemiol. 2014;43(2):576‐585. [DOI] [PMC free article] [PubMed] [Google Scholar]
- 41.Prince M, Acosta D, Chiu H, et al. Dementia diagnosis in developing countries: a cross‐cultural validation study. Lancet North Am Ed. 2003;361(9361):909‐917. [DOI] [PubMed] [Google Scholar]
- 42.Crimmins E, Kim J, Langa K, Weir D. Assessment of cognition using surveys and neuropsychological assessment: the Health and Retirement Study and the Aging, Demographics, and Memory Study. J Gerontol B Psychol Sci Soc Sci. 2011;66(1):i162‐171. Suppl. [DOI] [PMC free article] [PubMed] [Google Scholar]
- 43.Langa KM, Plassman BL, Wallace RB, et al. The Aging, Demographics, and Memory Study: study design and methods. Neuroepidemiology. 2005;25(4):181‐191. [DOI] [PubMed] [Google Scholar]
- 44.Jorm A. A short form of the Informant Questionnaire on Cognitive Decline in the Elderly (IQCODE): development and cross‐validation. Psychol Med. 1994;24(1):145‐153. [DOI] [PubMed] [Google Scholar]
- 45.Gianattasio KZ, Ciarleglio A, Power MC. Development of algorithmic dementia ascertainment for racial/ethnic disparities research in the US Health and Retirement Study. Epidemiology. 2020;31(1):126‐133. [DOI] [PMC free article] [PubMed] [Google Scholar]
- 46.Gianattasio KZ, Wu Q, Glymour MM, et al. Comparison of methods for algorithmic classification of dementia status in the Health and Retirement Study. Epidemiology. 2019;30(2):291. Cambridge, Mass. [DOI] [PMC free article] [PubMed] [Google Scholar]
- 47.Rehkopf DH, Dow WH, Rosero‐Bixby L. Differences in the association of cardiovascular risk factors with education: a comparison of Costa Rica (CRELES) and the USA (NHANES). J Epidemiol Community Health. 2010;64(9):821‐828. [DOI] [PMC free article] [PubMed] [Google Scholar]
- 48.Goldman N, Turra CM, Rosero‐Bixby L, et al. Do biological measures mediate the relationship between education and health: a comparative study. Soc Sci Med. 2011;72(2):307‐315. [DOI] [PMC free article] [PubMed] [Google Scholar]
- 49.McEniry M, Samper‐Ternent R, Flórez CE, et al. Patterns of SES health disparities among older adults in three upper middle‐and two high‐income countries. The Journals of Gerontology: Series B. 2019;74(6):e25‐e37. [DOI] [PMC free article] [PubMed] [Google Scholar]
- 50.Demirovic J, Prineas R, Loewenstein D, et al. Prevalence of dementia in three ethnic groups: the South Florida program on aging and health. Ann Epidemiol. 2003;13(6):472‐478. [DOI] [PubMed] [Google Scholar]
- 51.Tang M‐X, Cross P, Andrews H, et al. Incidence of AD in African‐Americans, Caribbean hispanics, and caucasians in northern Manhattan. Neurology. 2001;56(1):49‐56. [DOI] [PubMed] [Google Scholar]
- 52.Del Ser T, Hachinski V, Merskey H, et al. An autopsy‐verified study of the effect of education on degenerative dementia. Brain. 1999;122(12):2309‐2319. [DOI] [PubMed] [Google Scholar]
- 53.Roe CM, Xiong C, Miller JP, et al. Education and Alzheimer disease without dementia: support for the cognitive reserve hypothesis. Neurology. 2007;68(3):223‐228. [DOI] [PubMed] [Google Scholar]
- 54.Brayne C, Ince PG, Keage HAD, et al. Education, the brain and dementia: neuroprotection or compensation?EClipSE Collaborative Members. Brain. 2010;133(8):2210‐2216. [DOI] [PubMed] [Google Scholar]
- 55.Phelan JC, Link BG. Fundamental cause theory. Medical sociology on the move. 2013:105‐125. [Google Scholar]
- 56.Huenchuan S. Ageing, solidarity and social protection in Latin America and the Caribbean: time for progress towards equality. ECLAC. 2013. [Google Scholar]
- 57.Jiwani SS, Carrillo‐Larco RM, Hernández‐Vásquez A, et al. The shift of obesity burden by socioeconomic status between 1998 and 2017 in Latin America and the Caribbean: a cross‐sectional series study. The Lancet Global Health. 2019;7(12):e1644‐e1654. [DOI] [PMC free article] [PubMed] [Google Scholar]
- 58.Rosero‐Bixby L, Dow WH. Exploring why Costa Rica outperforms the United States in life expectancy: a tale of two inequality gradients. Proc Natl Acad Sci U S A. 2016;113(5):1130‐1137. [DOI] [PMC free article] [PubMed] [Google Scholar]
- 59.Tsoy E, Kiekhofer RE, Guterman EL, et al. Assessment of Racial/Ethnic Disparities in Timeliness and Comprehensiveness of Dementia Diagnosis in California. JAMA Neurol. 2021. [DOI] [PMC free article] [PubMed] [Google Scholar]
Associated Data
This section collects any data citations, data availability statements, or supplementary materials included in this article.
Supplementary Materials
Supplementary Information