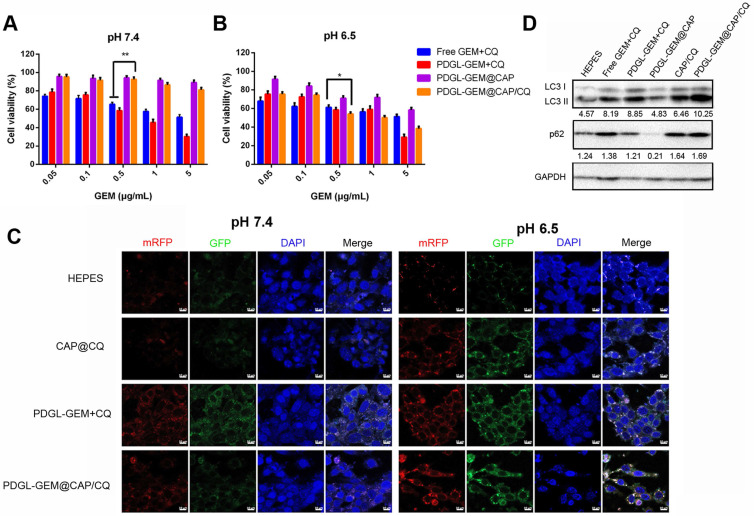
Figure 3.
Toxicity of different nanoparticle formulations against Pan 02 cells at (A) pH 7.4 or (B) pH 6.5 (n = 5, mean ± SD). * p < 0.05, ** p < 0.01. (C) Representative confocal micrographs of Pan 02 cells expressing mRFP-GFP-LC3 and treated for 4 h with the indicated nanoparticles at different pHs. Scale bar: 10 µm. (D) Levels of LC3 I, LC 3 II and p62 in Pan 02 cells incubated with the indicated nanoparticles at pH 6.5, based on western blot. Relative expression levels beneath the gel images were determined using Image J. Levels of p62 were normalized to those of GAPDH, and levels of LC3 II were normalized to those of LC3 I.

