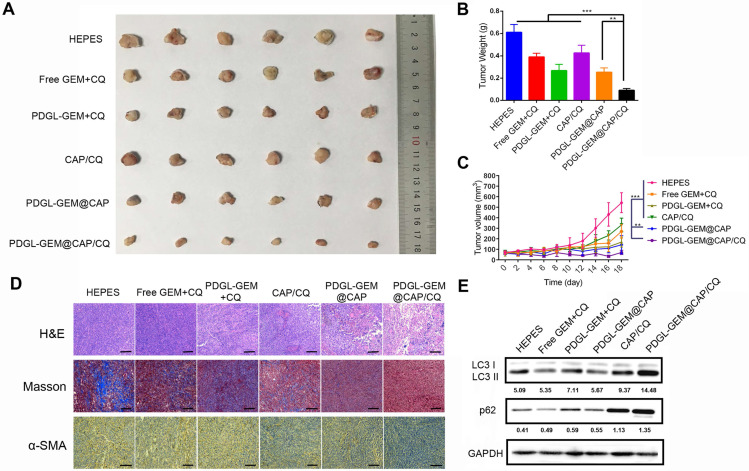
Figure 6.
Ability of different nanoparticles to inhibit Pan 02 xenograft growth in mice. (A) Photographs and (B) weights of tumors at day 18 after the first treatment. (C) Tumor volume (mean ± SD, n = 7). (D) Tumor slices stained with hematoxylin-eosin (H&E), Masson blue or antibody against α-SMA. Scale bar: 100 µm. (E) Levels of LC3 I, LC3 II and p62 in tumor tissue, as detected by western blot. Relative expression levels beneath the gel images were determined using Image J. Levels of p62 were normalized to those of GAPDH, while levels of LC3 II were normalized to those of LC3 I. ** p < 0.01, *** p < 0.001.

