Figure 7.
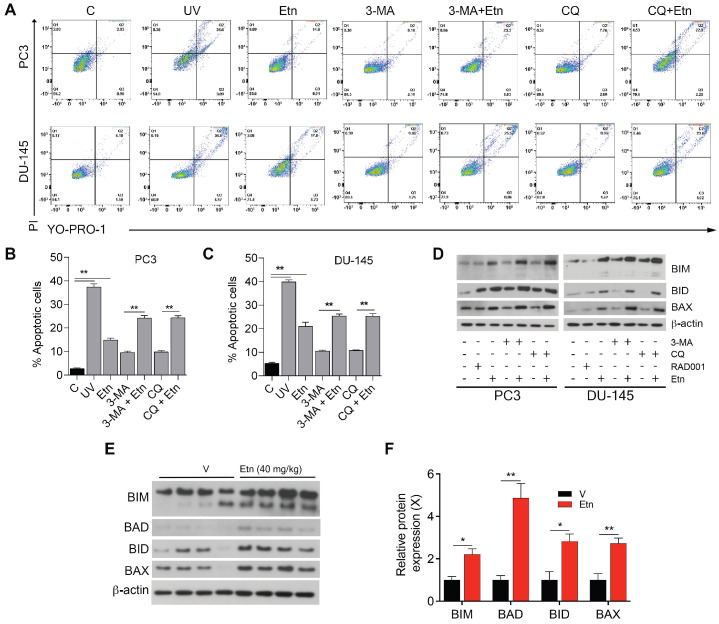
Etn treatment induces apoptosis in PCa cells. (A-C) Representative dot plots (A) and quantification of live and apoptotic PC3 (B) and DU-145 (C) cells in the presence of autophagic inhibitors or inducers. Q1: necrotic cells, Q2: late apoptotic cells, Q3: early apoptotic cells, and Q4: live cells. (D) Immunoblot of various apoptotic markers in PCa cells with and without Etn treatment and in the presence of autophagic inhibitors. (E-F) Immunoblots representing various apoptotic markers (E) and quantification bar graphs (F) in PC3 xenografts. Unpaired two-tailed Student's t-test with Welch's correction was used to determine the statistical significance (*P < 0.05, **P < 0.005, ***P < 0.0005). C = control (untreated PCa cells); PI: propidium iodide; UV: ultraviolet.

