

Abstract
Individual differences in brain network modularity at baseline can predict improvements in cognitive performance after cognitive and physical interventions. The present study is the first to explore whether brain network modularity predicts changes in cortical brain structure in 8- to 9-year-old children involved in an after-school physical activity intervention (N=62), relative to children randomized to a wait-list control group (N=53). For children involved in the physical activity intervention, brain network modularity at baseline predicted greater decreases in cortical thickness in the anterior frontal cortex and parahippocampus. Further, for children involved in the physical activity intervention, greater decrease in cortical thickness was associated with improvements in cognitive efficiency. The relationships among baseline modularity, changes in cortical thickness, and changes in cognitive performance were not present in the wait-list control group. Our exploratory study has promising implications for the understanding of brain network modularity as a biomarker of intervention-related improvements with physical activity.
Introduction
Preadolescence is a period of the lifespan characterized by significant developmental changes in brain structure, brain function, and cognition (Casey et al., 2008; Dahl, 2004; Giedd et al., 1996, 1999). As the brain is developing during childhood, this period of neurodevelopment may be particularly sensitive to environmental exposures and lifestyle factors (Andersen, 2003; Marco, Macri, & Laviola, 2011; Masten, 2004). There is increased scientific interest in developing interventions during childhood development, with the goal of improving the brain and cognition across the lifespan. Participation in physical activity and higher levels of aerobic fitness have been found to benefit cognitive and brain health in children (Chaddock et al., 2011, Erickson et al., 2019; Hillman et al., 2014, but see Donnelly et al., 2016 and Fedewa & Ahn, 2011 for mixed results). Higher levels of aerobic fitness and participation in physical activity during childhood are associated with superior scholastic performance (Castelli et al., 2007; Chomitz et al., 2009; Donnelly et al., 2016) as well as superior performance on tasks of executive function and memory (Buck et al., 2008; Chaddock et al., 2010a, 2010b; Hillman et al., 2014; Pontifex et al., 2011; Tomporowski et al., 2008; Voss et al., 2011).
Growing evidence suggests that the aerobic fitness and physical activity-related differences in scholastic and cognitive performance have a biological basis in brain structure and function (Chaddock-Heyman, Hillman, et al., 2014). As the brain is a complex system that is sensitive to individual differences as well as to maturational and experience-dependent changes over time, an important goal is to identify brain-based markers that relate changes in cognitive and brain health to physical activity intervention across the lifespan. Given individual differences in physical activity-induced changes in cognitive and brain health, scientists have begun to search for biomarkers of intervention-related plasticity. Such a predictive biomarker of cognitive and brain change may be especially useful during a sensitive period of childhood development when the developing brain is more susceptible to intervention.
Recent advances in network science have characterized the brain as a complex system, with nodes and edges that are differentially sensitive to change depending on their network properties (Bassett & Bullmore, 2006). These nodes are organized in structural and functional networks, that can be characterized as interconnected modules (Rubinov & Sporns, 2010). In particular, brain network modularity is a principle that quantifies the degree to which functional brain networks are divided into subnetworks. Higher modularity reflects a greater number of within-module connections and fewer connections between modules, and a highly modular brain is often interpreted as a brain that contains highly specialized brain networks with less integration between networks (Rubinov & Sporns, 2010). During childhood, functional modules are known to become more distinct and specialized, such that connectivity within modules increases and connectivity between modules decreases (Dosenbach et al., 2010; Fair et al., 2009; Gu et al., 2015; Satterthwaite et al., 2013). These changes likely boost cognitive performance by reducing interference between systems (Hampson et al., 2010).
Recent research has turned to how brain network modularity may lend insight into interventions such as physical and cognitive training interventions in children, young adults, older adults, and patients (e.g., traumatic brain injury) (Arnemann et al., 2015; Baniqued et al., 2018, 2019; Chaddock-Heyman et al., 2020; Gallen et al., 2016). In that regard, our research team recently demonstrated that greater pre-intervention brain network modularity predicted improvements in performance on tasks of executive function, cognitive efficiency and mathematics in 8-to 9-year-old children involved in an after-school physical activity intervention for 9 months (Chaddock-Heyman et al., 2020). In contrast, there were no associations between baseline brain network modularity and performance changes in the wait-list control group (Chaddock-Heyman et al., 2020). These findings converge with other research studies across the lifespan (see Gallen and D’Esposito, 2019 for review) to show that baseline brain network modularity predicts individual differences in sensitivity to interventions, specifically improvements in cognitive performance after an intervention (Arnemann et al., 2015; Baniqued et al., 2018, 2019; Gallen et al., 2016).
While the previous findings relate brain modularity to cognitive changes, less is known about how brain modularity relates to intervention-related changes in brain structure. It is likely that brain network modularity may predict not only intervention-related changes in cognitive performance, but also intervention-related changes in the brain. The present study is the first to explore whether brain network modularity may predict changes in cortical brain structure in children involved in a physical activity intervention, relative to children randomized to a wait-list control group. One measure of cortical structure is cortical thickness, calculated by generating models of gray/white matter boundaries and pial surfaces, and calculating the distance between these two surfaces (Fischl & Dale, 2000; Jones et al., 2000; Kabani et al., 2001; MacDonald et al., 2000).
Normative maturation of cortical thickness and aerobic fitness differences in cortical thickness provide a context to formulate predictions about the effects of physical activity participation on cortical thickness in 8- to 9-year-old children, as well as brain network modularity as a potential predictor of changes in cortical thickness with physical activity. One developmental study explored changes in brain structure between the age of 7 and 29 years using four separate longitudinal datasets (388 participants, 854 scans) and consistently showed decreasing cortical thickness with increasing age during late childhood and across adolescence (Tamnes et al., 2017). Another longitudinal study tracked children from age 5 to 11 and showed cortical thinning in frontal cortex, occipital-parietal areas, and temporal regions with development (Sowell et al., 2004). Further, cortical thinning in the frontal and parietal regions was correlated with improved performance on a task of vocabulary and verbal intelligence (Sowell et al., 2004). Indeed, gray matter loss may occur as the brain develops into a more mature system (Sowell et al., 2004, 2006; Tamnes et al., 2017).
In addition, our research team has demonstrated that 9- to 10-year-old higher fit children have decreased gray matter thickness in superior frontal cortex, superior temporal areas, and lateral occipital cortex, coupled with better mathematics achievement, compared to lower fit children (Chaddock-Heyman et al., 2016). Further, cortical gray matter thinning in anterior and superior frontal areas was associated with superior arithmetic performance. Given differences in cortical thickness in higher fit and lower fit children, it is likely that a daily physical activity program aimed to improve aerobic fitness may lead to greater changes in cortical thickness in active children, relative to typically developing children.
Together, given the literature on normative development of cortical thickness and aerobic fitness differences in cortical thickness (with decreased thickness associated with both maturation [Sowell et al., 2004, 2006] and higher levels of aerobic fitness [Chaddock-Heyman et al., 2016]), we predicted that 8- to 9-year-old children who participated in an after-school physical activity intervention over a 9 month school year would show greater decreases in cortical thickness relative to children in a wait-list control group. Further, given that modularity may act as a biomarker of intervention-related changes, brain network modularity may predict the physical activity-induced changes in cortical thickness, particularly in frontal and temporal areas important for cognition during brain development in childhood (Chaddock-Heyman et al., 2016; Sowell et al., 2004).
The primary goal of the present study was to understand whether brain network modularity can be useful as a biomarker of physical activity intervention-related changes in cortical thickness. That is, does baseline (pre-intervention) brain network modularity predict the amount of change (post-intervention minus pre-intervention) in cortical thickness in children who participated in the physical activity intervention? We hypothesized that children in the physical activity intervention with higher baseline modularity would show greater decrease in cortical thickness compared to those with lower modularity. Further, we predicted that intervention-related decreases in cortical thickness would be associated with improvements in cognitive performance in children involved in the physical activity intervention. We did not predict associations between baseline brain network modularity, changes in cortical thickness, and changes in cognitive performance in the wait-list control group.
Method
Seven- to 9-year-old prepubescent (Tanner pubertal timing score < 2; Tanner et al., 2001) and right handed (Oldfield, 1971) children were recruited from schools in East-Central Illinois. Eligible child participants were required to have an absence of neurological disorders, adverse health conditions, physical incapacities, or school-related learning disabilities (i.e., individual education plan related to learning), report no use of medications that influence central nervous system function, and successfully complete a mock MRI session to screen for claustrophobia in an MRI machine. Children also completed the Woodcock Johnson III paper-and-pencil test to assess intelligence quotient (IQ) (Woodcock, 1997).
Children signed an informed assent approved by the Institutional Review Board of the University of Illinois at Urbana-Champaign. A legal guardian also provided written informed consent in accordance with the Institutional Review Board of the University of Illinois at Urbana-Champaign. Socioeconomic status (SES) was determined by a guardian completing information about participation in free or reduced-price meal program at school, the highest level of education obtained by the mother and father, and the number of parents who worked full-time (Birnbaum et al., 2002).
Two hundred seventy-two children were randomized to the FITKids2 physical activity intervention. The goal of the present study was to understand whether pre-intervention brain network modularity predicted intervention-related changes in cortical thickness, and whether changes in cortical thickness were associated with changes in cognitive performance. Thus, we included children with high quality pre-intervention resting state data (for baseline modularity), pre- and post-intervention brain structure data (for cortical thickness changes across time), and pre- and post-intervention cognitive data. One hundred eighty-two children completed both the structural and resting state MRI scan at baseline (pre-intervention). One hundred thirty-four children completed the structural MRI scan post-intervention. Functional scans were excluded if more than 20% of volumes exhibited framewise displacement (FD) above 0.2 mm or if mean relative motion was greater than 0.5 mm (leading to the exclusion of 11 children pre-intervention). In addition, children were excluded due to inaccurate gray-white tissue segmentation and motion noise in the reconstructed structural image (N=11 pre-intervention, N=12 post-intervention). Cognitive and brain measures +/− 3 standard deviations from the mean were excluded (N=2 outlier exclusions for baseline brain network modularity; N=4 outlier exclusions for cortical thickness).
The present study included a total of 115 children: 62 children in the physical activity intervention (36 girls and 26 boys, mean age = 8.7 years, age range 7.8–9.9 years, grades 2–4) and 53 children in the wait-list control group (25 girls and 28 boys, mean age = 8.6 years, age range 7.9–9.9 years, grades 2–4). See Table 1 for participant information.
Table 1.
Mean (SD) for physical activity and wait list control groups at baseline (pre-intervention) and post-intervention.
| Physical Activity | Control | |||
|---|---|---|---|---|
| Baseline | Post | Baseline | Post | |
| Age (years) | 8.7 (0.6) | -- | 8.6 (0.5) | -- |
| Gender | 36 Female 26 Male |
-- | 25 Female 28 Male |
-- |
| IQ (General) | 109.0 (13.9) | -- | 111.3 (12.8) | -- |
| Pubertal timing | 1.4 (0.4) | -- | 1.3 (0.3) | -- |
| SES | 2.0 (0.8) | -- | 1.9 (0.8) | -- |
| VO 2 max (mL/kg/min) | 43.1 (7.4) | 43.2 (8.0) | 42.9 (7.0) | 42.7 (7.0) |
| VO 2 max percentile | 39.0 (30.3) | 39.2 (30.6) | 35.5 (30.0) | 35.1 (30.4) |
| VO 2 max (fat-free) | 61.7 (7.3) | 60.8 (11.6) | 61.7 (8.0) | 60.6 (10.6) |
| Executive Processes (WJ) | 107.9 (10.5) | 112.5 (8.5) | 110.2 (10.0) | 112.9 (9.4) |
| Cognitive Efficiency (WJ) | 99.0 (19.1) | 101.3 (16.8) | 99.3 (13.6) | 105.7 (14.9) |
| Modularity (6%) | 0.48 (0.07) | -- | 0.47 (0.07) | -- |
| Thickness (mm): | ||||
| Anterior Frontal * | 3.4 (0.35) | 3.2 (0.26) | 3.4 (0.37) | 3.3 (0.27) |
| Middle Frontal | 3.0 (0.27) | 2.9 (0.14) | 3.1 (0.27) | 3.0 (0.14) |
| Superior Frontal | 3.3 (0.28) | 3.2 (0.14) | 3.3 (0.28) | 3.2 (0.14) |
| Superior Temporal | 3.2 (0.22) | 3.1 (0.13) | 3.2 (0.20) | 3.2 (0.12) |
| Inferior Temporal | 3.1 (0.22) | 3.1 (0.14) | 3.2 (0.23) | 3.1 (0.14) |
| Parahippocampus * | 3.0 (0.30) | 2.9 (0.21) | 3.0 (0.31) | 3.0 (0.23) |
| Superior Parietal | 2.7 (0.23) | 2.5 (0.12) | 2.7 (0.21) | 2.6 (0.10) |
| Inferior Parietal | 3.0 (0.25) | 2.9 (0.12) | 3.0 (0.23) | 2.9 (0.11) |
Note: Woodcock Johnson III paper and pencil tasks (Woodcock, 1997); SES – Socioeconomic Status (Low: < 2; Moderate: 2-3; High, >3).
p<0.05: Association between baseline network modularity and change in cortical thickness.
Aerobic Fitness
Children completed a VO2max test to assess aerobic fitness. Each child’s aerobic fitness level was measured as maximal oxygen consumption (VO2max) during a graded exercise test.
The graded exercise test was administered on a LifeFitness 92T motor-driven treadmill (LifeFitness, Schiller Park, IL). A modified Balke Protocol was used, and expired gases were analyzed using a TrueOne2400 Metabolic Measurement System (ParvoMedics, Sandy, Utah). Children ran and/or walked on a treadmill at a constant speed with increasing grade increments of 2.5% every 2 minutes until volitional exhaustion occurred.
Oxygen consumption was measured using a computerized indirect calorimetry system (ParvoMedics True Max 2400) with averages for VO2 and respiratory exchange ratio assessed every 20 seconds. A polar heart rate monitor (Polar WearLink+ 31; Polar Electro, Finland) was used to measure heart rate throughout the test. Ratings of perceived exertion were also assessed every 2 minutes using the children’s OMNI scale (Utter et al., 2002).
Maximal oxygen consumption was expressed in mL/kg/min. VO2max was based upon maximal effort as evidenced by (1) a plateau in oxygen consumption corresponding to an increase of less than 2 mL/kg/min despite an increase in workload; (2) a peak HR ≥ 185 beats per minute (American College of Sports Medicine, 2006) and a HR plateau (Freedson & Goodman, 1993); (3) RER ≥ 1.0 (Bar-Or, 1983); and/or (4) a score on the children’s OMNI ratings of perceived exertion (RPE) scale ≥ 8 (Utter et al., 2002).
We report relative VO2max (mL/kg/min, with kg as body weight), VO2max percentile (aerobic fitness percentile based on age and gender), and fat free VO2max (mL/kg lean/min).
In all children, body composition was measured using dual energy x-ray absorptiometry (DXA) (Hologic Discovery bone densitometer (software version 12.7.3; Hologic, Bedford, MA). DXA measures are known to be a valid and accurate measure of body composition in children (Goran et al., 1996, 2000) and allow for the distinction between lean mass and fat mass. Fat free VO2max (mL/kg lean/min) was calculated using absolute VO2max (liters of oxygen consumed per minute) and lean mass as measured from DXA. Fat free VO2max helps to reduce the collinearity between whole body adiposity and aerobic fitness by adjusting for lean mass rather than total weight.
Physical Activity Training Intervention and Wait List Control Group
The after school physical activity program (Fitness Improves Thinking for Kids - FITKids) was designed to increase physical activity and improve aerobic fitness and muscular fitness. The program, adapted from the Coordinated Approach to Child Health (CATCH) curriculum (McKenzie et al., 1994), was developmentally appropriate for children in grades K-5. The physical activity intervention occurred for 2 hours after each school day for 150 days.
A non-competitive environment was created for children to participate in integrated fitness activities, motor skill learning and practice, and low-organizational games (Castelli et al., 2011). Within a daily lesson, children participated in moderate to vigorous physical activity (defined as >70% of heart rate max based on maximal heart rate from an incremental exercise test at pre-test; recorded by heart rate monitors and pedometers) for 30–35 sustained minutes and then intermittently up to 90 minutes. Thus, the child participants exceeded the national physical activity guideline of 60+ minutes of moderate to vigorous physical activity per day (USDHHS, Physical Activity Guidelines for Americans, 2018) (Centers for Disease Control and Prevention, 2012). Additional program details are published in Castelli, Hillman et al. (2020).
Children were randomly assigned to either the physical activity intervention group or a wait-list control group (a group of typically developing children over 9 months) for one academic school year (150 days). Both groups completed all baseline and post-intervention sessions. Children in the wait-list control group were given the opportunity to participate in the physical activity program during the following school year without involvement in any testing (as incentive to stay in the study).
Please see the footnote for accelerometry data which suggests that the FITKids physical activity intervention increased physical activity in children randomly assigned to the intervention.
Brain Structure
We analyzed brain structure at baseline and post-intervention to test the effects of the physical activity intervention on cortical thickness, as well as to test whether pre-intervention brain network modularity predicted intervention-related changes in cortical thickness.
High-resolution T1-weighted structural brain images were acquired before and after the intervention using a 3D MPRAGE (Magnetization Prepared Rapid Gradient Echo Imaging) protocol with the following parameters: GRAPPA acceleration factor 2, voxel size = 0.9 × 0.9 × 0.9mm, TR = 1,900ms, TI = 900ms, TE = 2.32ms, flip angle = 9, FoV = 230 mm. All images were collected on a 3-T head-only Siemens Allegra MRI scanner.
Brain tissue segmentation and reconstruction of cortical surface models were performed on T1-weighted structural MRI images via the standard recon-all image processing pipeline available in FreeSurfer version 5.3 (http://surfer-nmr.mgh.harvard.edu/). FreeSurfer labels cortical surfaces via the Desikan-Killiany cortical parcellation atlas (see Desikan et al., 2006 for the labeling protocol; S’egonne et al., 2004).
We applied the following processing stream to each participant’s structural image via FreeSurfer’s recon-all processing pipeline: (1) non-brain tissue removal, (2) Talairach transformation, (3) creation of representations of the gray/white matter boundaries (Dale et al., 1999, Dale and Sereno, 1993), and (4) calculation of the cortical thickness as the distance between the gray/white matter boundary and the pial surface in all regions of interest (Fischl and Dale, 2000). Talairach transforms, skull stripping, gray–white tissue segmentation, and surface reconstructions were visually checked for errors. Children were excluded due to inaccurate gray-white tissue segmentation and/or motion noise in the reconstructed structural image.
Regions of interest available via FreeSurfer cortical parcellations include frontal cortex (anterior, middle and superior frontal cortex), parietal cortex (superior and inferior parietal cortex), and temporal cortex (superior temporal cortex and parahippocampus) as offered in FreeSurfer’s segmentation algorithms (Klein and Tourville, 2012). These areas provide an exploratory analysis of the whole brain and include regions associated with aerobic fitness during childhood (superior frontal cortex, superior temporal cortex) (Chaddock-Heyman et al., 2016) and regions that are most sensitive to change in the participants’ age range during development, which include frontal cortex and temporal cortex (Sowell et al., 2004; Tamnes et al., 2017). Cortical thickness was measured in mm.
Brain Network Modularity Analysis
We analyzed pre-intervention brain network modularity to test whether modularity predicted changes in cortical thickness with the physical activity intervention.
Preprocessing.
All image processing and analyses were carried out with a script library containing tools from FSL 5.0.4 (Functional Magnetic Resonance Imaging of the Brain’s Software Library, http://www.fmrib.ox.ac.uk/fsl), AFNI (http://afni.nimh.nih.gov/afni), FreeSurfer (http://surfer.nmr.mgh.harvard.edu), and MATLAB (The MathWorks, Natick, MA, USA) (Weng et al., 2017, Voss et al., 2016).
Initial preprocessing of the resting state fMRI data involved motion correction using ANFI’s 3dvolreg (6 degree-of-freedom rigid-body), global 4D median intensity normalization, skull-stripping (FSL BET), and spatial smoothing (6.0 mm full-width at half-maximum). Then, motion-related artifacts were denoised using ICA-AROMA (Pruim et al., 2015). Rather than censoring motion-contaminated timepoints from the data, ICA-AROMA removes motion-related variance from the BOLD data. Therefore, the denoised volumes retain all time points from the preprocessed data. ICA-AROMA yielded 28.4 ± 5.9 total independent components from the data, and it classified 16.7 ± 5.9 components as motion-related artifacts which were regressed out of the data (57.5 ± 13.0% of total components).
After ICA-AROMA, the denoised data were temporally bandpassed (.008 < f < 0.08 Hz) to reduce high frequency physiological signals (e.g., cardiac pulse) and low frequency scanner drift and isolate the spontaneous, low frequency neuronal fluctuations of the BOLD fMRI signal (Leopold et al., 2003, Salvador et al., 2005). Nuisance signals (white matter, cerebrospinal fluid, global signal, and 6 motion parameters) were extracted from the bandpassed data and regressed out of the resting state fMRI data.
Participant-level functional scans were transformed into standard MNI space through a multi-step procedure. First, each anatomical image was skull-stripped and manually corrected for errors. Skull-stripped anatomical images were transformed to standard MNI space using FSL’s Nonlinear Image Registration Tool (FNIRT) with the default 10 mm warp resolution (Andersson et al., 2007a, Andersson et al., 2007b). Functional data were then transformed to corresponding anatomical images using the boundary-based registration (BBR) algorithm (Greve & Fischl, 2009). The two resulting transformations were concatenated and then applied to the original functional image to create a functional image in standard MNI space.
Network modularity analysis.
Our primary aim was to characterize modularity, a global measure of network connectivity which compares the number of within-module connections to the between-modules number of connections. Modules were identified in a data-driven fashion using Newman’s spectral community detection that optimizes modularity for each subject (Newman, 2006).
Module nodes were based on a 400-area functional parcellation defined by Schaefer et al. (2018), and the average time series was extracted for each module. Then, for each participant, a 400 x 400 Pearson’s correlation matrix was generated and transformed with a Fisher z-transformation. Following previous reports, the resulting correlation matrices were thresholded and binarized over a range of connection density thresholds (2% - 10% at 2% increments) (Baniqued et al., 2018, 2019; Gallen et al., 2016; Power et al., 2011, 2012). Modularity was calculated from unweighted and undirected correlation matrices using the modularity_und tool from the Brain Connectivity Toolbox (https://sites.google.com/site/bctnet/measures). The middle threshold, i.e. 6% of the overall connection density thresholds, was used for our primary analyses, and we verified the effects remain at the other thresholds.
Woodcock Johnson Battery of Cognitive Tasks
Child participants completed subtests from the Woodcock Johnson III Tests of Cognitive Abilities (WJ III) (Woodcock, 1997). Participants completed individual cognitive tests, and combinations of the individual tests form clusters to represent categories of broad cognitive abilities. For cognitive clusters, a higher score reflects higher performance. Given that baseline modularity predicted changes in executive function and cognitive efficiency in children (Chaddock-Heyman et al., 2020), we included these two cognitive constructs.
The cognitive cluster of Executive Processes includes tasks of cognitive flexibility and rule switching, sequential reasoning and spatial scanning, and attention and interference control. The cognitive cluster of Executive Processes includes three tasks:
Concept Formation provides a measure of cognitive flexibility, rule application, and rule switching. During this task, participants were asked to identify rules and concepts that created geometric shapes.
Planning provides a measure of sequential reasoning and spatial scanning. During this task, participants were asked to trace unique shapes without retracing or picking up the pencil.
Pair Cancellation provides a measure of attention, concentration and interference control. During this 3-minute task, participants were asked to circle two target shapes when the shapes appeared in a sequence.
The cognitive cluster of Cognitive Efficiency represents perceptual speed, short term memory, and the ability to store and recode information. The cognitive cluster of Cognitive Efficiency includes two tasks:
Visual Matching provides a measure of perceptual speed. During this 3-minute task, participants were asked to quickly find and circle two identical numbers in a row of six numbers.
Numbers Reversed provides a measure of short term memory and the ability to temporarily store and recode information. During this task, participants were asked to repeat a span of random numbers in reverse order.
Statistical Analysis
To explore the effect of time and physical activity intervention on aerobic fitness and cortical thickness, we conducted 2 (Group: intervention, wait-list) x 2 (Time: baseline, post-intervention) repeated measures analysis of variance (ANOVAs). Separate repeated measures analysis of variance (ANOVAs) were conducted for each brain region.
Our primary goal was to understand whether brain network modularity at baseline predicted intervention-related changes in brain structure, particularly cortical thickness. Linear regressions were used to test associations between brain modularity at baseline (pre-intervention) and change in cortical thickness. Separate regressions were performed for children assigned to the physical activity intervention group and children assigned to the wait-list control group. Change scores were computed as the difference in post-intervention and pre-intervention (or baseline) scores for each participant. T-scores and standardized betas (β) are presented.
The alpha level for all tests was set at p < .05. Given the exploratory nature of our investigation and our a priori hypotheses, we reported associations uncorrected for multiple comparisons. We also reported marginal results (p<0.1) to provide a foundation for future work.
Results
Brain network modularity at baseline was not significantly associated with age (r=−0.019, p=0.84), sex (r=0.013, p=0.89), SES (r=0.071, p=0.45), IQ (r=−0.003, p=0.98), pubertal timing (r=0.062, p=0.52), aerobic fitness (VO2max) (r=0.072, p=0.45), or in-scanner motion (mean of framewise displacement (r=−0.144, p=0.13). In addition, children randomly assigned to the physical activity group did not differ in terms of age, sex, SES, IQ, pubertal timing, aerobic fitness, or in-scanner motion (mean of framewise displacement), relative to children randomly assigned to the wait-list control group (all p > 0.05).
Aerobic fitness and Physical Activity
There was no main effect of Time or Group x Time interaction for aerobic fitness (VO2max relative, VO2max percentile, or fat-free VO2max) (all p > 0.05).
Changes in cortical thickness across time and intervention
To begin, we explored the effects of time and the physical activity intervention on cortical thickness. As hypothesized, there was a main effect of Time for all cortical thickness regions (p<0.05), with both the physical activity group and wait-list control groups showing decreases in cortical thickness from pre-intervention to post-intervention (Table 1).
The Group (physical activity intervention, wait-list control) x Time (baseline, post-intervention) interaction did not reach significance for any of the cortical thickness regions (p>0.05), which suggests that the physical activity group did not show significantly greater decreases in cortical thickness than the control group.
Because of our a priori hypotheses predicting associations between baseline brain network modularity and changes in cortical thickness with an intervention, we explored associations between baseline brain network modularity and change in cortical thickness by group.
Baseline modularity and change in cortical thickness
For children randomized to the 9-month after-school physical activity intervention, higher brain network modularity at baseline was positively associated with change in cortical thickness in the anterior frontal cortex (F=4.185, β=1.276, t=2.046, p=0.045) (Figure 1) and parahippocampus (F=4.941, β=0.877, t=2.223, p=0.030) (Figure 2).
Figure 1.
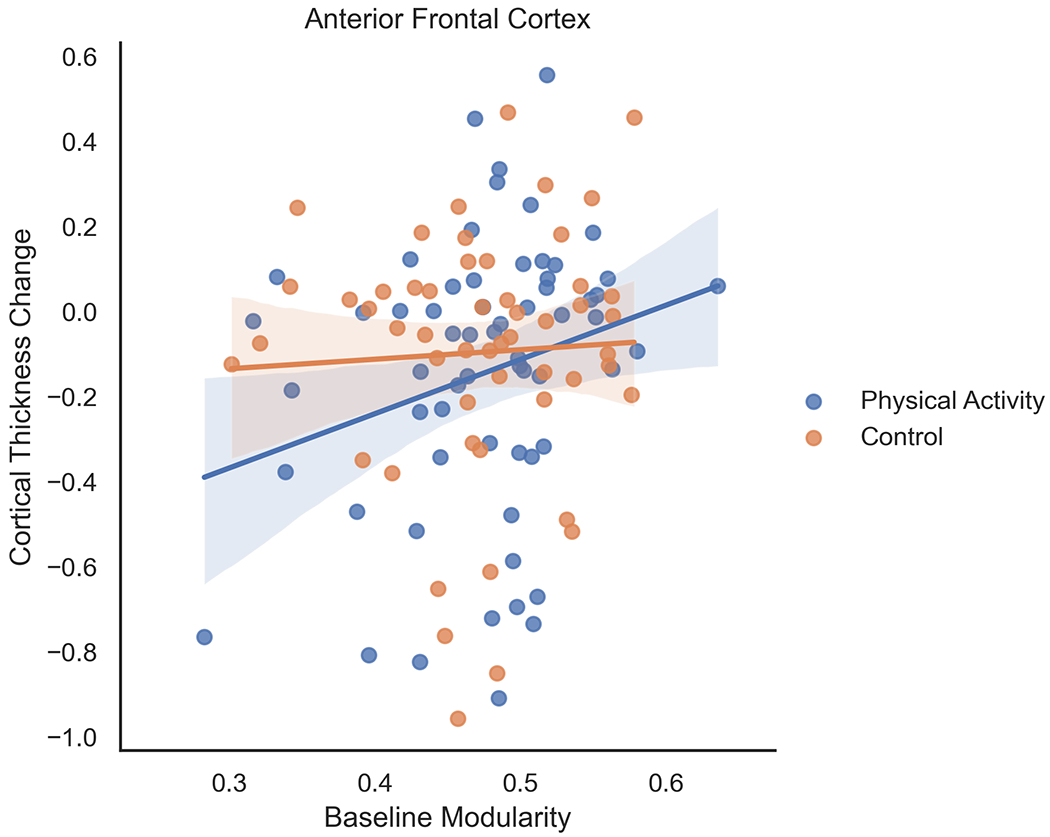
For children randomized to the 9-month after-school physical activity intervention, higher brain network modularity at baseline was positively associated with change in cortical thickness in the anterior frontal cortex. Brain network modularity at baseline did not positively predict changes in cortical thickness of the anterior frontal cortex in children in the wait-list control group. Change scores were computed as the difference in post-intervention and pre-intervention (or baseline) scores for each participant
Figure 2.
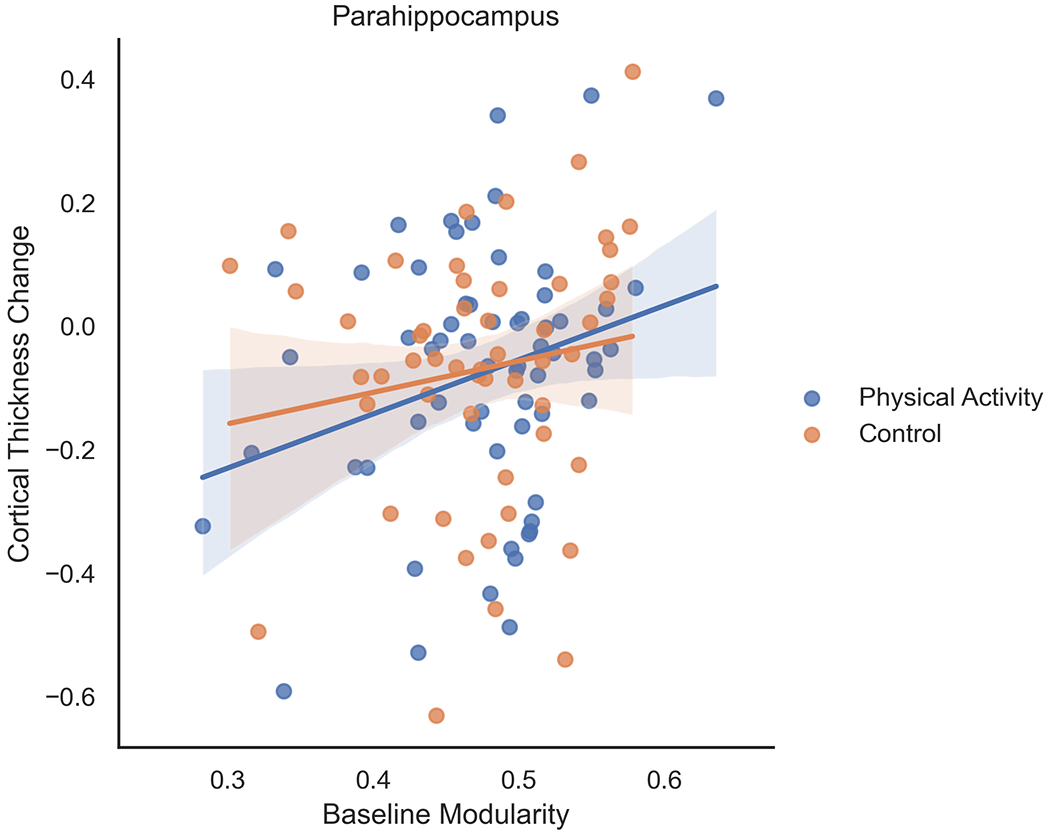
For children randomized to the 9-month after-school physical activity intervention, higher brain network modularity at baseline was positively associated with change in cortical thickness in the parahippocampus. Brain network modularity at baseline did not positively predict changes in cortical thickness of the parahippocampus in children in the wait-list control group. Change scores were computed as the difference in post-intervention and pre-intervention (or baseline) scores for each participant
For children randomized to the 9-month after-school physical activity intervention, baseline modularity was marginally associated with change in cortical thickness in middle frontal cortex (F=3.222, β=0.226, t=1.795, p=0.078), middle temporal cortex (β=0.222, t=1.765, p=0.083), and superior temporal cortex (F=3.598, β=0.238, t=1.897, p=0.063). There were no significant associations between baseline modularity and change in superior frontal thickness (F=2.484, β=0.199, t=1.576, p=0.120), superior parietal thickness (F=1.218, β=0.141, t=1.104, p=0.274), or inferior parietal thickness (F=0.741, β=0.110, t=0.861, p=0.393).
We confirmed that the associations between brain network modularity at baseline and change in cortical thickness remained significant in the physical activity group when controlling for age, sex, SES, IQ, pubertal timing, aerobic fitness, and in-scanner motion (mean of framewise displacement).
Brain network modularity at baseline did not positively predict changes in cortical thickness in children in the wait-list control group (anterior frontal cortex: F=0.223, β=0.067, t=0.472, p=0.639; middle frontal cortex: F=1.561, β=0.176, t=1.249, p=0.217; superior frontal cortex: F=1.259, β=0.158, t=1.122, p=0.267; superior temporal cortex: F=1.300, β=0.161, t=1.140, p=0.260; inferior temporal cortex: F=0.432, β=0.094, t=0.658, p=0.514; parahippocampus: F=1.472, β=0.171, t=1.213, p=0.231; superior parietal cortex: F=0.992, β=0.141, t=0.996, p=0.324; inferior parietal cortex: F=0.783, β=0.125, t=0.885, p=0.380).
Change in cortical thickness and change in cognitive performance
For children randomized to the physical activity intervention, greater changes in cortical thickness (in regions significantly associated with baseline modularity) were positively associated with change in Cognitive Efficiency (Anterior frontal cortex: r=0.178, p=0.062 [marginal]; Parahippocampus: r=0.231, p=0.015). There were no associations between change in cortical thickness and change in Executive Processes.
Change in cortical thickness was not significantly associated with change in cognitive performance in children in the wait-list control group.
Discussion
The present study was the first to explore whether brain network modularity may predict intervention-related changes in brain structure. Indeed, higher brain network modularity at baseline predicted greater changes (i.e., decreases) in cortical thickness in children involved in an after-school physical activity intervention for 9 months. Specifically, for children involved in the physical activity intervention, brain network modularity at baseline predicted greater decreases in cortical thickness in the anterior frontal cortex and parahippocampus. Further, for children involved in the physical activity intervention, greater change (i.e. decrease) in cortical thickness in the parahippocampus was associated with improvements in cognitive efficiency, which involves perceptual speed, short term memory, and the ability to store and recode information. Similarly, a trend (p=0.06) was observed for the association between change in cortical thickness in the anterior frontal cortex and improvements in cognitive efficiency. The relationships between baseline modularity, changes in cortical thickness, and changes in cognitive performance were not present in the wait-list control group.
In a recent report, our research team was the first to suggest that brain network modularity predicted changes in cognitive and academic performance (particularly, executive function, cognitive efficiency and mathematics achievement; Chaddock-Heyman et al., 2020) following a physical activity intervention during childhood. Here, we extend the predictive power of modularity to include intervention-related changes in brain structure. We also significantly extend previous work which demonstrates that brain network modularity at baseline predicts improvements in cognitive performance with physical and cognitive interventions in children, younger adults, older adults, and patients (Arnemann et al., 2015; Baniqued et al., 2018, 2019; Gallen et al., 2016; see Gallen and D’Esposito, 2019 for review). Our study has promising implications for the understanding of brain network modularity as a ubiquitous and unifying biomarker of intervention-related cognitive and brain improvements with physical activity.
Our results also support research about normative development of cortical thickness, with cortical thinning associated with brain maturation (Geidd et al., 1999, Gogtay et al., 2004; Sowell et al., 2004, 2006; Tamnes et al., 2017). Indeed, over time (9 months), children in our study, regardless of group assignment, showed significant decreases in cortical thickness in brain regions across the cortex. Children in the physical activity intervention did not show significantly greater decreases in cortical thickness compared to typically developing 8- to 9-year-old children across 9 months (i.e., non-significant Group x Time interaction), perhaps due to developmental effects that obscured any potential benefits of the intervention. Further, we did not observe a significant effect of our physical activity intervention on aerobic fitness, which suggests that the physical activity dose provided in our intervention did not modulate aerobic fitness levels. The lack of aerobic fitness effects may help explain the lack of Group x Time interactions for cortical brain structure.
Critically, baseline modularity was only associated with decreases in cortical thickness in children involved in the physical activity intervention, not in the wait-list control group. The finding that baseline modularity predicted decreases in cortical thickness for children who received the intervention but not for those not involved in an intervention adds support for the idea that brain network modularity may be a biomarker of intervention-related changes (Gallen and D’Esposito, 2019). One explanation for this is that individuals with a more modular network organization may be better able to reconfigure modules in their brain in response to new environments and experiences, including physical activity interventions (Kashtan & Alon, 2005), thereby capitalizing on plasticity. A more modular network may also help with faster processing of information, learning, and problem solving, as well as greater adaptability to new environments and varying task goals given increased flexibility (Gallen & D’Esposito, 2019). Further, change in cortical thickness and change in cognitive performance were only significantly associated in children involved in the intervention. It is possible that involvement in a multimodal and enriched after-school program, which included aerobic, motor, and social activities as well as a brief educational component, strengthens the relationship between the brain and behavior.
The present study is exploratory, as the first investigation to examine associations between brain network modularity and intervention-related changes in brain structure. Our study provides a foundation for future work, and future investigations are encouraged, especially given that we focused on a priori brain regions and reported results uncorrected for multiple comparisons. We suggest that brain network modularity is a specific predictor of change in brain structure following intervention during preadolescence, with network properties significantly predicting changes in cortical thickness in the anterior frontal cortex and parahippocampus. In addition, we show trends for near significant positive associations between baseline modularity and change in cortical thickness in middle frontal cortex, middle temporal cortex, and superior temporal cortex in children involved in the physical activity intervention. Indeed, the frontal and temporal cortex are known to develop during childhood, and these brain regions have implications for cognition (Sowell et al., 2004). The anterior frontal cortex is known to play a role in problem solving, reasoning, and planning (Koechlin et al., 1999), and the parahippocampus is said to play a role in memory.
Interestingly, the specific frontal and temporal brain regions predicted by modularity with the physical activity intervention were not the brain areas that showed significant differences in cortical thickness in higher fit and lower fit children (Chaddock-Heyman et al., 2016). When our research team compared higher fit and lower fit children in terms of cortical thickness (Chaddock-Heyman et al., 2016), higher fit children showed decreased thickness in superior frontal cortex and superior temporal cortex. In the present study, children in the physical activity intervention also showed decreases in thickness across time in these regions of the frontal and temporal cortex, but baseline modularity only significantly predicted changes in thickness in anterior frontal and parahippocampal cortex. The complex interactions among aerobic fitness and physical activity on developing brain structure provide important questions and discussion for future work. Future research may examine whether baseline modularity predicts other changes in brain structure and function (e.g., brain network connectivity, white matter microstructure, neuroelectric indices), and whether the relationships between modularity and other brain outcomes have implications for cognition and academic performance. In addition, future research should explore changes in cortical brain structure over time via the FreeSurfer longitudinal whole-brain pipeline (to complement the ROI approach). It will also be important to explore lifestyle factors associated with optimal brain network properties that help individuals benefit from interventions. What factors help increase brain network modularity? Finally, while we considered children in the wait-list control group to be typically developing children over 9 months, future studies would benefit from an active control group. The use of a wait-list control group did not allow us to measure physical activity participation in the control group, so we were unable to adjust for habitual physical activity in all participants. However, the accelerometry data presented in the footnote suggest that our intervention increased physical activity in children randomly assigned to the physical activity intervention group.
In conclusion, our study has important implications for biomarkers of cognitive and neural plasticity in preadolescent children. The results support and extend the framework that brain network properties may capture individual differences in neuroplasticity that promote cognitive and brain enhancement (Gallen & D’Esposito, 2019). In particular, our study is the first to suggest that brain network modularity may act as a predictor of changes in brain structure with a physical activity intervention during childhood. The results raise the possibility that network-level assessments of the brain may be used as predictive biomarkers to guide the design and customization of interventions in order to maximize cognitive and brain outcomes for individual children. Our work provides initial understanding of optimal brain network properties that help individuals best respond to intervention and training.
Acknowledgements
This work was supported by the National Institutes of Health (HD069381).
Footnotes
To help confirm that our physical activity intervention increased physical activity participation in children in the intervention group, accelerometry data was collected in a sub-sample of children from the FITKids2 trial.
Specifically, a sub-sample of child participants wore a triaxial wGT3X+ accelerometer (ActiGraph LLC., Pensacola, FL, USA) on the waist at the right anterior axillary line on an elastic belt. The accelerometer had a dynamic range of ±6 g and was initialized to record acceleration at 100 Hz. Children wore the accelerometer during waking hours except during water-based activities.
We collected accelerometry data for 18 children in the physical activity intervention group, who wore an accelerometer at baseline (pre-intervention) and during the last week of the physical activity intervention. We also collected accelerometry data in 16 children in the wait list control group, who wore an accelerometer at baseline (pre-intervention) and at post-test.
ActiLife software version 6.13.4. (ActiGraph LLC) was used to calculate time spent in physical activity (min/day). To adjust for accelerometer wear time, we also calculated a percentage of wear time spent in moderate to vigorous physical activity MVPA by dividing MVPA min/day by wear time (min/day) and multiplying by 100. All statistics were consistent when examining MVPA (min/day) or %MVPA. Here we present the statistics for %MVPA.
There were no statistically significant differences in daily MVPA at baseline between the intervention (M=59.0 min/day, SD=22.26; M=7.3% %MVPA/wear time, SD=2.6%) and the wait list control (M=57.0 min/day, SD=16.1; M=7.2% %MVPA/wear time, SD=1.9%) groups (t (44) = 0.308, p=0.76).
As hypothesized, in the sub-sample of children wearing the accelerometer, children involved in the after-school physical activity intervention showed significant within-group increases in MVPA from pre-intervention to the last week of the intervention (M=78.81 min/day, SD=31.10; M=7.7% MVPA, SD=2.8%) (paired t-test: t (17) = 2.332, p=0.032).
In contrast, no change in daily MVPA from baseline to post-intervention (M=52.52 min/day, SD=10.71; M=6.35% MVPA, SD=1.3%) was observed in the wait-list control group (t (15) = 1.999, p=0.064). Note the trend for a decrease in daily MVPA over time in the wait-list control group, which fits the literature showing an age-related decline in children’s physical activity.
At post-test, children in the intervention group recorded higher daily MVPA compared to the wait list control group. That is, there was a statistically significant difference in daily MVPA measured at post-test between children in the physical activity intervention (M=71.2 min/day, SD=14.65; M=9.0% MVPA, SD=1.4%) and children in the wait list control group (M=52.42 min/day, SD=10.71; M= 6.0% MVPA, SD=1.5%) (t (21) = 4.210, p<0.0001).
Together, the accelerometry data suggest that our intervention increased physical activity in children randomly assigned to the physical activity intervention group. Note that the 2 (Group: Intervention, Control) x 2 (Time: baseline MVPA, post-test MVPA) interaction was not statistically significant in our small sample, and future research should collect accelerometry data on all participants.
References
- Andersen SL (2003). Trajectories of brain development: Point of vulnerability or window of opportunity? Neuroscience & Biobehavioral Reviews. 27: 3–18. 10.1016/s0149-7634(03)00005-8 [DOI] [PubMed] [Google Scholar]
- Andersson JR, Jenkinson M, and Smith S (2007a). TR07JA1: Non-Linear Optimisation. Available online at: https://www.fmrib.ox.ac.uk/analysis/techrep. Accessed August 9, 2020. [Google Scholar]
- Andersson JR, Jenkinson M, and Smith S (2007b). TR07JA2: Non-Linear Registration, Aka Spatial Normalisation. Available online at: https://www.fmrib.ox.ac.uk/analysis/techrep. [Google Scholar]
- Arnemann KL, Chen AJW, Novakovic-Agopian T, Gratton C, Nomura EM, and D’Esposito M (2015). Functional brain network modularity predicts response to cognitive training after brain injury. Neurology 84, 1568–1574. 10.1212/WNL.0000000000001476 [DOI] [PMC free article] [PubMed] [Google Scholar]
- Baniqued PL, Gallen CL, Kranz MB, Kramer AF, and D’Esposito M (2019). Brain network modularity predicts cognitive training-related gains in young adults. Neuropsychologia. 131, 205–215. 10.1016/j.neuropsychologia.2019.05.021 [DOI] [PMC free article] [PubMed] [Google Scholar]
- Baniqued PL, Gallen CL, Voss MW, Burzynska AZ, Wong CN, Cooke GE, et al. (2018). Brain network modularity predicts exercise-related executive function gains in older adults. Front. Aging Neurosci. 9, 426. 10.3389/fnagi.2017.00426 [DOI] [PMC free article] [PubMed] [Google Scholar]
- Birnbaum AS, Lytle LA, Murray DM, Story M, Perry CL, & Boutelle KN (2002). Survey development for assessing correlates of young adolescents’ eating. Am J Health Behav. 26: 284–295. 10.5993/ajhb.26.4.5 [DOI] [PubMed] [Google Scholar]
- Buck SM, Hillman CH, & Castelli DM (2008). The relation of aerobic fitness to stroop task performance in preadolescent children. Med Sci Sports Exerc. 40: 166–172. 10.1249/mss.0b013e318159b035 [DOI] [PubMed] [Google Scholar]
- Casey BJ, Jones RM, & Hare TA (2008). The adolescent brain. Annals of the New York Academy of Sciences, 1124, 111–126. 10.1196/annals.1440.010 [DOI] [PMC free article] [PubMed] [Google Scholar]
- Castelli DM, Hillman CH, Buck SM, & Erwin HE (2007). Physical fitness and academic achievement in third and fifth-grade students. J Sport Exerc Psychol. 29: 239–252. 10.1123/jsep.29.2.239 [DOI] [PubMed] [Google Scholar]
- Castelli DM, Hillman CH, Hirsch J, Hirsch A, and Drollette E (2011). FIT kids: time in target heart zone and cognitive performance. Prev. Med. 52, S55–S59. 10.1016/j.ypmed.2011.01.019 [DOI] [PubMed] [Google Scholar]
- Centers for Disease Control and Prevention. (2012). Physical Activity in U.S. Youth Aged 12–15 Years. Available online at: http://www.cdc.gov/healthyschools/physicalactivity/facts.htm.Accessed August 9, 2020.
- Chaddock L, Erickson KI, Prakash RS, Kim JS, Voss MW, VanPatter M, et al. (2010a). A neuroimaging investigation of the association between aerobic fitness, hippocampal volume and memory performance in preadolescent children. Brain Res. 1358: 172–183. 10.1016/j.brainres.2010.08.049 [DOI] [PMC free article] [PubMed] [Google Scholar]
- Chaddock L, Erickson KI, Prakash RS, VanPatter M, Voss MV, Pontifex MB, et al. (2010b). Basal ganglia volume is associated with aerobic fitness in preadolescent children. Dev Neurosci. 32: 249–256. 10.1159/000316648 [DOI] [PMC free article] [PubMed] [Google Scholar]
- Chaddock L, Erickson KI, Prakash RS, Voss MV, VanPatter M, Pontifex MB, et al. (2012). A functional MRI investigation of the association between childhood aerobic fitness and neurocognitive control. Biol Psychol. 89: 260–268. 10.1016/j.biopsycho.2011.10.017 [DOI] [PubMed] [Google Scholar]
- Chaddock L, Pontifex MB, Hillman CH, & Kramer AF (2011). A review of the relation of aerobic fitness and physical activity to brain structure and function in children. J Int Neuropsychol Soc. 17: 1–11. 10.1017/s1355617711000567 [DOI] [PubMed] [Google Scholar]
- Chaddock-Heyman L, Erickson KI, Holtrop JL, Voss MW, Pontifex MB, Raine LB, et al. (2014). Aerobic fitness is associated with greater white matter integrity in children. Front. Hum. Neurosci. 8: 584. 10.3389/fnhum.2014.00584 [DOI] [PMC free article] [PubMed] [Google Scholar]
- Chaddock-Heyman L, Erickson KI, Kienzler C, Drollette ES, Raine LB, Kao S-C, et al. (2019). Physical activity increases white matter microstructure in children. Front. Neurosci. 12: 950. 10.3389/fnins.2018.00950 [DOI] [PMC free article] [PubMed] [Google Scholar]
- Chaddock-Heyman L, Erickson KI, Kienzler C, King M, Pontifex MB, Raine LB, et al. (2015) The Role of Aerobic Fitness in Cortical Thickness and Mathematics Achievement in Preadolescent Children. PLOS ONE 10(8): e0134115. 10.1371/journal.pone.0134115 [DOI] [PMC free article] [PubMed] [Google Scholar]
- Chaddock-Heyman L, Erickson KI, Voss MW, Knecht AM, Pontifex MB, Castelli DM, et al. (2013). The effects of physical activity on functional MRI activation associated with cognitive control in children: a randomized controlled intervention. Front Hum Neurosci. 7: 1–13. 10.3389/fnhum.2013.00072 [DOI] [PMC free article] [PubMed] [Google Scholar]
- Chaddock-Heyman L, Hillman CH, Cohen NJ, & Kramer AF (2014). The importance of physical activity and aerobic fitness for cognitive control and memory in children. Monographs of the Society for Research in Child Development, 79, 25–50. 10.1111/mono.12129 [DOI] [PubMed] [Google Scholar]
- Chaddock-Heyman L, Weng TB, Kienzler C, Weisshappel R, Drollette ES, Raine LB, et al. (2020). Brain network modularity predicts improvements in cognitive and scholastic performance in children involved in a physical activity intervention. Front. Hum. Neurosci. 14:346. 10.3389/fnhum.2020.00346 [DOI] [PMC free article] [PubMed] [Google Scholar]
- Chomitz VR, Slining MM, McGowan RJ, Mitchell SE, Dawson GF, & Hacker KA (2009). Is there a relationship between physical fitness and academic achievement?: Positive results from public school children in the northeastern United States. J Sch Health. 79: 30–37. 10.1111/j.1746-1561.2008.00371.x [DOI] [PubMed] [Google Scholar]
- Dahl RE (2004). Adolescent brain development: A period of vulnerabilities and opportunities. Keynote address. Annals of the New York Academy of Science, 1021, 1–22. 10.1196/annals.1308.001 [DOI] [PubMed] [Google Scholar]
- Dale AM, & Sereno MI (1993). Improved localization of cortical activity by combining EEG and MEG with MRI cortical surface reconstruction: A linear approach. Journal of Cognitive Neuroscience. 5: 162–176. 10.1162/jocn.1993.5.2.162 [DOI] [PubMed] [Google Scholar]
- Dale AM, Fischl B, & Sereno MI (1999). Cortical surface-based analysis. I. Segmentation and surface reconstruction. Neuroimage. 9: 179–194. 10.1006/nimg.1998.0395 [DOI] [PubMed] [Google Scholar]
- Desikan RS, Segonne F, Fischl B, Quinn BT, Dickerson BC, Blacker D, et al. (2006). An automated labeling system for subdividing the human cerebral cortex on MRI scans into gyral based regions of interest. Neuroimage. 3: 968–980. 10.1016/j.neuroimage.2006.01.021 [DOI] [PubMed] [Google Scholar]
- Donnelly JE, Hillman CH, Castelli D, Etnier JL, Lee S, Tomporowski P, et al. (2016). Physical Activity, Fitness, Cognitive Function, and Academic Achievement in Children: A Systematic Review. Med Sci Sports Exerc. 48(6), 1197–1222. 10.1249/mss.0000000000000901 [DOI] [PMC free article] [PubMed] [Google Scholar]
- Dosenbach NUF, Nardos B, Cohen AL, Fair DA, Power JD, Church JA, et al. (2010). Prediction of individual brain maturity using fMRI. Science. 329:1358–61. 10.1126/science.1194144 [DOI] [PMC free article] [PubMed] [Google Scholar]
- Erickson KI, Hillman C, Stillman CM, Ballard RM, Bloodgood B, Conroy DE, … & Powell KE (2019). Physical activity, cognition, and brain outcomes: a review of the 2018 physical activity guidelines. Medicine & Science in Sports & Exercise, 51(6), 1242–1251. 10.1249/mss.0000000000001936 [DOI] [PMC free article] [PubMed] [Google Scholar]
- Fair DA, Cohen AL, Power JD, Dosenbach NUF, Church JA, Miezin FM, Schlaggar BL, & Petersen SE (2009). Functional brain networks develop from a “local to distributed” organization. PLoS Comput Biol. 5. 10.1371/journal.pcbi.1000381 [DOI] [PMC free article] [PubMed] [Google Scholar]
- Fedewa AL, & Ahn S (2011). The effects of physical activity and physical fitness on children’s achievement and cognitive outcomes: A meta-analysis. Res Q Exerc Sport. 82, 3: 521–535. 10.1080/02701367.2011.10599785 [DOI] [PubMed] [Google Scholar]
- Fischl B, & Dale AM (2000). Measuring the thickness of the human cerebral cortex from magnetic resonance images. Proc Natl Acad Sci U S A. 97: 11050–11055. 10.1073/pnas.200033797 [DOI] [PMC free article] [PubMed] [Google Scholar]
- Gallen CL, and D’Esposito M (2019). Brain modularity: A biomarker of intervention-related plasticity. Trends Cogn. Sci. 23(4), 293–304. 10.1016/j.tics.2019.01.014 [DOI] [PMC free article] [PubMed] [Google Scholar]
- Gallen CL, Baniqued PL, Chapman SB, Aslan S, Keebler M, Didehbani N, et al. (2016). Modular brain network organization predicts response to cognitive training in older adults. PLoS ONE 11(12), e0169015. 10.1371/journal.pone.0169015 [DOI] [PMC free article] [PubMed] [Google Scholar]
- Giedd JN, Blumenthal J, Jeffries NO, Castellanos FX, Liu H, Zijdenbos A, et al. (1999). Brain development during childhood and adolescence: A longitudinal MRI study. Nat. Neurosci. 2: 861–863. 10.1038/13158 [DOI] [PubMed] [Google Scholar]
- Giedd JN, Snell JW, Lange N, Rajapakse JC, Casey BJ, Kozuch PL, et al. (1996). Quantitative magnetic resonance imaging of human brain development: ages 4–18. Cerebral Cortex. 6: 551–560. 10.1093/cercor/6.4.551 [DOI] [PubMed] [Google Scholar]
- Gogtay N, Giedd JN, Lusk L, Hayashi KM, Greenstein D, Vaituzis AC, et al. (2004). Dynamic mapping of human cortical development during childhood through early adulthood. PNAS, 101(21), 8174–8179. 10.1073/pnas.0402680101 [DOI] [PMC free article] [PubMed] [Google Scholar]
- Goran M, Fields D. a, Hunter GR, Herd SL, & Weinsier RL (2000). Total body fat does not influence maximal aerobic capacity. International Journal of Obesity and Related Metabolic Disorders : Journal of the International Association for the Study of Obesity, 24(7), 841–848. 10.1038/sj.ijo.0801241 [DOI] [PubMed] [Google Scholar]
- Goran MI, Driscoll P, Johnson R, Nagy TR, & Hunter G (1996). Cross-calibration of body-composition techniques against dual-energy X-ray absorptiometry in young children. American Journal of Clinical Nutrition, 63(3), 299–305. 10.1093/ajcn/63.3.299 [DOI] [PubMed] [Google Scholar]
- Greve DN, and Fischl B (2009). Accurate and robust brain image alignment using boundary-based registration. NeuroImage 48, 63–72. 10.1016/j.neuroimage.2009.06.060 [DOI] [PMC free article] [PubMed] [Google Scholar]
- Gu S, Satterthwaite TD, Medaglia JD, Yang M, Gur RE, Gur RC, & Bassett DS Emergence of system roles in normative neurodevelopment (2015). Proc Natl Acad Sci USA. 112:13681–13686. 10.1073/pnas.1502829112 [DOI] [PMC free article] [PubMed] [Google Scholar]
- Hallquist MN, Hwang K, and Luna B (2013). The nuisance of nuisance regression: spectral misspecification in a common approach to resting- state fMRI preprocessing reintroduces noise and obscures functional connectivity. NeuroImage 82, 208–225. 10.1016/j.neuroimage.2013.05.116 [DOI] [PMC free article] [PubMed] [Google Scholar]
- Hampson M, Driesen N, Roth JK, Gore JC, & Constable RT (2010). Functional connectivity between task-positive and task-negative brain areas and its relation to working memory performance. Magn Reson Imaging. 28:1051–7. 10.1016/j.mri.2010.03.021 [DOI] [PMC free article] [PubMed] [Google Scholar]
- Hillman CH, Pontifex MB, Castelli DM, Khan NA, Raine LB, Scudder MR, et al. (2014). Effects of the FITKids randomized controlled trial on executive control and brain function. Pediatrics. 134: 1063–1071. 10.1542/peds.2013-3219 [DOI] [PMC free article] [PubMed] [Google Scholar]
- Jones SE, Buchbinder BR, & Aharon I (2000). Three-dimensional mapping of cortical thickness using Laplace’s equation. Hum Brain Mapp. 11: 12–32. [DOI] [PMC free article] [PubMed] [Google Scholar]
- Kabani N, Le GG, MacDonald D, & Evans AC (2001) Measurement of cortical thickness using an automated 3-D algorithm: A validation study. Neuroimage. 13: 375–380. 10.1006/nimg.2000.0652 [DOI] [PubMed] [Google Scholar]
- Kashtan N, and Alon U (2005). Spontaneous evolution of modularity and network motifs. Proc. Natl. Acad. Sci. U S A 102, 13773–13778. 10.1073/pnas.0503610102 [DOI] [PMC free article] [PubMed] [Google Scholar]
- Klein A, & Tourville J. 101 labeled brain images and a consistent human cortical labeling protocol. Front Brain Imaging Methods. 2012; 6: 171. 10.3389/fnins.2012.00171 [DOI] [PMC free article] [PubMed] [Google Scholar]
- Koechlin E, Basso G, Pietrini P, Panzer S, and Grafman J (1999). The role of the anterior prefrontal cortex in human cognition. Nature 399, 148–151. 10.1038/20178 [DOI] [PubMed] [Google Scholar]
- Leopold D, Murayama Y, and Logothetis NK (2003). Very slow activity fluctuations in monkey visual cortex: implications for functional brain imaging. Cereb. Cortex 13, 422–433. 10.1093/cercor/13.4.422 [DOI] [PubMed] [Google Scholar]
- MacDonald D, Kabani N, Avis D, & Evans AC (2000). Automated 3-D extraction of inner and outer surfaces of cerebral cortex from MRI. Neuroimage. 12: 340–356. 10.1006/nimg.1999.0534 [DOI] [PubMed] [Google Scholar]
- Marco EM, Macri S, & Laviola G (2011). Critical age windows for neurodevelopmental psychiatric disorders: evidence from animal models. Neurotoxicity Research, 19(2), 286–307. 10.1007/s12640-010-9205-z [DOI] [PubMed] [Google Scholar]
- Masten AS (2004). Regulatory processes, risk, and resilience in adolescent development. Annals of the New York Academy of Sciences. 1021: 310–319. 10.1196/annals.1308.036 [DOI] [PubMed] [Google Scholar]
- McKenzie TL, Strikmiller PK, Stone EJ, Woods SE, Ehlinger SS, Romero KA, et al. (1994). CATCH: Physical activity process evaluation in a multicenter trial. Health Educ. Q. 2, S73–S89. 10.1177/10901981940210S106 [DOI] [PubMed] [Google Scholar]
- Newman MEJ (2006). Finding community structure in networks using the eigenvectors of matrices. Phys. Rev. 74:036104. 10.1103/physreve.74.036104 [DOI] [PubMed] [Google Scholar]
- Oldfield RC (1971). The assessment and analysis of handedness: The Edinburgh inventory. Neuropsychologia. 9: 97–113. 10.1016/0028-3932(71)90067-4 [DOI] [PubMed] [Google Scholar]
- Pontifex MB, Raine LB, Johnson CR, Chaddock L, Voss MW, Cohen NJ, et al. Cardiorespiratory fitness and the flexible modulation of cognitive control in preadolescent children. J Cogn Neurosci. 23: 1332–1345. 10.1162/jocn.2010.21528 [DOI] [PubMed] [Google Scholar]
- Power JD, Barnes KA, Snyder AZ, Schlaggar BL, and Petersen SE (2012). Spurious but systematic correlations in functional connectivity MRI networks arise from subject motion. NeuroImage, 59, 2142–2154. 10.1016/j.neuroimage.2011.10.018 [DOI] [PMC free article] [PubMed] [Google Scholar]
- Power JD, Cohen AL, Nelson SM, Wig GS, Barnes KA, Church JA, et al. (2011). Functional network organization of the human brain. Neuron, 72, 665–678. 10.1016/j.neuron.2011.09.006 [DOI] [PMC free article] [PubMed] [Google Scholar]
- Pruim RHR, Mennes M, van Rooij D, Llera A, Buitelaar JK, and Beckmann CF (2015). ICA-AROMA: a robust ICA-based strategy for removing motion artifacts from fMRI data. NeuroImage 112, 267–277. 10.1016/j.neuroimage.2015.02.064 [DOI] [PubMed] [Google Scholar]
- Salvador R, Suckling J, Coleman M, Pickard J, Menon D, and Bullmore E (2005). Neurophysiological architecture of functional magnetic resonance images of human brain. Cereb. Cortex 15, 1332–1342. 10.1093/cercor/bhi016 [DOI] [PubMed] [Google Scholar]
- Satterthwaite TD, Wolf DH, Ruparel K, Erus G, Elliott MA, Eickhoff SB, et al. (2013). Heterogeneous impact of motion on fundamental patterns of developmental changes in functional connectivity during youth. Neurolmage. 83:45–57. 10.1016/j.neuroimage.2013.06.045 [DOI] [PMC free article] [PubMed] [Google Scholar]
- Schaefer A, Kong R, Gordon EM, Laumann TO, Zuo XN, Holmes AJ, et al. (2018). Local-global parcellation of the human cerebral cortex from intrinsic functional connectivity MRI. Cereb. Cortex 28, 3095–3114. 10.1093/cercor/bhx179 [DOI] [PMC free article] [PubMed] [Google Scholar]
- S’egonne F, Salat DH, Dale AM, Destrieux C, Fischl B, van der Kouwe A, et al. (2004). Automatically parcellating the human cerebral cortex. Cereb Cortex. 14: 11–22. 10.1093/cercor/bhg087 [DOI] [PubMed] [Google Scholar]
- Smith SM (2002). Fast robust automated brain extraction. Hum. Brain Mapp. 17, 143–155. 10.1002/hbm.10062 [DOI] [PMC free article] [PubMed] [Google Scholar]
- Sowell ER, Peterson BS, Thompson PM, Welcome SE, Henkenius AL, & Toga AW (2006). Mapping cortical change across the human life span. Nat Neurosci. 6: 309–315. 10.1038/nn1008 [DOI] [PubMed] [Google Scholar]
- Sowell ER, Thompson PM, Leonard CM, Welcome SE, Kan E, & Toga AW (2004). Longitudinal mapping of cortical thickness and brain growth in normal children. J Neurosci. 24: 8223–31. 10.1523/jneurosci.1798-04.2004 [DOI] [PMC free article] [PubMed] [Google Scholar]
- Tamnes CK, Herting MM, Goddings AL, Meuwese R, Blakemore SJ, Dahl RE, … Mills KL (2017). Development of the cerebral cortex across adolescence: A multisample study of inter-related longitudinal changes in cortical volume, surface area, and thickness. J Neurosci. 37: 3402–3412. 10.1523/JNEUROSCI.3302-16.2017 [DOI] [PMC free article] [PubMed] [Google Scholar]
- Taylor SJC, Whincup PH, Hindmarsh PC, Lampe F, Odoki K, & Cook DG (2001). Performance of a new pubertal self-assessment questionnaire: A preliminary study. Paediatr Perinat Epidemiol. 15: 88–94. 10.1046/j.1365-3016.2001.00317.x [DOI] [PubMed] [Google Scholar]
- Tomporowski PD, Davis CL, Miller PH, & Naglieri JA (2008). Exercise and children’s intelligence, cognition, and academic achievement. Educ Psychol Rev. 20: 111–31. 10.1007/s10648-007-9057-0 [DOI] [PMC free article] [PubMed] [Google Scholar]
- Voss MW, Chaddock L, Kim JS, VanPatter M, Pontifex MB, Raine LB, et al. (2011). Aerobic fitness is associated with greater efficiency of the network underlying cognitive control in preadolescent children. Neuroscience. 199: 166–76. 10.1016/j.neuroscience.2011.10.009 [DOI] [PMC free article] [PubMed] [Google Scholar]
- Woodcock RW (1997). The Woodcock-Johnson Tests of Cognitive Ability—Revised. In Flanagan DP, Genshaft JL, & Harrison PL (Eds.), Contemporary intellectual assessment: Theories, tests, and issues (p. 230–246). The Guilford Press. [Google Scholar]