

Abstract
During neocortical development, neural stem cells (NSCs) divide symmetrically to self‐renew at the early stage and then divide asymmetrically to generate post‐mitotic neurons. The molecular mechanisms regulating the balance between NSC self‐renewal and neurogenesis are not fully understood. Using mouse in utero electroporation (IUE) technique and in vitro human NSC differentiation models including cerebral organoids (hCOs), we show here that regulator of cell cycle (RGCC) modulates NSC self‐renewal and neuronal differentiation by affecting cell cycle regulation and spindle orientation. RGCC deficiency hampers normal cell cycle process and dysregulates the mitotic spindle, thus driving more cells to divide asymmetrically. These modulations diminish the NSC population and cause NSC pre‐differentiation that eventually leads to brain developmental malformation in hCOs. We further show that RGCC might regulate NSC spindle orientation by affecting the organization of centrosome and microtubules. Our results demonstrate that RGCC is essential to maintain the NSC pool during cortical development and suggest that RGCC defects could have etiological roles in human brain malformations.
Keywords: brain malformation, cerebral organoid, neural stem cell, RGCC, spindle orientation
Subject Categories: Development & Differentiation, Neuroscience
The cell cycle regulator RGCC maintains spindle orientation during NSC mitotic divisions. In the presence of RGCC, NSCs divide symmetrically to generate two daughter NSCs for maintaining the NSC pool. Without RGCC, NSCs divide asymmetrically, leading to proneuronal differentiation.
Introduction
Prior to mammalian neocortical neurogenesis (E8‐E9), neuroepithelial cells (NECs) divide symmetrically to produce two NECs. Later, NECs transform into radial glial cells (RGCs), which also undergo symmetric division to produce two RGC daughter cells at the early stage (Götz & Huttner, 2005; Paridaen & Huttner, 2014). This symmetric division of NECs and RGCs is essential for expansion and maintenance of the neural stem cell (NSC) pool and for ensuring future neuron production and cortical formation (Sun & Hevner, 2014). After the onset of neurogenesis (E10), RGCs gradually switch to asymmetric division generating one RGC and simultaneously producing one neurogenic intermediate progenitor (IP) or one neuron (Florio & Huttner, 2014). In human neocortex, RGCs may also asymmetrically produce one outer RGC (oRGC) for outer subventricular zone (oSVZ) expansion (Lui et al, 2011). Newborn neurons then migrate toward basal pia bypassing the neurons born earlier, to form the six‐layered mammalian neocortex in an inside‐out manner (Mérot et al, 2009). Dysregulation of this exquisitely controlled process leads to many brain malformations such as microcephaly, macrocephaly, and neuronal heterotopia (Gilmore & Walsh, 2013; Sun & Hevner, 2014; Jayaraman et al, 2018). To further decipher the orchestrated balance of RGC self‐renewal and neuron production, more genes and their molecular mechanisms need to be explored.
Regulator of cell cycle (Rgcc), previously known as response gene to complement 32 (Rgc32), was first identified from rat oligodendrocytes (Badea et al, 1998). Named originally on account of being induced by complement activation, it was subsequently found to have a regulatory role in the cell cycle with influences on diverse processes such as cell proliferation (Badea et al, ,1998, 2002; Niculescu et al, 1998; Saigusa et al, 2007; Xu et al, 2014; Cosmin et al, 2015; Zhao et al, 2015; Counts & Mufson, 2017), differentiation (Huang et al, 2011; Tegla et al, 2013; Tang et al, 2014), and epithelial–mesenchymal transition (Huang et al, 2011) in various physiological and pathological states (Vlaicu et al, 2008, 2019). Previous studies showed that Rgcc‐deficient murine embryos were significantly smaller than wildtype controls (Cui et al, 2013). However, possible changes in head size and cortical morphology in these embryos were not investigated. The roles of RGCC in NSC regulation and neural development, especially neocortical formation, had not yet been studied.
In this study, we found that in the developing mammalian neocortex, Rgcc is exclusively expressed in NSCs. Using mouse in utero electroporation (IUE) and human embryonic stem cell (hESC)‐derived cerebral organoid (hCO) models (Lancaster et al, 2013) as well as 2D differentiation methods (Zhang et al, 2010; Shi et al, 2012), we showed that RGCC deficiency disrupts NSC cell cycle and spindle orientation, leading to pre‐differentiation of NSCs and exhaustion of the NSC pool. As the outcome, lack of RGCC causes a dramatic size reduction in hCOs. Our results suggested that RGCC is a novel regulator of NSCs in mammalian neocortical development and could be a potential etiological factor in human brain developmental malformations.
Results
Rgcc is expressed in the neural stem cells of the developing mammal neocortex
To explore the function of Rgcc in neocortical development, we first tested its expression in the embryonic mouse neocortex. In situ hybridization performed on murine embryonic (E14.5) dorsal forebrain coronal sections showed that Rgcc was exclusively expressed in the NSC‐enriched ventricular zone (VZ) (Fig 1A). Subsequent immunofluorescence (IF) staining on adjacent slices with the NSC markers Pax6 and Sox2 as well as cell cycle marker Ki67 (Fig 1A) illustrated the presence of proliferating neural progenitors in the VZ, which was coincided with Rgcc‐expressing regions. This result suggested the expression of Rgcc in proliferating NSCs. To investigate the cell types expressing Rgcc mRNA, we analyzed previously published single‐cell transcriptome data of murine neocortex (Loo et al, 2019) and found that Rgcc is specifically expressed by radial glial cells (or progenitor‐like astrocytes; Fig 1B).
Figure 1. Rgcc expression during the embryonic mice and human cortical development.
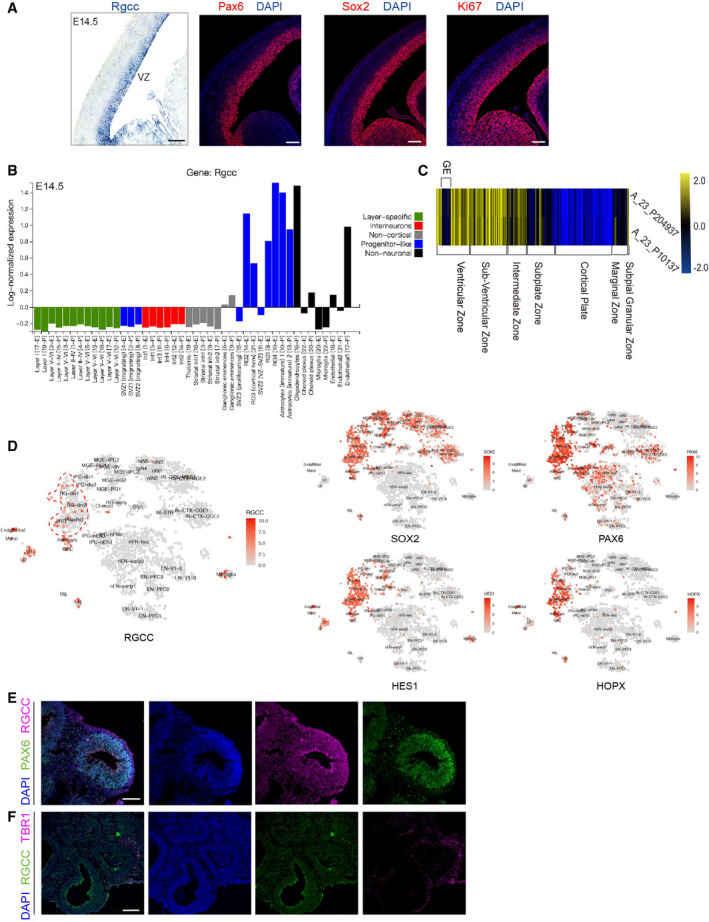
- Expression pattern of Rgcc in the embryonic day 14.5 (E14.5) mouse cortex as detected by in situ hybridization. The right panels showed the expression patterns of NSC markers, including Pax6, Sox2, and Ki67, along the ventricular zone (VZ) of the E14.5 mouse cortex. Scale bar: 20 μm.†
- Analyzing single‐cell transcriptomic database of the E14.5 mouse cortex showed the specific expression of Rgcc in NSCs. Data were downloaded from http://zylkalab.org/datamousecortex.
- RGCC expression and distribution in developing human fetal neocortex. RGCC microarray data were downloaded from BrainSpan Atlas of the Developing Human Brain (available from: www.human.brain‐map.org; Donor id: 14751, donor name H376.IIIB.02, donor age 16pcw). Two independent probes NO: A_23_P204937 and NO: A_23_P10137 were used. Heatmap was further prepared by MeV. Only the expressions along neocortex were shown.
- Single‐cell RNA‐seq analysis of human fetus cortex (https://cells.ucsc.edu/?ds=cortex‐dev). Cell‐type clusters expressing RGCC were circled by red dash line. Expression patterns of NSC markers were showed in the right panels.
- Immunofluorescent staining of hCOs of day30. RGCC and PAX6 were co‐stained. Scale bars: 100 μm.
- Immunofluorescent staining of hCOs of day30. RGCC and TBR1 were co‐stained. Scale bars: 250 μm.
Data information: Abbreviation: VZ, ventricular zone; GE, ganglionic eminence. †Correction added on 13. August 2021, after first online publication: The image for Pax6/DAPI in panel A was exchanged with the image for Ki67/DAPI.
Rgcc encodes a protein that remains highly conserved across various species (Fig EV1). For instance, both human RGCC and mouse Rgcc encode a 137‐amino acid protein with 92% homology (Vlaicu et al, 2019). To gain insights into the roles of RGCC in human brain development, we checked the expression of RGCC in fetal human brains from multiple online databases. According to the microarray database of the BrainSpan Atlas of the Developing Human Brain (Miller et al, 2014), RGCC is expressed along proliferating progenitor regions, such as the VZ and the SVZ of the fetal human neocortex. RGCC expression was very low on the cortical plate (CP) populated mostly by post‐mitotic neurons (Fig 1C). To check the RGCC‐expressing cell types in human brains, we searched the fetal human brain single‐cell RNA‐seq database (Nowakowski et al, 2017). RGCC was found in a sub‐population of RGCs and oRGCs, but not neurons, compared to other NSC markers such as SOX2, PAX6, HES1, and HOPX (Fig 1D). Overall, these results confirmed that RGCC mRNA is specifically expressed in NSCs during human cortical development. To further test whether RGCC protein was also present in the same population of cells, we performed immunostaining on human embryonic stem cell‐derived cerebral organoids (hCOs) cultured for 30 days. Results showed that RGCC co‐localized with PAX6 in radial glial cells of the cortical regions (Fig 1E) but not co‐localized with neuronal marker TBR1 (Fig 1F). Taking together, RNA and protein expression analysis revealed the exclusive expression of RGCC in NSCs during mammal neocortical development. Next, we will examine whether RGCC plays any roles in NSC fate determination.
Figure EV1. Alignment of RGCC protein sequences from different species.
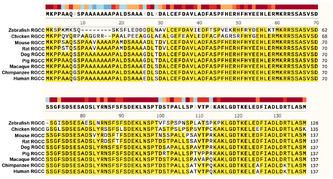
RGCC protein sequences from various species were aligned. Consensus sequences were colored by yellow.
Loss of function of Rgcc decreases self‐renewal and maintenance of neural stem cells, but promotes premature differentiation of mouse neural stem cells
Previous studies showed that Rgcc plays important roles in cell proliferation of many cell types such as aortic smooth muscle cells (Vlaicu et al, 2016), T‐lymphocyte (Cosmin et al, 2015), and tumor cell lines (Vlaicu et al, 2010). Therefore, we first evaluated the roles of Rgcc in NSC self‐renewal using loss‐of‐function experiment in mouse models via in utero electroporation (IUE) of shRNA targeting Rgcc mRNA (Appendix Fig S1A–C). To perform IUE, shRNA construct carrying GFP expression element was injected and electroporated into the mouse VZ at embryonic day 13.5 (E13.5), and mouse brain tissues were collected and analyzed 24 h later at E14.5 to evaluate the roles of Rgcc in regulating NSC self‐renewal. We found that knocking down Rgcc remarkably decreased NSC proliferation as evidenced by reduced immunostaining with Ki67 co‐stained with GFP when compared to brains electroporated with scramble‐shRNA (Fig 2A and B). Next, we tested whether impaired NSC proliferation caused by Rgcc knockdown (KD) affected the stem cell pool by immunostaining with antibodies against the NSC markers Sox2 and Pax6. There was a significant reduction of Sox2+ (Fig 2C and D) and Pax6+ (Fig 2E and F) NSCs co‐stained with GFP in the Rgcc shRNA group when compared to scramble‐shRNA controls. These results indicated that Rgcc‐KD negatively regulated the proliferation of NSCs and reduced the NSC pool. To further verify the roles of Rgcc in regulating NSC maintenance and proliferation, we designed CRISPR‐Cas9 sgRNAs targeting the exon 2 of mouse Rgcc gene and demonstrated their targeting efficiency in Neuro2a cells, a mouse neuroblastoma cell line (Appendix FigS2A–E). In utero electroporation of Rgcc sgRNA constructs revealed a significant reduction of Ki67+ proliferating cells, and Sox2+ or Pax6+ NSC population co‐stained with GFP compared to the Cas9 empty vector control, which confirmed Rgcc functions in NSC maintenance and self‐renewal (Fig EV2A–F).
Figure 2. Knocking down Rgcc suppresses NSC proliferation and promotes NSC proneuronal differentiation.
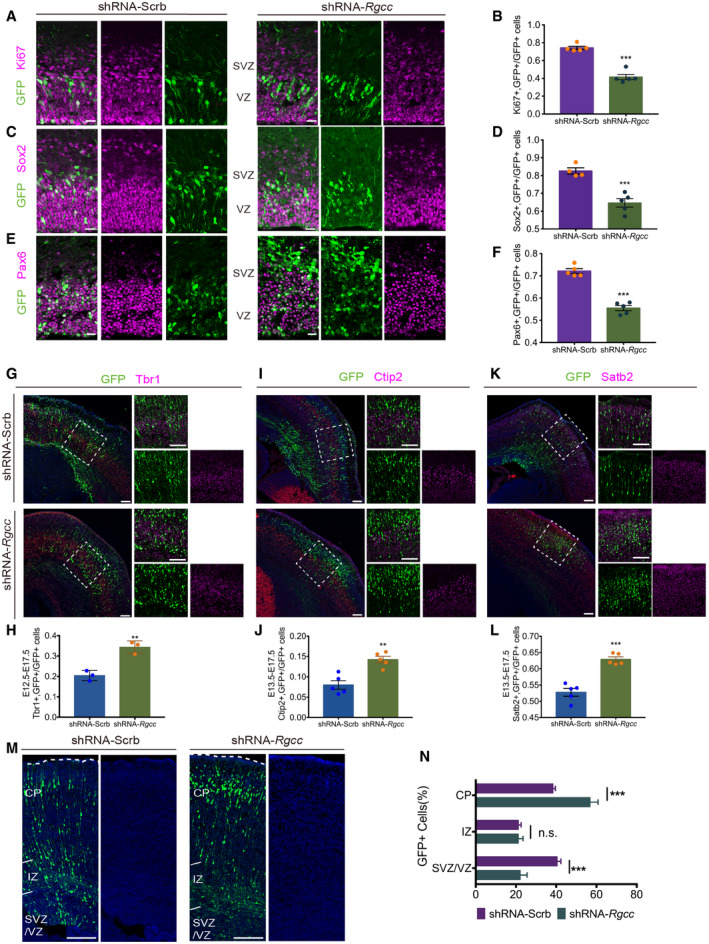
- Immunofluorescent staining of coronal sections of the E14.5 mouse cortex 1 day post‐IUE. ShRNA targeting Rgcc and control scramble‐shRNA were nucleofected separately. Ki67 were co‐stained with GFP. To quantify the ratio between NSC markers and GFP‐positive cells, only the cells in VZ and SVZ are taken into account. And ROIs of 800*1,900 pixel were randomly picked for counting. Scale bars: 20 μm.
- Quantification of the relative ratio of Ki67 and GFP double‐positive cells versus GFP‐positive cells.
- Immunofluorescent staining of coronal sections of the E14.5 mouse cortex 1 day post‐IUE. Sox2 were co‐stained with GFP. Scale bars: 20 μm.
- Quantification of the relative ratio of Sox2 and GFP double‐positive cells versus GFP‐positive cells.
- Immunofluorescent staining of coronal sections of the E14.5 mouse cortex 1 day post‐IUE. Pax6 were co‐stained with GFP. Scale bars: 20 μm.
- Quantification of the relative ratio of Pax6 and GFP double‐positive cells versus GFP‐positive cells.
- Immunofluorescent staining of coronal sections of the E17.5 mouse cortex 5 days post‐IUE. ShRNA targeting Rgcc and control scramble‐shRNA were transfected separately at E12.5. All the brains were harvested at E17.5. Tbr1 were co‐stained with GFP. And ROIs of 300*300 pixel were randomly picked along Tbr1 positive region for counting. Scale bars: 100 μm.
- Quantification of the relative ratio of Tbr1 and GFP double‐positive cells versus GFP‐positive cells.
- Immunofluorescent staining of coronal sections of the E17.5 mouse cortex 4 days post‐IUE. ShRNA targeting Rgcc and control scramble‐shRNA were transfected separately at E13.5. All the brains were harvest at E17.5. Ctip2 were co‐stained with GFP. And ROIs of 300*300 pixel were randomly picked along Ctip2‐positive region for counting. Scale bars: 100 μm.
- Quantification of the relative ratio of Ctip2 and GFP double‐positive cells versus GFP‐positive cells.
- Immunofluorescent staining of coronal sections of the E17.5 mouse cortex 4 days post‐IUE. ShRNA targeting Rgcc and control scramble‐shRNA were transfected separately at E13.5. All the brains were harvest at E17.5. Satb2 were co‐stained with GFP. And ROIs of 300*300 pixel were randomly picked for counting. Scale bars: 100 μm.
- Quantification of the relative ratio of Satb2 and GFP double‐positive cells versus GFP‐positive cells.
- Immunofluorescent staining of coronal sections of the E17.5 mouse cortex 4 days post‐IUE. Scale bars: 100 μm.
- The ratio of GFP‐positive cells in VZ/SVZ, IZ, and CP were counted for migration analysis.
Data information: Data are presented as mean ± SEM; n ≥ 3 mouse brains for each group; statistical significance was tested by Student’s t‐test. **P < 0.01; ***P < 0.001. Abbreviation: VZ, ventricular zone; SVZ, subventricular zone; IZ, intermediate zone; CP, cortical plate; n.s., not significant.
Figure EV2. KO Rgcc suppresses NSC proliferation.
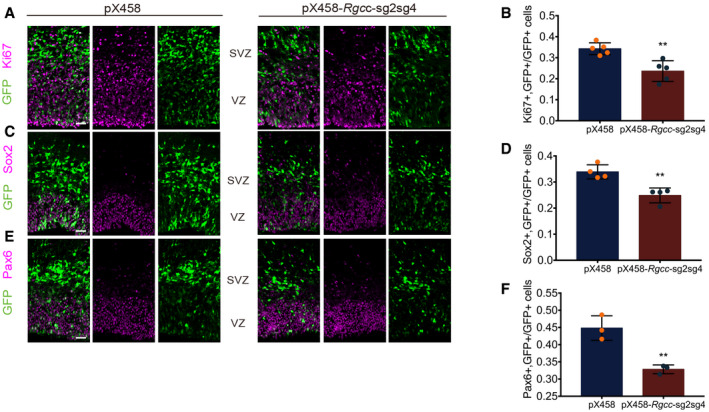
- For CRISPR plasmid, vectors were transfected into brain of E13.5 and were collected at E15.5. Figure A showed immunofluorescent staining of coronal sections of the E15.5 mouse cortex two days post‐IUE. Control plasmids pX458 and pX458‐Rgcc‐sgRNAs were nucleofected separately. Plasmid of two sgRNAs, sg2 and sg4 tested on Appendix Fig S2, were mixed 1:1 for sgRNA group. Ki67 were co‐stained with GFP. To quantify the ratio between markers and GFP‐positive cells, only the cells in VZ and SVZ are taken into account. And ROIs of 800*1,900 pixel were randomly picked for counting. Scale bars: 20 μm.
- Quantification of the relative ratio of Ki67 and GFP double‐positive cells versus GFP‐positive cells.
- Immunofluorescent staining of coronal sections of the E15.5 mouse cortex two days post‐IUE. Sox2 were co‐stained with GFP. Scale bars: 20 μm.
- Quantification of the relative ratio of Sox2 and GFP double‐positive cells versus GFP‐positive cells.
- Immunofluorescent staining of coronal sections of the E15.5 mouse cortex two days post‐IUE. Pax6 were co‐stained with GFP. Scale bars: 20 μm.
- Quantification of the relative ratio of Pax6 and GFP double‐positive cells versus GFP‐positive cells.
Data information: Data are presented as mean ± SEM; n ≥ 3 mouse brains for each group; statistical significance was tested by Student’s t‐test. **P < 0.01. Abbreviation: VZ, ventricular zone; SVZ, subventricular zone; n.s., not significant.
Since deletion of Rgcc pushes NSCs into leaving stem cell state, we wondered whether Rgcc deficiency affects neurogenesis. We examined newborn neurons from the Rgcc shRNA and scramble‐shRNA groups 4 or 5 days post‐IUE (Fig 2B). For Tbr1+ neurons, the firstborn layer 6 cortical projection neurons (Hevner et al, 2001; Molyneaux et al, 2007), we performed IUE at E12.5 and collected tissues at E17.5. For Ctip2+ layer 5 projection neurons and Satb2+ late‐born superficial layer neurons, we performed IUE at E13.5 and collected tissues at E17.5. Immunostaining analysis showed a significant increase in Tbr1+ (Fig 2G and H), Ctip2+ (Fig 2I and J), and Satb2+ (Fig 2K and L) post‐mitotic neurons co‐labeled with GFP in the Rgcc shRNA group compared to the control group. In addition, analyzing the distribution of GFP+ electroporated cells revealed that more Rgcc‐KD cells localized in the neuron‐enriched cortical plate, but less Rgcc‐KD cells located within the NSC‐enriched SVZ/VZ compared to the scramble control group (Fig 2M and N). These results indicated that knocking down Rgcc in NSCs impaired their self‐renewal capacity and drove NSCs into premature neuronal differentiation, thus suggesting a role for Rgcc in regulating the balance between proliferation and differentiation of NSCs.
Knocking out RGCC causes reduction of size in human cerebral organoids
Since expression pattern of Rgcc is similar between the mouse neocortices and human fetal brains, we tested whether the functions of Rgcc in regulating NSC fate are also conserved in human brain development. To achieve this purpose, we examined the roles of RGCC on human NSCs using hCO models. Using CRISPR‐Cas9 genome‐editing technique, we created two homozygous RGCC‐KO cell lines based on H9 hESCs, namely #6 and #23 (Fig EV3A). To check the deletion of RGCC in these two lines, we performed qPCR using 30‐day‐old hCOs from #6# and #23 cells as well as wildtype H9 cells and found no expression of RGCC in both #6 and #23 lines, suggesting a successful RGCC deletion (Fig EV3B and C). To examine whether deletion of RGCC caused any defects in hESCs, we checked the pluripotency and proliferation capacity. Quantitative real‐time–PCR was performed to check the expression levels of pluripotent markers including NANOG, OCT4, SOX2, DNMT3B, TERT, and REX1 (Fig EV3D). Results showed no significant changes in the expression of pluripotent markers, suggesting RGCC deletion did not affect differentiation potential of hESCs. In addition, EdU‐labeling assay was performed to test whether RGCC deletion affects proliferation capacity of hESCs. Results showed no differences among #6 and #23 RGCC‐KO lines and wildtype H9 cells, indicating no changes in the proliferation capacity of hESCs upon RGCC deletion (Fig EV3E). Those observations implied that RGCC deletion plays no role in self‐renewal or differentiation potentials of hESCs.
Figure EV3. RGCC‐KO line construction and testing for RGCC‐KO hCOs.
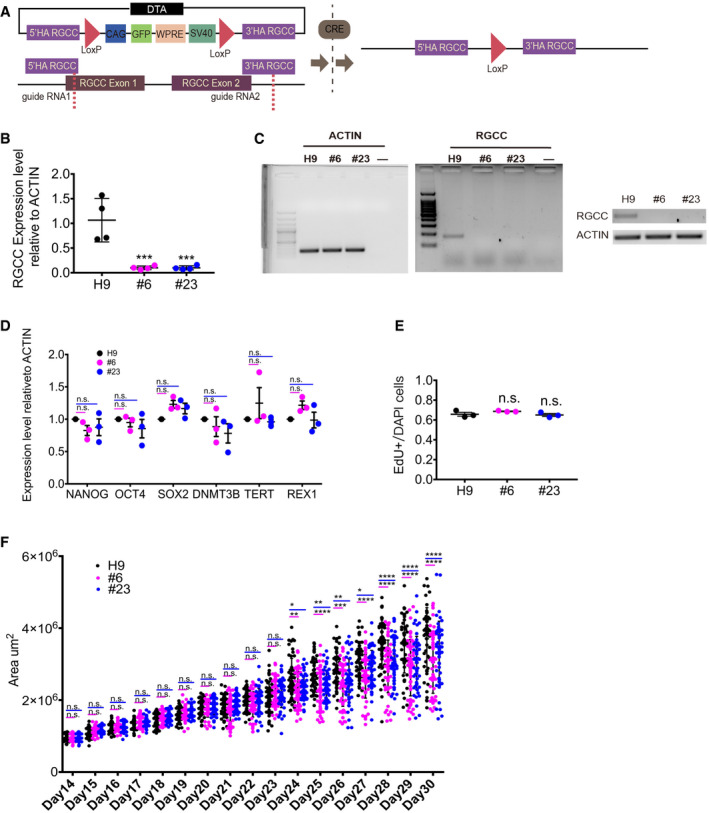
- Schematic of RGCC‐KO line construction. Step‐by‐step details can be found in the Materials and Methods section.
- qPCR analysis of RGCC expression on 30‐day‐old hCOs cultured from wildtype H9 and RGCC‐KO cell lines. Expression levels were measured relative to (2−∆∆ C t) reference gene ACTIN of H9 control group (n = 4 organoids from each group).
- RT–PCR results showed no expression of RGCC in 30‐day‐old hCOs cultured from RGCC‐KO lines #6 and #23 (upper panel). ACTIN was used as reference (lower panel).
- qPCR analysis of the expression of stem cell pluripotency markers on wildtype H9 and RGCC‐KO cell lines. Expression levels were measured relative to (2−∆∆ C t) reference gene ACTIN of H9 control group. Each plot represented RNA collected from an independent batch of cells (n = 3 batches for each cell lines).
- Proliferation potency of wildtype H9 and RGCC‐KO cell lines was tested by EdU assay. Each plot represented an independent experiment (n = 3). The numbers of EdU‐labeling cells verses number of DAPI in one ROIs (regions of interest) were counted. For one experiment, at least 15 ROIs were analyzed.
- Area changes of hCOs of different groups from day14 to day 30. The area of single hCO from all different batches was analyzed. Each plot represented one hCOs (day 14 to day 19, n = 36; day 20 to day 3, n = 52 from 3 independent experiments).
Data information: Data are presented as mean ± SEM. Statistical significance was tested by one‐way ANOVA. *P < 0.01; **P < 0.01; ***P < 0.001; ****P < 0.0001. Abbreviation: n.s., not significant.
To investigate the roles of RGCC in human cortical development, we generated hCOs from RGCC‐KO lines as well as wildtype H9 cells. To trace the possible changes of these organoids, we measured the sizes of organoids at several time points. hCOs derived from RGCC‐KO lines started showing significant reduction in size since day 24 (Fig 3 A and B, Fig EV3F). Because Rgcc impairs NSC maintenance and promotes pre‐neuronal differentiation of NSCs in IUE experiments, we checked whether reduction of hCO size upon RGCC abolishment was also due to the diminishment of NSC pool and pre‐differentiation of NSCs. Forty‐five‐day‐old hCOs derived from RGCC‐KO lines and control H9 cells were collected and immunostained with proliferative markers and NSC markers. We used antibody against NSC marker SOX2 to indicate VZ‐like rosettes in hCOs and measured the area of SOX2+ VZ regions in hCOs and found that hCOs derived from RGCC‐KO lines #6 and #23 showed a significant reduction in SOX2+ areas, indicating the shrinkage of NSC pool upon RGCC deletion (Fig 3C and D). We then examined cell proliferation by quantifying the cell cycle marker PH3+ cells in the NSCs. We found that the ratio of PH3+ cells in PAX6+ NSCs was remarkably reduced in #6‐ and #23‐derived hCOs, suggesting a decrease in NSC proliferation (Fig 3E and F). Immunostaining analysis using antibody against cell cycle marker Ki67 further demonstrated the impairment of NSC proliferation in RGCC‐deficient hCOs compared to control organoids (Fig 3G and H). To check whether RGCC deletion promotes neuronal differentiation, we stained the neuronal marker TUJ1, early‐born neuron markers TBR1 and CTIP2 as well as NSC marker PAX6 on 45‐day‐old hCOs. To evaluate the neuronal differentiation, we analyzed the ratio of neuronal marker‐positive area versus PAX6+ NSC area. Results showed that significantly more TUJ1+ (Fig 3I and J), TBR1+ (Fig 3K and L), and CTIP2+ (Fig 3 M and N) area were found surrounding PAX6+ NSC regions in #6 and #23 cell‐derived hCOs compared to H9‐derived controls. Collectively, these results from both mouse experiments and hCO cultures demonstrated that RGCC deletion impaired the proliferation of NSCs, exhausted NSC pools, and promoted premature neuronal differentiation. Next, we will investigate how RGCC regulates NSC fate determination.
Figure 3. Deletion of RGCC diminishes the VZ‐like area and exhibits premature differentiation in hCOs.
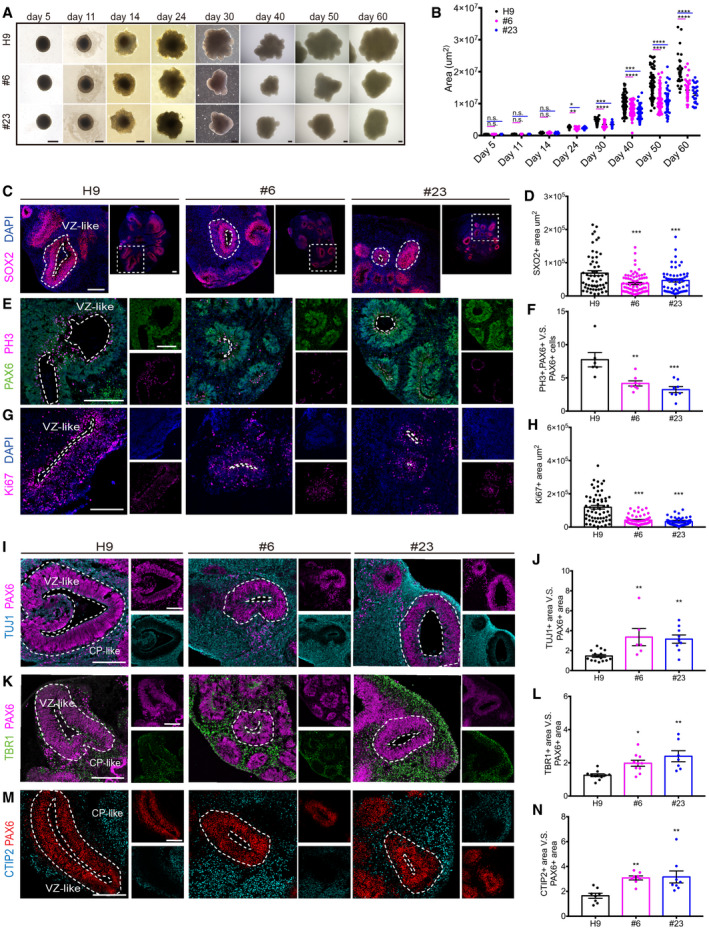
- Representative pictures of H9 and RGCC‐KO hCOs at 5, 11, 14, 24, 30, 40, 50, and 60 days. Scale bar: 500 μm.
- Area changes of hCOs of different groups at different time points. The area of single hCO from all different batches were analyzed. Each plot represented one hCOs (day 5, n = 12; day 11, n = 12; day 14, n = 44; day 24, n = 26; day 30, n = 46; day 40, n = 98; day 50, n = 63; day 60, n = 24 for each group from 4 independent experiments).
- Immunofluorescent staining was performed on sections of day 45 wildtype H9 and RGCC‐KO hCOs. Sections were stained with SOX2. Scale bar: 200 μm.
- Quantification of the VZ‐like SOX2‐positive rosette area. Each plot represented an individual rosette. H9, n = 19; #6, n = 24; #23, n = 19 from 2 independent experiments.
- Immunofluorescent staining was performed on sections of day 45 wildtype H9 and RGCC‐KO hCOs. Sections were stained with PAX6 and phospho‐histone 3 (PH3). Scale bar: 200 μm.
- Quantification of the ratio of PH3 and PAX6 double‐positive cells versus the total number of PAX6‐positive cells of each rosette. Each plot represented an individual organoid (H9, n = 6; #6, n = 8; #23, n = 8 from 2 independent experiments). Three to five rosettes were analyzed for each organoid.
- Immunofluorescent staining was performed on sections of day 45 wildtype H9 and RGCC‐KO hCOs. Sections were stained with Ki67. Scale bar: 200 μm.
- Quantification of the VZ‐like Ki67‐positive rosette area. Each plot represented an individual rosette. H9, n = 60; #6, n = 54; #23, n = 96 from 2 independent experiments.
- Immunofluorescent staining was performed on sections of day 45 wildtype H9 and RGCC‐KO hCOs. Sections were stained with TUJ1 and PAX6. Scale bar: 200 μm.
- Quantification of the ratio of TUJ1 area versus PAX6 area. (H9, n = 15; #6, n = 6; #23, n = 9 from 2 independent experiment). Each plot represented an individual organoid. Three to five rosettes were analyzed for each organoid.
- Immunofluorescent staining was performed on sections of day 45 wildtype H9 and RGCC‐KO hCOs. Sections were stained with TBR1 and PAX6. Scale bar: 200 μm.
- Quantification of the ratio of TBR1‐positive area around PAX6‐positive area versus PAX6‐positive area in each rosette. (H9, n = 10; #6, n = 10; #23, n = 7 from 2 independent experiment). Each plot represented an individual organoid. Three to five rosettes were analyzed for each organoid.
- Immunofluorescent staining was performed on sections of day 45 wildtype H9 and RGCC‐KO hCOs. Sections were stained with CTIP2 and PAX6. Scale bar: 200 μm.
- Quantification of the ratio of CTIP2 area versus PAX6 area. (H9, n = 8; #6, n = 8; #23, n = 8 from 2 independent experiment). Each plot represented an individual organoid. Three to five rosettes were analyzed for each organoid.
Data information: The proliferating rosettes and apical surface adjust to ventricle‐like regions were highlight by white dash lines. VZ‐like rosette area was indicated by white dash lines, and the CP‐like area around VZ was illustrated by notes. Data are presented as mean ± SEM. Statistical significance was tested by one‐way ANOVA. *P < 0.05‡; **P < 0.01; ***P < 0.001; ****P < 0.0001. Abbreviation: VZ, ventricular zone; CP, cortical plate.
Knockout of RGCC dysregulates the gene expression of neuronal differentiation‐, spindle‐, and centrosome‐related genes
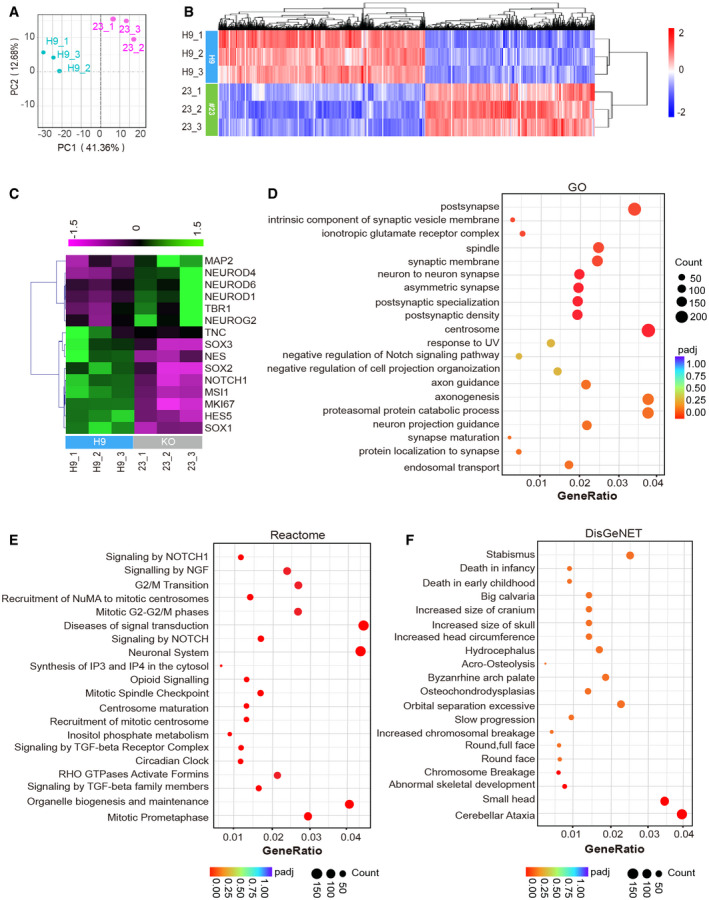
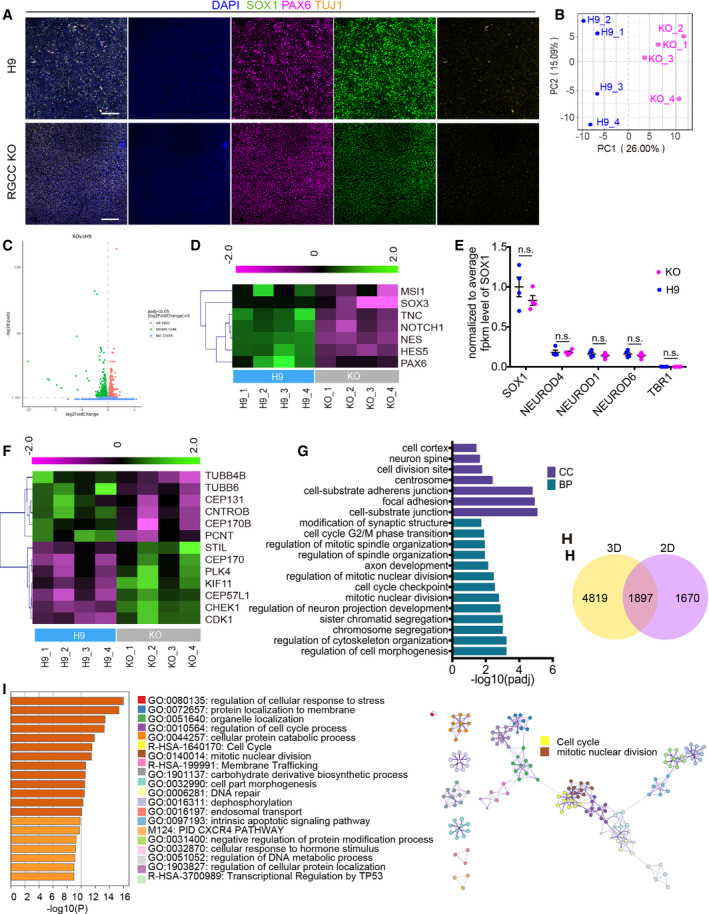
To explore the potential mechanisms by which RGCC regulates neocortical development, we performed RNA‐sequencing on 45‐day‐old hCOs derived from #23 RGCC‐deficient cells and H9 cells. Principal component analysis (PCA) confirmed the correspondence within each group and the differences between #23 and H9 organoids (Fig 4A). Meanwhile, all three #23 replicates and all three H9 replicates, respectively, fell into the same DEG hierarchical clusters (Fig 4B) (DESeq2, adjust P value < 0.05), showing organoid‐to‐organoid consistency in this experiment (Fig 4B). Since in previous experiments, we found that RGCC regulates NSC maintenance and fate determination, we first check whether RNA‐seq data showed the same trend. The expression of neural precursor markers and neurogenic transcription factors was analyzed in the RNA‐seq data. Results revealed that RGCC‐KO hCOs exhibited a decreased expression of NSC markers, including NES, SOX1, SOX2, SOX3, MSI1, NOTCH1, HES5, TNC, and cell cycle marker Ki67 (MKi67) (Fig 4C). Similar to immunostaining results, RNA‐seq analysis showed an increased expression of neurogenic transcriptional factors, including NEUROG2, NEUROD1, NEUROD4, NEUROD6, and neuronal markers such as MAP2 and TBR1, in RGCC‐KO hCOs compared to control hCOs (Fig 4C).
Figure 4. Transcriptome analysis of RGCC‐KO hCOs showed changes in spindle‐, centrosome‐, and developmental malformation‐related genes.
-
APrincipal component analysis of differential expressed genes between 45‐day‐old wildtype H9 hCOs and RGCC‐KO hCOs #23 based on RNA‐seq. Each plot represented an individual organoid (n = 3 for each groups from 1 experiment).
-
BHeatmap representing hierarchical cluster of 6716 DEGs (adjusted absolute log2(FC) > 0.5, P adj < 0.05).
-
CHeatmap representing DEGs of NSC markers and neuronal markers from RNA‐seq analysis (P adj < 0.05).
-
D–FGO, Reactome, and DisGeNET enrichment analysis of DEGs between WT H9 and RGCC‐KO.
Next, we performed Gene Ontology (GO), Reactome, and database of gene–disease associations (DisGeNET) enrichment analyses on differentially expressed genes (DEGs) between RGCC‐KO and control hCOs. Top 20 terms in GO analysis of DEGs between RGCC‐KO and control hCOs contained many enriched terms related to neuronal differentiation and maturation, such as the term Synapse maturation, Synaptic membrane, Neuron‐to‐neuron synapse, Postsynapse, Postsynaptic density, Protein localization to synapse, Axonogenesis Axon guidance, and Neuron projection guidance (Fig 4D). Top 20 terms in Reactome analysis of DEGs also contained term of Neuronal system (Fig 4E). These results indicated a major shift in gene expression from NSCs to differentiated neurons upon RGCC deletion, which is consistent with our IUE results in mice and immunostaining analysis in hCOs. In addition, we also found that Top 20 terms in Reactome analysis contained enriched terms of mitotic phase control, such as G2/M Transition, Mitotic G2‐G2/M‐phases, Mitotic Prometaphase, and Mitotic spindle checkpoint (Fig 4E). These results indicated the roles of RGCC in NSC cell cycle regulation. Moreover, strong enrichments of terms related to centrosome and spindle were observed in Reactome and GO analysis. In GO analysis, terms Spindle and Centrosome were among the top 20 significant enriched terms (Fig 4D). Meanwhile, in Reactome analysis, terms such as Mitotic Spindle Checkpoint, Recruitment of NuMA to mitotic centrosomes, Centrosome maturation, and Recruitment of mitotic centrosome were significantly enriched (Fig 4E). Collectively, these data implied that RGCC protein may function as a modulator of mitotic spindle and the centrosome in NSCs. Interestingly, genes related to Small Head and Cerebellar ataxia were remarkably enriched in DisGeNET analysis (Fig 4F), suggesting a plausible causal relation between loss or dysfunction of RGCC and the neurodevelopmental disorders.
Since those RNA‐seq analysis is from 45‐day‐old hCOs, which contained diverse neural cell types including NSCs, IPs, and neurons, the result might be a reflection of changes in different cell types populations. To evaluate the transcriptomic changes in cortical NSCs, we differentiated RGCC‐KO and H9 hESCs into NSCs using previously reported Dual‐SMAD inhibition 2D culture methods (Shi et al, 2012). Immunostaining of NSC markers SOX1 and PAX6, and neuronal marker TUJ1 showed that most of cells were NSCs 12 days after differentiation (Fig EV4A). PCA of transcriptome profiles showed the correspondence within each group and the differences between RGCC‐KO and H9 control NSCs (Fig EV4B). Meanwhile, 3,567 DEGs were found (Fig EV4C). Interestingly, although RGCC‐KO NSCs expressed NSC markers SOX1 and PAX6, the expression levels of many NSC markers such as MSI1, SOX3, TNC, NOTHC1, HES5, and PAX6 were lower than H9 control NSCs (Fig EV4D). This result suggested that stemness was impaired by RGCC deletion, while neuronal differentiation was not initiated yet due to the culture stage (Fig EV4E). Intriguingly, similar to RNA‐seq result from 3D hCOs, GO term analysis of 2D‐based NSCs revealed a enrichment of Cell division, Cell cycle G2/M‐phase, Cell cycle checkpoint, Mitotic nuclear division, Regulation of spindle organization, and Centrosome (Fig EV4F and G). We then checked the overlapped DEGs between 3D and 2D RNA‐seq results and found 1897 common DEGs shared by 3D hCO and 2D NSC RNA‐seq dataset (Fig EV4H). Further GO term analysis and Metascape network analysis (Zhou et al, 2019) of 2D/3D common DEGs showed that most of the DEGs were sub‐enriched into Cell cycle and mitotic nuclear division (Fig EV4I), which indicated the roles of RGCC on NSC fate determination might be cell cycle‐ and division‐related.
Figure EV4. Transcriptome analysis of RGCC‐KO 2D‐differentiated NSCs showed changes in NSCs, spindle‐, centrosome‐, and neurogenesis‐related genes.
- Immunofluorescent staining of the NSCs differentiated from H9 and RGCC‐KO hESCs by Dual‐SMAD inhibition 2D differentiation method. Most of cells express NSC markers SOX1 and PAX6, but not neuronal marker TUJ1, in both cell lines. Scale bar: 100 μm.
- Principal component analysis of differential expressed genes between wildtype H9 NSCs and RGCC‐KO NSCs #6 based on 2D RNA‐seq. Each plot represented an individual well of cells (n = 4 from two independent experiments); RNA samples of NSCs were collected at day 12 after neural differentiation.
- Volcano map of DEGs from NSC RNA‐seq (adjusted absolute log2(FC) > 0, P adj < 0.05).
- Heatmap representing DEGs of NSC markers from 2D RNA‐seq analysis (P adj < 0.05).
- The fpkm counts of neuronal genes were normalized to the fpkm count of SOX1 from both WT and KO group. Statistical significance was tested by one‐way ANOVA. Data are presented as mean ± SEM. Each plot represented an individual well of cells (n = 4 from two independent experiments) Abbreviation: n.s., not significant.
- Heatmap representing DEGs of centrosome‐, spindle‐, and microtube‐related genes from NSC RNA‐seq analysis (P adj < 0.05).
- Significant terms related to cell cycle and spindle from GO enrichment analysis of NSC RNA‐seq analysis.
- Venn diagram showed that the results of 3D hCOs and 2D NSCs RNA‐seq analysis shared 1897 same DEGs.
- Metascape analysis of those overlapping DEGs from panel H. GO enrichment analysis and network were made. The top 20 significantly enriched sub‐terms were showed in the left panel. The network was showed on the right panel. The size of the node corresponds to the number of genes within this sub‐term. Nodes with kappa similarity over 0.3 are linked by edges. Node of cell cycle and mitotic nuclear division were specially marked.
Loss of function of Rgcc impairs cell cycle and leads to mitotic spindle misorientation in neural stem cells
Although RGCC was named for its ability to regulate the cell cycle in various tissues in various functional contexts, its roles vary accordingly (Vlaicu et al, 2019). Transcriptomic profiling revealed that RGCC plays important roles in cell cycle regulation of NSCs. To explore its function in cell cycle regulation in the context of neocortical development, we examined two parameters, namely labeling index (LI) and cell cycle exit index (EI), by 24‐h‐BrdU labeling in the electroporated mouse cortex (Fig EV5A). LI and EI were calculated according to previous reports (Fig EV5B) (Takahashi et al, 1993; Chenn & Walsh, 2002). Results showed that Rgcc‐KD group displayed an increased EI value and a decreased LI value (Fig EV5C–E). To further specify the roles of Rgcc in NSC cell cycle regulation, we measured the total cell cycle length and length of different cell cycle stages of NSCs using cumulative EdU cell cycle quantification according to the previous established method (Takahashi et al, 1993; Cai et al, 1997; Martynoga et al, 2005; Contestabile et al, 2010; Bertacchi et al, 2020). E13.5 mice were electroporated with Rgcc shRNA or scramble‐shRNA, and brain tissues were collected 24 h after IUE. Mice were labeled with multiple EdU injections, such as 2, 4, and 6 h before sacrifice, and total cell cycle length as well as length of S‐phase were calculated (Fig 5A–C). Together with PH3 staining‐indicated G2‐ and M‐phase cells (Fig 5D) (Contestabile et al, 2010), the duration of different cell cycle stages of mouse NSCs were calculated quantitatively. Results showed that the S‐, G2‐, and M‐phase of Rgcc‐KD NSCs are all slightly shorten compared to control cells (Fig 5E). However, Rgcc‐KD cells had a significant longer G1 phase (Fig 5E), a typical neurogenic feature of NSCs (Calegari & Huttner, 2003; Calegari et al, 2005; Pilaz et al, 2009), which leads to an overall longer cell cycle length (Fig 5E). These results, consistent with our immunostaining observations, demonstrated the proneuronal differentiation of NSCs upon loss of Rgcc.
Figure EV5. KD Rgcc causes more NSCs leaving cell cycle.
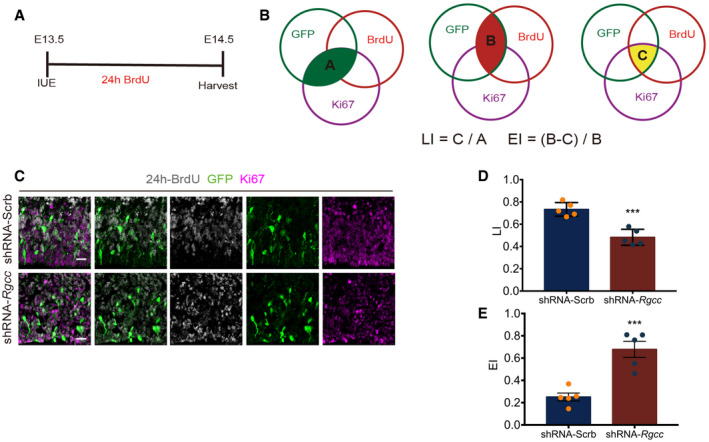
- Schematic of IUE and BrdU incorporation. IUE was performed at E13.5 and BrdU was injected immediately, then tissues were collected, and analyzed at E14.5.
- Venn figures were used to illustrate the calculation of LI and EI. Region A in green illustrated Ki67 and GFP double‐positive cell population. Region B in red illustrated BrdU and GFP double‐positive cell population. Region C in yellow illustrated Ki67, GFP, and BrdU triple‐positive cell population.
- Representative images of coronal sections of the E14.5 mouse cortex one day post‐IUE as well as 24 h post‐BrdU incorporation. ShRNA targeting Rgcc and control scramble‐shRNA were transfected separately. Sections were co‐stained with Ki67, BrdU, and GFP. Scale bars: 20 μm.
- Quantification of the LI index.
- Quantification of the EI index.
Data information: Data are presented as mean ± SEM; n = 5 mouse brains; Statistical significance was tested by Student’s t‐test. ***P < 0.001.
Figure 5. Knockdown of Rgcc affects cell cycle progress and deletion of Rgcc leads to mitotic spindle misorientation of NSCs in both the mouse brains and the hCOs.
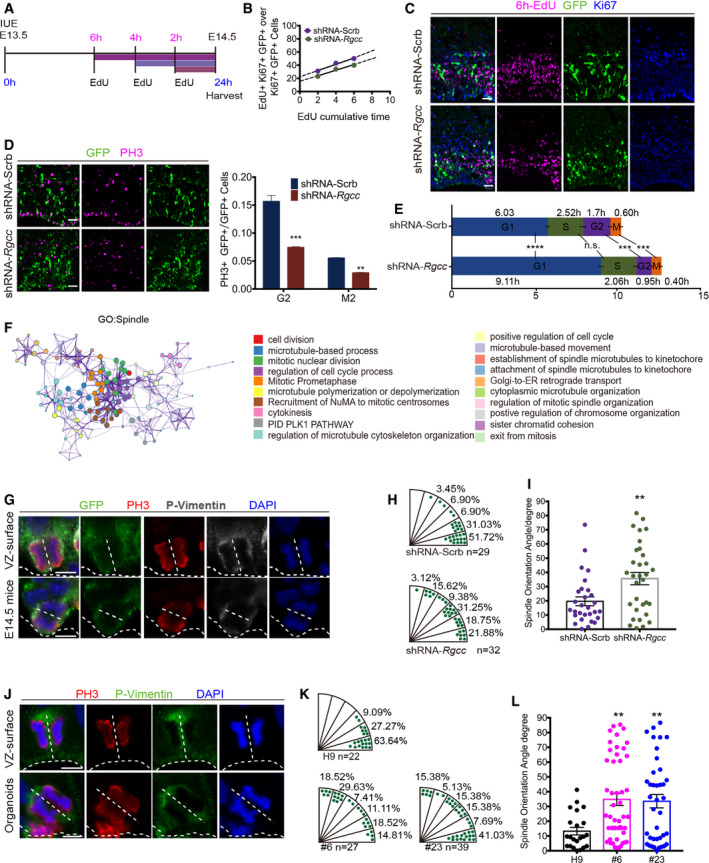
- Schematic of the IUE and cumulative EdU incorporation.
- Liner fit of EdU and Ki67 double‐positive NSC ratio for 6 h cumulative EdU incorporation. ShRNA‐Scrb: y = 9.21x + 23.23; shRNA‐Rgcc: y = 7.98x + 16.46. At least 3 brains were taken for each time points/group.
- Representative immunofluorescent staining for KI67, EdU, GFP of coronal sections of the E14.5 mouse cortex after IUE and 6 h EdU corporation. Scale bar: 20 μm.
- Immunofluorescent staining of coronal sections of the E14.5 mouse cortex one day post‐IUE. ShRNA targeting Rgcc and control scramble‐shRNA were nucleofected separately. PH3 were co‐stained with GFP. The punctuated PH3 cells were at G2‐phase, while PH3 cells with continuous pattern were at M‐phase. To quantify the ratio between PH3 and GFP double‐positive cells and GFP cells, only the cells in VZ and SVZ are taken into account. Scale bar: 20 μm. n ≥ 3 mouse brains for each group. Data are presented as mean ± SEM; n ≥ 3 mouse brains for each group; statistical significance was tested by Student’s t‐test. **P < 0.01; ***P < 0.001;
- Cell cycle length of E14.5 NSCs in mouse cortex 24 h post‐IUE of ShRNA‐Scrb (upper column) and shRNA‐Rgcc (lower column). This were calculated by cumulative EdU labeling and PH3 analysis. Data are presented as mean ± SEM; n ≥ 3 mouse brains for each group; statistical significance was tested by Student’s t‐test.
- Metascape analysis of differentially expressed spindle‐related genes between wildtype H9 hCOs and RGCC‐KO hCOs. (Adjusted absolute log2(FC) > 0.5, P adj < 0.05). List of DEGs under the GO term Spindle from 3D RNA‐seq results was clustered into sub‐terms to make enrichment network. The top 20 significantly enriched sub‐terms were showed in the right panel. Each color of the node represents a sub‐term. The size of the node corresponds to the number of genes within this sub‐term was shown in the middle panel. Sub‐terms with smaller P‐value were shown in the right panel. Nodes with kappa similarity over 0.3 are linked by edges.
- Representative pictures of mitotic NSC marked by P‐vimentin and PH3 revealed by DAPI at the apical surface of the E14.5 mouse cortex after IUE. A representative vertically dividing cell was shown in upper panel, and a representative horizontally dividing cell was shown in lower panel. White dash line indicates the apical surface and splitting plane. Scale bar: 5 μm.
- Distribution of mitotic spindle orientation of dividing cells from shRNA‐Scrb group and shRNA‐Rgcc group. Each plot represents a dividing cell (shRNA‐Scrb, n = 29; shRNA‐Rgcc, n = 32).
- Statistic analysis of splitting plane angle after Rgcc‐KD. Data were presented as mean ± SEM. Each plot represents a dividing cell (shRNA‐Scrb, n = 29; shRNA‐Rgcc, n = 39). Statistical significance was tested by Student’s t‐test. **P < 0.01.
- Representative pictures of mitotic NSC marked by P‐vimentin and PH3 revealed by DAPI at the apical surface of the VZ‐like area of hCOs. A representative vertically dividing cell was shown in upper panel, and a representative horizontally dividing cell was shown in lower panel. White dash line indicates the apical surface and splitting plane. Immunofluorescent staining was performed on sections of day 45 wildtype H9 hCOs and RGCC‐KO hCOs. Scale bar: 5 μm.
- Distribution of mitotic spindle orientation of dividing cells from wildtype H9 hCOs, #6 and #23 RGCC‐KO hCOs. Each plot represents a dividing cell (H9, n = 22; #6, n = 27; #23, n = 39 from 2 independent experiments).
- Statistic analysis of splitting plane angle in RGCC‐KO hCOs. Data were presented as mean ± SEM. Each plot represents a dividing cell (H9, n = 22; #6, n = 27; #23, n = 39 from 2 independent experiments). Statistical significance was tested by one‐way ANOVA. **P < 0.01; ***P < 0.001; ****P < 0.0001.
Data information: Abbreviation: n.s., not significant.
Proneuronal differentiation can be caused by misorientation of NSC spindle during mitotic division (Lancaster & Knoblich, 2012; Xie et al, 2013). In fact, many centrosomal proteins facilitate mitotic spindle assembly, and many brain malformation‐related genes such as ASPM, CEP135, CEP152, KIF11, MCPH1, and CDK5RAP2 are implicated in centrosome and spindle dysfunction in NSCs (Jayaraman et al, 2018; Gabriel et al, 2020). Previous Reactome and GO enrichment analyses from hCOs showed enrichment of terms for Spindle and Centrosome, which was further revealed by 3D metascape network analysis (Fig 5F). Thus, we wondered whether centrosome and spindle dysregulation of NSCs were responsible for proneuronal differentiation upon loss of RGCC. To test this hypothesis, we performed immunostaining to analyze spindle orientation of mitotic NSCs on mouse brain slices and hCO sections. Antibodies against PH3 and p‐vimentin were used to mark mitotic NSCs. According to previously reported protocols, only NSCs, which were adjacent to the apical surface and in anaphase or telophase, were analyzed (Xie et al, 2013). We measured the angle between the mitotic cleavage plane and apical VZ surface and used its complement angle to illustrate spindle orientation. In mouse brains electroporated with scramble‐shRNA, 51.72% of spindle orientations were between 0° and 15°. However, in Rgcc‐KD brains, only 21.88% of spindle orientations were between 0° and 15°, indicating a significant spindle misorientation in the Rgcc‐KD group when compared to scramble controls (Fig 5G–I). Consistent with the results of our analyses in developing mouse brains, RGCC deletion in hCOs also displayed a significant disruption in the cleavage plane when compared to controls (Fig 5J–L). These results indicated that RGCC is essential for proper spindle orientation during NSC dividing. Taking together, deletion of RGCC causes premature neurogenesis and exhaustion of NSC pool via disruption of spindle orientation, which eventually contributes to the size reduction phenotype during cortical development in hCOs.
Knockout of RGCC disrupts centrosome/spindle organization in hCOs
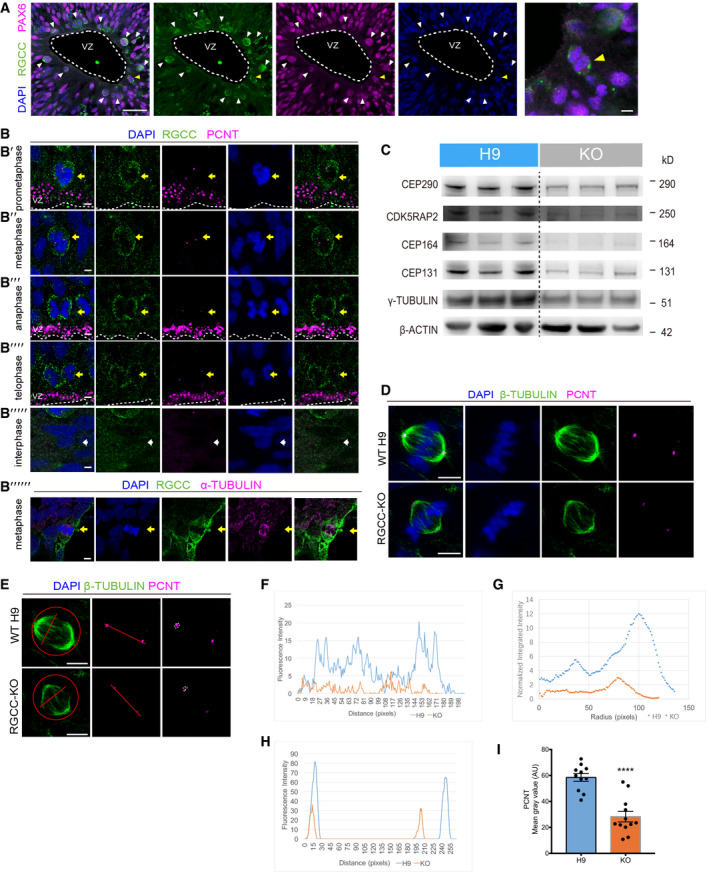
To understand how RGCC regulates spindle orientation during cell mitotic division of NSCs, we analyzed RGCC subcellular localization in NSCs from 3D‐cultured hCOs. Immunostaining of NSCs in 30‐day‐old hCO sections confirmed the expression of RGCC protein in NSCs (Fig 6A). Intriguingly, RGCC exhibits a cell cycle phase‐dependent manner of expression. Those NSCs going through mitosis have higher expression of RGCC (Fig 6A, arrowhead). Further, we found that RGCC protein tends to distribute around dividing nucleus and partially co‐localized with the centrosome during prometaphase, metaphase, anaphase, and telophase (Fig 6B’–B’’’’, yellow arrow), while mainly localized in the cytoplasm and were with relatively lower expression level during interphase (Fig 6B’’’’’, white arrow). This result is similar to the previous observations by overexpressing Myc‐tagged RGCC protein in human glioblastoma U87 MG cell line (Saigusa et al, 2007). In addition, we also observed that RGCC protein partially co‐localized with spindles in dividing NSCs from 2D‐differentiated approach (Fig 6B’’’’’’, yellow arrow). All those observation suggested that RGCC protein might directly participate in centrosome‐ and spindle‐related activities during mitosis.
Figure 6. The subcellular colocalization of RGCC protein.
-
ARGCC was co‐stained with PAX6 on proliferating rosettes of hCOs at day 30. RGCC exhibits specifically higher expression level on NSCs around apical surface (marked by arrowhead) adjust to ventricle‐like region (marked by white dash line). Scale bar: 50 μm. Representative image of one M‐phase NSC with higher RGCC expression around nucleus was show in right panel and marked by yellow arrowhead. Scale bar: 5 μm.
-
BRGCC was co‐stained with PCNT on 3D hCO slices. RGCC was with stronger expression in NSCs during M‐phase. prometaphase (B’), metaphase (B’’), anaphase (B’’’), and telophase (B’’’’). RGCC was expressed around nucleus in interphase (B’’’’’). NSCs undergoing prometaphase, metaphase, anaphase, and telophase were pointed out by yellow arrow. Interphase was pointed out by white arrow (B’’’’’). Immunostaining of 2D‐differentiated NSCs in metaphase showed partial colocalization of RGCC with α‐TUBULIN in the spindle (B’’’’’’, yellow arrow). Scale bar: 5 μm.
-
CThe Western blots results. Proteins were collected from WT hCOs and RGCC‐KO hCOs #6 at day 45. B‐ACTIN were used as references.
-
DPCNT was co‐stained with β‐TUBULIN on WT NSCs and RGCC‐KO NSCs differentiated by 2D‐cultured Dual‐SMAD inhibition method. Scale bar: 5 μm.
-
ERepresentative images of measuring fluorescence intensity of β‐TUBULIN and PCNT. Step‐by‐step details can be found in the Materials and Methods section. Scale bar: 5 μm.
-
FQuantification of fluorescence intensity of β‐TUBULIN‐positive spindle fibers.
-
GQuantification of mean fluorescence intensity of β‐TUBULIN‐positive spindle.
-
H, IQuantification of fluorescence intensity of PCNT‐positive centrosomes.
Data were presented as mean ± SEM. Each plot represents the average intensity of two PCNT‐positive region in one dividing cell (n = 11 for H9 cells; n = 12 for RGCC‐KO cells). Statistical significance was tested by Student's t‐test. ****P < 0.0001.
Previous Reactome enrichment analysis of RNA‐seq suggested that RGCC‐KO may affect centrosome and spindle in NSCs. Next, we examined whether RGCC deletion caused any abnormality in centrosome/spindle‐relevant protein expression. We performed Western blot analysis on some centrosome component proteins, such as CDK5RAP2, CEP164, CEP131, CEP290, and γ‐TUBULIN. Results showed that those proteins were all down‐regulated upon RGCC deletion (Fig 6C). To confirm those results, we performed immunostaining using PCNT antibody to detect centrosome, and β‐TUBULIN antibody to detect spindle on 2D‐differentiated NSCs from both wildtype H9 hESCs and RGCC‐deficient cells. Results from NSCs under metaphase revealed that RGCC abolishment disrupted the spindle and centrosome (Fig 6D). Compared to the wildtype control, β‐TUBULIN‐labeled spindle from RGCC‐KO NSCs showed impaired morphology (Fig 6D). Fluorescent intensity analysis showed reduced β‐TUBULIN signal for both spindle fibers (Fig 6E and F) and whole spindle (Fig 6E and G) further implied the disruption of spindle upon RGCC deletion. Additionally, fluorescent intensity analysis of PCNT staining exhibited a reduced signal, which also suggested an impaired centrosome in RGCC‐KO NSCs (Fig 6E, H, I). Taken together, all those observations implied that RGCC might play its roles in NSC fate determination by regulating centrosome/spindle organization.
Discussion
RGCC was previously reported to respond to complement activation in oligodendrocytes in vitro and thus was initially named as response gene to complement 32 (RGC32) (Badea et al, 1998). Due to its roles in modulating cell cycle progression that were discovered in the past decades, it was renamed as regulator of cell cycle (RGCC) (Counts & Mufson, 2017). RGCC has been reported to regulate multiple cellular processes in various tissues such as kidney (Guo et al, 2011; Li et al, 2011), liver and adipose tissue (Cui et al, 2015), nervous system (Counts & Mufson, 2017; Kim & Park, 2019; Vlaicu et al, 2019), smooth muscle, and heart (Vlaicu et al, 2016) and has been implicated in many pathologic conditions, including cardiovascular (Cui & Chen, 2018), metabolic (Cui et al, 2015), renal (Li et al, 2011; Niu et al, 2011), autoimmune (Sun & Chen, 2018; Kim & Park, 2019), and neurodegenerative diseases (Counts & Mufson, 2017), as well as several cancers (Fosbrink et al, 2005; Vlaicu et al, 2010; Zhu et al, 2012; Sun et al, 2013; Xu et al, 2014). However, the roles of RGCC vary in different tissues and pathological processes. For example, knocking down RGCC in human colon cancer cell line promoted entry into the S and G2/M‐phases (Vlaicu et al, 2010). RGCC overexpression impaired G2/M progression (Saigusa et al, 2007). On the contrary, in some other tissues such as human aortic smooth muscle, overexpression of RGCC drove S‐phase entry and G2/M cycling (Badea et al, 2002). RGCC has also been reported to be associated with human nervous system disorders such as multiple sclerosis (Tegla et al, 2013; Kim & Park, 2019) and Alzheimer’s disease (Counts & Mufson, 2017). However, the specific roles of RGCC in neural development, and cortical development in particular, have not yet been studied.
In this study, for the first time, we have provided evidence that RGCC plays essential roles in neocortical development by balancing the self‐renewal and neuronal differentiation of NSCs. RGCC deficiency results in enhanced cell cycle exit and asymmetric neurogenic division, leading to premature neurogenesis at the expense of NSC pools, which eventually cause a size‐reduction phenotype in the hCO model. Additionally, the results of loss‐of‐function analyses using mouse models as well as human cerebral organoid cultures revealed a conserved role of RGCC in NSCs across different species. In addition, our study suggested that RGCC plays its roles in NSC cell cycle promotion and mitotic spindle adjustment by regulating microtube–centrosomal organizations. Previously, it has been reported that RGCC was located at the poles of the centrosome/spindle and was up‐regulated from prophase to telophases in glioma cell lines, suggesting that RGCC could be a centrosome‐related gene (Saigusa et al, 2007). In our study, we found that RGCC was highly expressed in NSCs during their nuclear mitotic division and co‐localized partially with the centrosome and spindle. Deletion of RGCC impaired expression of many centrosomal component proteins, such as CEP164, PCNT, CDK5RAP2, and γ‐TUBULIN, which could contribute to the dysregulation of spindle orientation during NSC division. However, whether RGCC directly regulates centrosome organization and how it plays its roles in this essential biological process need further investigations.
Centrosome/spindle organization and assembly play essential roles in NSC fate determination. Disorganization of centrosome or misorientation of spindle during cell cycle will lead to serious brain malformation, such as microcephaly. Many genes related to centrosome formation and function, or spindle assembly, such as MCPH1, WDR62, CDK5RAP2, ASPM, CEP135, KIF11, and KIF14, have been identified in patients with neurodevelopmental disorders (Jayaraman et al, 2018; Pirozzi et al, 2018). Mutations in these genes and dysregulation of their functions usually lead to premature neurogenesis but the exhaustion of the NSC pool, ultimately resulting in inadequate neuron production and insufficient cortical expansion (Gilmore & Walsh, 2013; Sun & Hevner, 2014; Jayaraman et al, 2018). In our study, we identify a novel centrosome/spindle organization gene RGCC, which also regulated NSC cell cycle and division mode during cortical development. Although mutations in RGCC have not been identified in patients with brain malformations yet, it provides a novel candidate for further clinical investigations for human brain developmental disorders.
Materials and Methods
Plasmid constructs and materials
For knockdown constructs, shRNAs were cloned into pSuperior‐neo.GFP vector (OligoEngine, VEC‐IND‐0008). To test the shRNA‐Rgcc efficiency, mouse Rgcc‐V5 tag was cloned into pCAGIG vector (Addgene, #11159). For CRISPR‐Cas9‐mediated knockout constructs, sgRNAs targeting human RGCC were cloned into pX330 (Addgene, #42230) or pX458 (Addgene, #48138). To test sgRNA efficiency, human RGCC was cloned into pCAG‐GFP vector (Addgene, #11150). For deletion of RGCC, two guide RNAs respectively targeting 5’UTR and intron 2–3 were designed and cloned into pX458 vector (Addgene, #48138). Based on pBlueScript SK (+) (StrataGene), the homologous recombination donor was designed containing CAG‐eGFP‐expressing element flanked with two loxp sequences and two homology arms (HA), one covering upstream of 5’UTR and downstream of intron 2–3, respectively. The sequences of all used primers can be found in Appendix Table 1.
Animals
ICR (CD1) mice were maintained in the Animal Facility of the Bio‐X institute in Shanghai Jiao Tong University. All the animal experiments mentioned in this study were conducted following the instruction of National Research Council Guide for Care and Use of Laboratory Animals. All the animal experiments mentioned in this study were conducted under the approval of Experimental animal ethics and use Committee of Shanghai Jiao Tong University.
In utero electroporation
IUE was performed according to previously published protocol (Saito, 2006). Plasmid was prepared using Endo‐Free PlasTmid Maxi Kit (QIAGEN) and diluted to 1 μg/μl. Plasmid was mixed with Fast Green dye (Sigma) and electroporated into the dorsal cortex of the E13.5 embryonic mouse brain using ECM830 Electroporation system (BTX).
Cumulative EdU
To calculate the total cell cycle length and the length of individual cell cycle phase, we performed cumulative EdU cell cycle quantification according to previously reported methods (Takahashi et al, 1993; Cai et al, 1997; Martynoga et al, 2005; Pilaz et al, 2009; Contestabile et al, 2010). Pregnant mice were performed with IUE at E13.5 and were sacrificed precisely 24 h later. Mice were given multiple pulses of EdU injections at 6, 4, and 2 h (10 mg/kg body weight) intraperitoneally before harvest. EdU was administrated to the mice every 2 h for either three times, twice, or once (Fig 5A). For the cells counting, the number of actively cycling neural progenitors which had also been electroporated (Ki67+ GFP+) were further analyzed in this assay. At least three brain were taken for each time point in each group. The percentage of Ki67+ GFP+ Edu+ triple‐positive cells versus Ki6+ GFP+ were calculated for each time points. The linear regression analysis was calculated based on those data points. Data points collected from the same experiment group fall into one least‐square line (Microsoft Excel). By doing this, we got equations in the form of y = a* x + b. Total cell cycle time (TC) was calculated as TC = 1/a, and the length of S‐phase (TS) was calculated as TS = b/a. In addition, antibody against PH3 was used to distinguish the G2‐ and M‐phase, and the portion of G2‐phase PH3+ and GFP+ double‐positive cells versus total GFP+ cells (TG2), and the portion of M‐phase PH3+ and GFP+ double‐positive cells versus total GFP+ cell (TM) were calculated. Finally, TG1 was counted as TG1 = TC‐(TS+TG2+TM).
Human embryonic stem cell culture for making cell lines and generating hCOs
Feeder‐free H9 hESCs (WiCell) and RGCC‐KO cells were cultured on the Matrigel (Corning)‐coated plated with mTeSR medium (Stemcell Technologies). Feeder dependent H9 hESCs (WiCell) and RGCC‐KO hESCs were cultured on CF1‐γ‐irradiated mouse embryonic fibroblasts with hESC medium containing DMEM/F12 (Gibco), 20% KnockOut serum replacement (KSOR, Gibco), 0.5% GlutaMax (Gibco), 1% Non‐Essential Amino Acids Solution (MEM‐NEAA, Gibco), and 0.1 mM β‐mercaptoethanol (Amresco), with additional freshly added 4 ng/ml bFGF (Sino Biological). Standard procedures were used for culturing and passaging hESCs as previously described (Bian et al, 2018). All cells were verified with normal karyotype‐ and contamination‐free.
RGCC‐KO cell line
The RGCC knockout cell lines were established based on H9 hESCs using CRISPR‐Cas9 gene editing technique. Plasmids were transfected into cells by nucleofection using Neon Transfection system (Invitrogen) according to the manufacturer’s guidance. For deletion of RGCC, two guide RNAs respectively targeting 5’UTR and intron 2–3, as well as homologous recombination donor containing CAG‐eGFP‐expressing element flanked with two loxp sequences, were nucleofected into H9 hESCs. Via homologous recombination, eGFP expression element replaced the Exon1 and Exon2 of RGCC, by which the GFP+ RGCC‐deleted cells were isolated using FACS. Via nucleofecting pCAG‐Cre plasmid (Addgene, #13775) into GFP+ RGCC‐deleted cells, the eGFP expression element was removed and RGCC‐deleted cells were isolated by GFP‐ selection using FACS (Fig EV3A).
Generation of hCOs
Human cerebral organoids were cultured according to the protocol published by Lancaster and Knoblich (Lancaster et al, 2013). To generate EBs, H9 hESC or RGCC‐KO cells were treated with EDTA and Accutase to make single‐cell solutions. Then, 9,000 cells were plated into each well of a low‐binding 96‐well plate (Corning) in mTeSR medium containing 50 μM of ROCK inhibitors (Selleckchem). EBs were fed with fresh mTeSR without ROCK inhibitor 3 days after seeding and transferred to neural induction media at day 5. EBs were fed with fresh neural induction media every 2 days for 6 days and then embedded into Matrigel droplets and cultured in differentiation medium without vitamin A. Ten days later, the droplets were transferred into different medium with vitamin A on orbital shaker. Media were changed every five days, and the morphological appearance of each organoid in both KO and WT groups was carefully examined.
2D Neural stem cells differentiation
Human ESC‐derived 2D differentiation was performed using two protocols, the Dual‐SMAD inhibition method (Shi et al, 2012) and the neural rosette‐based method (Zhang et al, 2010). For Dual‐SMAD inhibition methods, hESCs were dissociated into single cells with TrypLE (Thermo #12605028) and plated in Matrigel‐coated 12‐well plate at the density of 70,000 cells/well in mTeSR medium supplied with 10 μM Y27632 (Selleck #S1049). Once the cells reached 95% confluence, neural induction was initiated by changing the medium to neural induction medium containing DMEM/F12 (Sigma #D6421), Neurobasal medium (Thermo #21103049) at 1:1, 1× glutaMAX (Thermo #35050061), 2 mM L‐glutamine (Thermo #A2916801), 0.5× NEAA (Thermo #11140050), 0.5× N2 (Thermo #17502048), 5 µg/mL insulin (Sigma #19278) and 100 μM 2‐Mercaptoethanol (Thermo #21985023), 0.5× B27 (Thermo #17504044). In addition, 1 μM Dorsomorphin (Selleck #S7840), and 10 μM SB431542 (Selleck #S1067) were supplied into neural induction medium. The hESCs were maintained in neural induction medium for 14 days and exhibit neural epithelial cell morphology. Then, the cells were dissociated with Accutase (STEMCELL Tech. #07920) and split 1:3 then seeded in poly‐L‐ornithine (Sigma #4957) and Laminin (Sigma #L2020)‐coated 12‐well plate in neural induction medium. For RNA‐sequence, hESCs were collected at day 12.
For neural rosette‐based 2D differentiation methods, hESCs were incubated with dispase (Gibco) at 37°C for detachment. Then, cells were cultured in suspension to form embryoid bodies (EBs) in hESC culture medium without bFGF. On day 4, the hESC culture medium was replaced with neural differentiation medium containing DMEM/F12 (Gibco), N2 supplement (Gibco), 1% NEAA (Gibco), and 2 μg/ml heparin (Sigma)). On day 7, the EBs were attached to plastic substrate and cultured with neural differentiation medium for 6–8 days, and the columnar neuroepithelia organized into rosette structures. The rosettes were physically resuspended and cultured in neural differentiation medium. On day 18, NSCs from neural rosettes were plated on cover glass for further inmmunostaining analysis.
In situ hybridization
Digoxigenin‐labeled anti‐sense RNA probe for mouse Rgcc was transcribed in vitro using Sp6 RNA polymerase based on pGEM‐T‐mRgcc construct. Brain sections were hybridized with probe at 65°C overnight. After washing, sections were blocked for 2 h at room temperature (RT). Then, sections were incubated with anti‐DIG antibody (1:1,500 dilution, Roche) at 4°C overnight. After washing, sections were incubated with BM Purple AP substrate (Roche) at RT avoiding light. Finally, the sections were mounted with mounting reagent.
Immunofluorescence staining and microscopy
Mouse brains and organoids were fixed in 4% paraformaldehyde (PFA) in PBS at 4°C overnight. Then, tissues were transfer to 30% sucrose overnight for dehydration and embedded in O.C.T (Sakura). Mouse brains and organoids were cryosectioned at 14 μm and 16 μm, respectively (Leica CM3050S). For antigen retrieval, brain sections were buffered in boiling antigen recovery solution (1 mM EDTA, 5 mM Tris at pH 8.0) for 15 min and cooled to RT. Sections were blocked at RT for 1 h in 0.5% Trion X‐100 and 4% bovine serum albumin (BSA). Sections were incubated with primary antibody at 4°C overnight and then incubated with secondary antibody at RT for 1 h.
For immunostaining on 2D‐cultured cells, cells cultured on coverslips were fixed with 4% paraformaldehyde at room temperature for 20 min and washed gently three times with PBS. The cells were blocked in 4% BSA, 0.1% Triton X‐100 in PBS for 1 h at room temperature. Then, the samples were incubated with primary antibody overnight at 4°C and secondary antibody for 1 h at room temperature.
Images in this project were taken by confocal microscopes (Leica TCS SP8). ImageJ software was used for image processing and fluorescence intensity quantification. To measure the fluorescence intensity of β‐TUBULIN‐positive spindle fibers, first, a line was drawn across spindle fibers, and the fluorescence signals along the line were detected and quantified by ImageJ. To measure the fluorescence intensity of a whole β‐TUBULIN‐positive spindle, a circle was drawn surrounding it. And the mean fluorescence signals in the circle were detected and quantified by ImageJ. To measure the fluorescence intensity of PCNT‐positive centrosome, first, a line was drawn across two PCNT spots. And the fluorescence signals along the line were detected and quantified by ImageJ. To evaluate the change of fluorescence intensity of PCNT between H9 and RGCC‐KO group, lines were drawn along the outline of PCNT‐positive centrosome. And the fluorescence signals inside the outline were detected and quantified by ImageJ.
Click‐it EdU staining
Cell proliferation assay was performed using the Click‐iT EdU cell proliferation kit according to manufacturer’s instruction (Invitrogen). The hESCs were pre‐planted in regular cell culture wells with coverslips. Later, 10 mM of EdU was applied on medium and incubate for 40 min. After incubation, coverslips were taken out for further cell fixation, permeablization, and staining. For mice brain slices, Click‐it reaction was performed after the incubation of secondary antibody. After Click‐it reaction, mouse brain slices were washed for three times in PBS and were treated with DAPI staining and further mounting procedures.
Western blot
Protein samples lysed from 45‐day‐old hCOs were loaded into NuPAGE 4‐12% Bis‐Tris gel (Thermo) and then transferred into PVDF membranes. These membranes then were incubated with primary at 4°C overnight and incubated with secondary antibodies at room temperature for 1 h.
RNA extraction, cDNA synthesis, and RT–qPCR
All the RNA samples were extracted using RNeasy mini kit (Qiagen). SuperScript III reverse transcriptase (Thermo Fisher), and random primers (Invitrogen) were applied for cDNA synthesized. Quantitative PCR was performed with GoTaq qPCR master mix (Promega) on CFX384 Touch Real‐Time PCR Detection System (Bio‐Rad).
Transcriptome sequencing and analysis
Organoids from RGCC‐KO group and control group were collected at day 45. RGCC‐KO and control NSCs differentiated using the Dual‐SMAD inhibition 2D method were collected 12 days post‐differentiation. Total RNAs were extracted with RNeasy mini kit (Qiagen). RNA quality was assessed with the RNA Nano 6000 Assay Kit of the Bioanalyzer 2100 system (Agilent Technologies). Sequencing libraries were prepared by NEB Next UltraTM RNA Library Prep Kit for Illumina following manufacturer’s protocol. Raw data of fastaq format were firstly cleaned by removing reads containing adapter, poly‐N, and low‐quality reads. And Q20, Q30, and GC content were calculated. For reads mapping, Hisat2 v2.0.5 was used for the index of reference genome. Feature Counts v1.5.0‐p3 was used for reads counting, and FPKM of each gene was calculated. Differential expression analysis of RGCC‐KO and H9 WT groups was carried out on DESeq2 R package. P‐values were adjusted by Benjamini and Hochberg’s approach. For DisGeNET, Reactome, and GO enrichment analyses of 3D organoids, DEGs with adjusted absolute log2(fold change (FC)) > 0.5 and adjusted P value < 0.05 (P adj) were analyzed. For GO enrichment analyses of 2D NSCs, DEGs with adjusted absolute log2(fold change (FC)) > 0 and adjusted P value < 0.05 (P adj) were analyzed. The heatmaps drawing for RNA‐seq in this experiment are all with adjusted P value < 0.05. Enrichment network analysis was performed on metascape (https://metascape.org/gp/index.html#/main/step1).
Statistical analysis
The data were analyzed with GraphPad PRISM 7.0a, and data were exhibited with the standard error of mean (± SEM). For comparison between two groups, statistical significance was carried out by unpaired t‐test. For comparison among three groups, ordinary one‐way ANOVA and multiple comparisons were performed.
Author contributions
GH and SB conceived the project. GH, SB, ZG designed experiments and wrote the manuscript. ZG performed experiments and analyzed the data. YC helped with the cells counting. LLiu and YS performed RNA‐seq data analysis. WN, LS, YB, DR, FY, and KH supported with reagents and analyzed data. MC, CC, LZ, LLi, YX, Q‐RB, SS, and QZ provided help in revision.
Conflict of interest
The authors declare that they have no conflict of interest.
Supporting information
Review Process File
Appendix
Expanded View Figures PDF
Acknowledgments
We are grateful to Anoop Kavirayani for his great help with the language editing and comments on the manuscripts and Jiajie Xi and Jifeng Fei for their technical supports. This project is supported by the National Key Research and Development Program (2016YFC0906400, 2020YFA0112500), Shanghai Science and Technology Innovation Project (20JC1418600), the National Nature Science Foundation of China (82071262, 81671326, 81421061, 81361120389, 31701086), Natural Science Foundation of Shanghai (20ZR1427200), Shanghai Municipal Science and Technology Major Project (2017SHZDZX01), the Shanghai Key Laboratory of Psychotic Disorders (13dz2260500), the Shanghai Leading Academic Discipline Project (B205), the Shanghai Pujiang Program (19PJ1410200), Key Project of the Science and Technology Commission of Shanghai Municipality (19JC1415300), Fundamental Research Funds for the Central Universities (22120190150, 22120210119), and Major Program of Development Fund for Shanghai Zhangjiang National Innovation Demonstration Zone (ZJ2018‐ZD‐004).
EMBO reports (2021) 22: e51781.
[Correction added on 13. August 2021, after first online publication: Affiliations 2 and 3 have been updated.]
Footnotes
Correction added on 3 September 2021, after first online publication: “*P < 0.1” was corrected to “*P < 0.05”.
Contributor Information
Shan Bian, Email: shan_bian@tongji.edu.cn.
Guang He, Email: heguang@sjtu.edu.cn.
Data availability
The RNA‐seq data have been deposited in NCBI’s Gene Expression Omnibus and are accessible through GEO Series accession number GSE173391 (https://www.ncbi.nlm.nih.gov/geo/query/acc.cgi?acc=GSE173391).
References
- Badea TC, Niculescu FI, Soane L, Shin ML, Rus H (1998) Molecular cloning and characterization of RGC‐32, a novel gene induced by complement activation in oligodendrocytes. J Biol Chem 273: 26977–26981 [DOI] [PubMed] [Google Scholar]
- Badea T, Niculescu F, Soane L, Fosbrink M, Sorana H, Rus V, Shin ML, Rus H (2002) RGC‐32 increases p34(CDC2) kinase activity and entry of aortic smooth muscle cells into S‐phase. J Biol Chem 277: 502–508 [DOI] [PubMed] [Google Scholar]
- Bertacchi M, Romano AL, Loubat A, Tran Mau‐Them F, Willems M, Faivre L, Khau van Kien P, Perrin L, Devillard F, Sorlin Aet al (2020) NR2F1 regulates regional progenitor dynamics in the mouse neocortex and cortical gyrification in BBSOAS patients. EMBO J 39: e104163 [DOI] [PMC free article] [PubMed] [Google Scholar]
- Bian S, Repic M, Guo Z, Kavirayani A, Burkard T, Bagley JA, Krauditsch C, Knoblich JA (2018) Genetically engineered cerebral organoids model brain tumor formation. Nat Methods 15: 631–639 [DOI] [PMC free article] [PubMed] [Google Scholar]
- Cai L, Hayes NL, Nowakowski RS (1997) Local homogeneity of cell cycle length in developing mouse cortex. J Neurosci 17: 2079–2087 [DOI] [PMC free article] [PubMed] [Google Scholar]
- Calegari F, Haubensak W, Haffner C, Huttner WB (2005) Selective lengthening of the cell cycle in the neurogenic subpopulation of neural progenitor cells during mouse brain development. J Neurosci 25: 6533–6538 [DOI] [PMC free article] [PubMed] [Google Scholar]
- Calegari F, Huttner WB (2003) An inhibition of cyclin‐dependent kinases that lengthens, but does not arrest, neuroepithelial cell cycle induces premature neurogenesis. J Cell Sci 116: 4947–4955 [DOI] [PubMed] [Google Scholar]
- Chenn A, Walsh CA (2002) Regulation of cerebral cortical size by control of cell cycle exit in neural precursors. Science 297: 365–369. [DOI] [PubMed] [Google Scholar]
- Contestabile A, Fila T, Ba Rtesaghi R, Ciani E (2010) Cell cycle elongation impairs proliferation of cerebellar granule cell precursors in the Ts65Dn mouse, an animal model for down syndrome. Brain Pathol 19: 224–237 [DOI] [PMC free article] [PubMed] [Google Scholar]
- Counts SE, Mufson EJ (2017) Regulator of cell cycle (RGCC) expression during the progression of Alzheimer’s disease. Cell Transplant 26: 693–702 [DOI] [PMC free article] [PubMed] [Google Scholar]
- Cui XB, Chen SY (2018) Response Gene to Complement 32 in Vascular Diseases. Front Cardiovasc Med 5: 128 [DOI] [PMC free article] [PubMed] [Google Scholar]
- Cui X‐B, Guo X, Chen S‐Y (2013) Response gene to complement 32 deficiency causes impaired placental angiogenesis in mice. Cardiovasc Res 99: 632–639 [DOI] [PMC free article] [PubMed] [Google Scholar]
- Cui X‐B, Luan J‐N, Ye J, Chen S‐Y (2015) RGC32 deficiency protects against high‐fat diet‐induced obesity and insulin resistance in mice. J Endocrinol 224: 127–137 [DOI] [PMC free article] [PubMed] [Google Scholar]
- Florio M, Huttner WB (2014) Neural progenitors, neurogenesis and the evolution of the neocortex. Development 141: 2182–2194 [DOI] [PubMed] [Google Scholar]
- Fosbrink M, Cudrici C, Niculescu F, Badea TC, David S, Shamsuddin A, Shin ML, Rus H (2005) Overexpression of RGC‐32 in colon cancer and other tumors. Exp Mol Pathol 78: 116–122 [DOI] [PubMed] [Google Scholar]
- Gabriel E, Ramani A, Altinisik N, Gopalakrishnan J (2020) Human brain organoids to decode mechanisms of microcephaly. Front Cell Neurosci 14: 115 [DOI] [PMC free article] [PubMed] [Google Scholar]
- Gilmore EC, Walsh CA (2013) Genetic causes of microcephaly and lessons for neuronal development. Wiley Interdiscip Rev Dev Biol 2: 461–478 [DOI] [PMC free article] [PubMed] [Google Scholar]
- Götz M, Huttner WB (2005) The cell biology of neurogenesis. Nat Rev Mol Cell Biol 6: 777–788 [DOI] [PubMed] [Google Scholar]
- Guo X, Jose PA, Chen S‐Y (2011) Response gene to complement 32 interacts with Smad3 to promote epithelial‐mesenchymal transition of human renal tubular cells. Am J Physiol Cell Physiol 300: C1415–C1421 [DOI] [PMC free article] [PubMed] [Google Scholar]
- Hevner RF, Shi L, Justice N, Hsueh Y‐P, Sheng M, Smiga S, Bulfone A, Goffinet AM, Campagnoni AT, Rubenstein JLR (2001) Tbr1 regulates differentiation of the preplate and layer 6. Neuron 29: 353–366 [DOI] [PubMed] [Google Scholar]
- Huang W‐Y, Xie W, Guo X, Li F, Jose PA, Chen S‐Y (2011) Smad2 and PEA3 cooperatively regulate transcription of response gene to complement 32 in TGF‐beta‐induced smooth muscle cell differentiation of neural crest cells. Am J Physiol Cell Physiol 301: C499–506 [DOI] [PMC free article] [PubMed] [Google Scholar]
- Jayaraman D, Bae B‐I, Walsh CA (2018) The genetics of primary microcephaly. Annu Rev Genomics Hum Genet 19: 177–200 [DOI] [PubMed] [Google Scholar]
- Kim D, Park Y (2019) Molecular mechanism for the multiple sclerosis risk variant rs17594362. Hum Mol Genet 28: 3600–3609 [DOI] [PMC free article] [PubMed] [Google Scholar]
- Lancaster MA, Knoblich JA (2012) Spindle orientation in mammalian cerebral cortical development. Curr Opin Neurobiol 22: 737–746 [DOI] [PMC free article] [PubMed] [Google Scholar]
- Lancaster MA, Renner M, Martin CA, Wenzel D, Bicknell LS, Hurles ME, Homfray T, Penninger JM, Jackson AP, Knoblich JA (2013) Cerebral organoids model human brain development and microcephaly. Nature 501: 373–379 [DOI] [PMC free article] [PubMed] [Google Scholar]
- Li Z, Xie WB, Escano CS, Asico LD, Xie Q, Jose PA, Chen SY (2011) Response gene to complement 32 is essential for fibroblast activation in renal fibrosis. J Biol Chem 286: 41323–41330 [DOI] [PMC free article] [PubMed] [Google Scholar]
- Loo L, Simon JM, Xing L, McCoy ES, Niehaus JK, Guo J, Anton ES, Zylka MJ (2019) Single‐cell transcriptomic analysis of mouse neocortical development. Nat Commun 10: 134 [DOI] [PMC free article] [PubMed] [Google Scholar]
- Lui J, Hansen D, Kriegstein A (2011) Development and evolution of the human neocortex. Cell 146: 18–36 [DOI] [PMC free article] [PubMed] [Google Scholar]
- Martynoga B, Morrison H, Price DJ, Mason JO (2005) Foxg1 is required for specification of ventral telencephalon and region‐specific regulation of dorsal telencephalic precursor proliferation and apoptosis. Dev Biol 283: 113–127 [DOI] [PubMed] [Google Scholar]
- Mérot Y, Rétaux S, Heng JIT (2009) Molecular mechanisms of projection neuron production and maturation in the developing cerebral cortex. Semin Cell Dev Biol 20: 726–734 [DOI] [PubMed] [Google Scholar]
- Miller JA, Ding S‐L, Sunkin SM, Smith KA, Ng L, Szafer A, Ebbert A, Riley ZL, Royall JJ, Aiona Ket al (2014) Transcriptional landscape of the prenatal human brain. Nature 508: 199–206 [DOI] [PMC free article] [PubMed] [Google Scholar]
- Molyneaux BJ, Arlotta P, Menezes JRL, Macklis JD (2007) Neuronal subtype specification in the cerebral cortex. Nat Rev Neurosci 8: 427–437 [DOI] [PubMed] [Google Scholar]
- Niculescu F, Badea T, Rus H (1998) Sublytic C5b–9 induces proliferation of human aortic smooth muscle cells. Mol Immunol 35: 400 [DOI] [PubMed] [Google Scholar]
- Niu X‐L, Kuang X‐Y, Zhang Z‐G, Liu X‐G, Zhao Z‐H, Zhang X, Xu H, Huang W‐Y (2011) Expression of response gene to complement‐32 in renal tissue of children with immunoglobulin A nephropathy. Scand J Urol Nephrol 45: 371–376 [DOI] [PubMed] [Google Scholar]
- Nowakowski TJ, Bhaduri A, Pollen AA, Alvarado B, Mostajo‐Radji MA, Di Lullo E, Haeussler M, Sandoval‐Espinosa C, Liu SJ, Velmeshev Det al (2017) Spatiotemporal gene expression trajectories reveal developmental hierarchies of the human cortex. Science 358: 1318–1323 [DOI] [PMC free article] [PubMed] [Google Scholar]
- Paridaen JT, Huttner WB (2014) Neurogenesis during development of the vertebrate central nervous system. EMBO Rep 15: 351–364 [DOI] [PMC free article] [PubMed] [Google Scholar]
- Pilaz L‐J, Patti D, Marcy G, Ollier E, Pfister S, Douglas RJ, Betizeau M, Gautier E, Cortay V, Doerflinger Net al (2009) Forced G1‐phase reduction alters mode of division, neuron number, and laminar phenotype in the cerebral cortex. Proc Natl Acad Sci USA 106: 21924–21929 [DOI] [PMC free article] [PubMed] [Google Scholar]
- Pirozzi F, Nelson B, Mirzaa G (2018) From microcephaly to megalencephaly: determinants of brain size. Dialogues Clin Neurosci 20: 267–282 [DOI] [PMC free article] [PubMed] [Google Scholar]
- Saigusa K, Imoto I, Tanikawa C, Aoyagi M, Ohno K, Nakamura Y, Inazawa J (2007) RGC32, a novel p53‐inducible gene, is located on centrosomes during mitosis and results in G2/M arrest. Oncogene 26: 1110–1121 [DOI] [PubMed] [Google Scholar]
- Saito T (2006) In vivo electroporation in the embryonic mouse central nervous system. Nat Protoc 1: 1552–1558 [DOI] [PubMed] [Google Scholar]
- Shi Y, Kirwan P, Livesey FJ (2012) Directed differentiation of human pluripotent stem cells to cerebral cortex neurons and neural networks. Nat Protoc 7: 1836–1846 [DOI] [PubMed] [Google Scholar]
- Sun C, Chen S‐Y (2018) RGC32 Promotes bleomycin‐induced systemic sclerosis in a murine disease model by modulating classically activated macrophage function. J Immunol 200: 2777–2785 [DOI] [PMC free article] [PubMed] [Google Scholar]
- Sun Q, Yao X, Ning Y, Zhang W, Zhou G, Dong Y (2013) Overexpression of response gene to complement 32 (RGC32) promotes cell invasion and induces epithelial‐mesenchymal transition in lung cancer cells via the NF‐kappaB signaling pathway. Tumour Biol 34: 2995–3002 [DOI] [PubMed] [Google Scholar]
- Sun T, Hevner RF (2014) Growth and folding of the mammalian cerebral cortex‐ from molecules to malformations. Nat Rev Neurosci 15: 217–232 [DOI] [PMC free article] [PubMed] [Google Scholar]
- Takahashi T, Nowakowski R, Caviness V (1993) Cell cycle parameters and patterns of nuclear movement in the neocortical proliferative zone of the fetal mouse. J Neurosci 13: 820 [DOI] [PMC free article] [PubMed] [Google Scholar]
- Tang R, Zhang G, Chen S‐Y (2014) Response gene to complement 32 protein promotes macrophage phagocytosis via activation of protein kinase C pathway. J Biol Chem 289: 22715–22722 [DOI] [PMC free article] [PubMed] [Google Scholar]
- Tegla CA, Cudrici CD, Azimzadeh P, Singh AK, Trippe R, Khan A, Chen H, Andrian‐Albescu M, Royal W, Bever Cet al (2013) Dual role of Response gene to complement‐32 in multiple sclerosis. Exp Mol Pathol 94: 17–28 [DOI] [PubMed] [Google Scholar]
- Tegla CA, Cudrici CD, Nguyen V, Danoff J, Kruszewski AM, Boodhoo D, Mekala AP, Vlaicu SI, Chen C, Rus Vet al (2015) RGC‐32 is a novel regulator of the T‐lymphocyte cell cycle. Exp Mol Pathol 98: 328–337 [DOI] [PMC free article] [PubMed] [Google Scholar]
- Vlaicu SI, Cudrici C, Ito T, Fosbrink M, Tegla CA, Rus V, Mircea PA, Rus H (2008) Role of response gene to complement 32 in diseases. Arch Immunol Ther Exp (Warsz) 56: 115–122 [DOI] [PMC free article] [PubMed] [Google Scholar]
- Vlaicu SI, Tatomir A, Boodhoo D, Ito T, Fosbrink M, Cudrici C, Mekala AP, Ciriello J, Crişan D, Boţan Eet al (2016) RGC‐32 is expressed in the human atherosclerotic arterial wall: Role in C5b‐9‐induced cell proliferation and migration. Exp Mol Pathol 101: 221–230 [DOI] [PubMed] [Google Scholar]
- Vlaicu SI, Tatomir A, Anselmo F, Boodhoo D, Chira R, Rus V, Rus H (2019) RGC‐32 and diseases: the first 20 years. Immunol Res 67: 267–279 [DOI] [PubMed] [Google Scholar]
- Vlaicu SI, Tegla CA, Cudrici CD, Fosbrink M, Nguyen V, Azimzadeh P, Rus V, Chen H, Mircea PA, Shamsuddin Aet al (2010) Epigenetic modifications induced by RGC‐32 in colon cancer. Exp Mol Pathol 88: 67–76 [DOI] [PMC free article] [PubMed] [Google Scholar]
- Xie Y, Jüschke C, Esk C, Hirotsune S, Knoblich JA (2013) The phosphatase PP4c controls spindle orientation to maintain proliferative symmetric divisions in the developing neocortex. Neuron 79: 254–265 [DOI] [PMC free article] [PubMed] [Google Scholar]
- Xu R, Shang C, Zhao J, Han Y, Liu J, Chen K, Shi W (2014) Knockdown of response gene to complement 32 (RGC32) induces apoptosis and inhibits cell growth, migration, and invasion in human lung cancer cells. Mol Cell Biochem 394: 109–118 [DOI] [PubMed] [Google Scholar]
- Zhang X, Huang CT, Chen J, Pankratz MT, Xi J, Li J, Yang Y, LaVaute TM, Li X‐J, Ayala Met al (2010) Pax6 is a human neuroectoderm cell fate determinant. Cell Stem Cell 7: 90–100 [DOI] [PMC free article] [PubMed] [Google Scholar]
- Zhao P, Gao D, Wang Q, Song B, Shao Q, Sun J, Ji C, Li X, Li P, Qu X (2015) Response gene to complement 32 (RGC‐32) expression on M2‐polarized and tumor‐associated macrophages is M‐CSF‐dependent and enhanced by tumor‐derived IL‐4. Cell Mol Immunol 12: 692–699 [DOI] [PMC free article] [PubMed] [Google Scholar]
- Zhou Y, Zhou B, Pache L, Chang M, Khodabakhshi AH, Tanaseichuk O, Benner C, Chanda SK (2019) Metascape provides a biologist‐oriented resource for the analysis of systems‐level datasets. Nat Commun 10: 1532 [DOI] [PMC free article] [PubMed] [Google Scholar]
- Zhu L, Qin H, Li P‐Y, Xu S‐N, Pang H‐F, Zhao H‐Z, Li D‐M, Zhao Q (2012) Response gene to complement‐32 enhances metastatic phenotype by mediating transforming growth factor beta‐induced epithelial‐mesenchymal transition in human pancreatic cancer cell line BxPC‐3. J Exp Clin Cancer Res 31: 29 [DOI] [PMC free article] [PubMed] [Google Scholar]
Associated Data
This section collects any data citations, data availability statements, or supplementary materials included in this article.
Supplementary Materials
Review Process File
Appendix
Expanded View Figures PDF
Data Availability Statement
The RNA‐seq data have been deposited in NCBI’s Gene Expression Omnibus and are accessible through GEO Series accession number GSE173391 (https://www.ncbi.nlm.nih.gov/geo/query/acc.cgi?acc=GSE173391).