

Abstract
HP1 proteins are best known as markers of heterochromatin and gene silencing. Yet, they are also RNA‐binding proteins and the HP1γ/CBX3 family member is present on transcribed genes together with RNA polymerase II, where it regulates co‐transcriptional processes such as alternative splicing. To gain insight in the role of the RNA‐binding activity of HP1γ in transcriptionally active chromatin, we have captured and analysed RNAs associated with this protein. We find that HP1γ is specifically targeted to hexameric RNA motifs and coincidentally transposable elements of the SINE family. As these elements are abundant in introns, while essentially absent from exons, the HP1γ RNA association tethers unspliced pre‐mRNA to chromatin via the intronic regions and limits the usage of intronic cryptic splice sites. Thus, our data unveil novel determinants in the relationship between chromatin and co‐transcriptional splicing.
Keywords: Cbx3, chromatin, HP1, RNA, splicing
Subject Categories: Chromatin, Epigenetics, Genomics & Functional Genomics; RNA Biology
HP1γ associates with pre‐mRNA preferentially at specific repeat motifs enriched in introns, and this association affects co‐transcriptional processes such as alternative splicing.
Introduction
Maintenance and propagation of the transcriptionally inactive heterochromatin extensively relies on Heterochromatin Protein 1 (HP1), a family of proteins identified in a large variety of species, ranging from fission yeast to man (Almouzni & Probst, 2011). Mammals typically express three isoforms of HP1, namely HP1α/CBX5, HP1β/CBX1 and HP1γ/CBX3, each with unique subnuclear localization patterns (Minc et al, 2000; Dialynas et al, 2007). HP1 proteins bind histone H3 trimethylated at Lysines 9 (H3K9me3) via their N‐terminal chromodomain (Bannister et al, 2001; Lachner et al, 2001). At their C‐terminus, a chromoshadow domain ensures dimerization and mediates interaction with numerous molecular partners characterized by the presence of a PXVXL motif (Smothers & Henikoff, 2000). In‐between these two structurally very similar globular domains, an unstructured region known as the Hinge harbours both DNA and RNA‐binding activity (Hiragami‐Hamada et al, 2016).
The RNA‐binding activity of HP1 proteins seems very important for their molecular function. In the fission yeast Schizosaccharomyces pombe, HP1/Swi6 associates with noncoding transcripts expressed in centromeric heterochromatin, and its silencing activity relies on a mechanism involving RNAi‐dependent degradation of these transcripts (Motamedi et al, 2008). This process was later shown to involve a dynamic trafficking of HP1/Swi6 between its free, H3K9me‐bound and RNA‐bound forms, leading to the repression of heterochromatin (Keller et al, 2012). For murine and human HP1α, the RNA‐binding activity of the Hinge is essential for the targeting of this protein to heterochromatin, possibly even more so than the H3K9me3 histone modification (Maison et al, 2002; Muchardt et al, 2002; Maison et al, 2011). While HP1 proteins may bind multiple families of RNA species (Piacentini et al, 2009), mouse HP1α was shown to specifically bind pericentromeric RNA transcripts from the major satellites, a family of repeats particularly abundant in pericentromeric heterochromatin (Maison et al, 2011; Maison et al, 2016).
Beyond their role in structuring heterochromatin, HP1 proteins also function as regulators of euchromatic transcription. For instance, at the promoters of many inducible genes involved in development or in cellular defence, they participate in the transient silencing of transcription while awaiting stimulation (Mateescu et al, 2008; Sridharan et al, 2013; Harouz et al, 2014; Huang et al, 2017; Sun et al, 2017; Casale et al, 2019). But HP1 proteins, in particular HP1γ in mammals, are also present inside the coding region of genes (Vakoc et al, 2005), a localization which is not always correlated with H3K9me3 (Sridharan et al, 2013). The association of HP1γ with transcribed genes is consistent with a role for this protein in co‐transcriptional mechanisms such as termination (Skourti‐Stathaki et al, 2014), and regulation of alternative splicing (Allo et al, 2009; Saint‐Andre et al, 2011; Ameyar‐Zazoua et al, 2012; Smallwood et al, 2012; Yearim et al, 2015).
Splicing is a maturation process of RNA polymerase II transcripts catalysed by the Spliceosome complex and leading to the formation of mature mRNA by excision of introns and joining of exons. Most human genes undergo alternative splicing which gives rise to multiple mRNAs from a single gene locus (Pan et al, 2008; Wang et al, 2008). As splicing is mostly co‐transcriptional and occurs in the close vicinity of chromatin, it is influenced by a large number of chromatin‐associated factors (Luco et al, 2011; Allemand et al, 2016). In this context, we have shown earlier that recruitment of AGO proteins and HP1γ to CD44 and other genes favours intragenic H3K9 methylation and affects the outcome of alternative splicing by targeting the spliceosome to specific sites inside the gene body (Saint‐Andre et al, 2011).
Our study on the CD44 gene also unveiled an interaction between intragenic chromatin and pre‐mRNA which was dependent on HP1γ and seemed to modulate the outcome of splicing (Saint‐Andre et al, 2011). To gain further understanding of this HP1‐dependent relationship between chromatin and transcripts, we have here analysed the genome‐wide association of HP1γ with RNA by a chromatin‐enriched RNA immunoprecipitation (RNAchIP) assay. We find that HP1γ is preferentially targeted to intronic regions on RNA, due to the presence therein of hexameric motifs. Consequently, HP1γ‐bound RNAs are also enriched in B4 SINEs, a family of euchromatic transposable repeat elements which harbours high proportions of these hexameric motifs. The consequence of this RNA binding by HP1γ is a tethering of unspliced pre‐mRNA to chromatin via the intronic region. This way, HP1γ limits the usage of intronic cryptic splice sites. These observations reconcile the heterochromatic and euchromatic functions of HP1, by showing that its role in mRNA maturation, alike its role in heterochromatin structuring, relies on its ability to associate with repeat‐encoded RNAs.
Results
HP1γ associates with chromatin‐enriched RNA
To better understand the relationship between HP1γ and RNA in the functionality of this protein, beyond its classical role in heterochromatin formation, we used a genome‐wide approach to identify chromatin‐bound RNA species interacting with HP1γ (RNAchIP; Fig 1A). For this, we used a modification of our previously described strategy to solubilize native chromatin and produce chromatin‐enriched RNA fragments suitable for immunoprecipitation (Saint‐Andre et al, 2011) (Fig EV1C). HP1γ −/− (KO cells) mouse embryonic fibroblast (MEF)‐derived cell lines, re‐complemented with FLAG‐tagged HP1γ (HP1γ cells) as previously described were used in these assays (Harouz et al, 2014). These cells expressed ectopic FLAG‐tagged HP1γ at a level similar to that of endogenous HP1γ in WT MEFs (Fig EV1A). In these experiments, cells were treated or not with the phorbol ester PMA. This activator of the PKC signalling pathway was previously shown to induce HP1γ phosphorylation in its hinge region and to modulate its activity on a subset of responsive genes (Harouz et al, 2014). Nuclei were isolated to obtain a chromatin‐enriched RNA fraction, (Fig EV1A and B). Our procedure included a step of limited crosslinking in order to stabilize association of HP1γ with RNA. We therefore expected to detect both direct and indirect HP1γ‐RNA associations. Yet, the anti‐FLAG antibody did not precipitate any of the HP1γ‐interacting proteins we tested, suggesting that our highly stringent immunoprecipitation conditions eliminated most indirect interactions (HP1α, H3, RNA polymerase II) (Fig EV1B). RNAs present in the chromatin fraction (input) or collected by HP1γ RNAchIP (IP) were then analysed by Illumina sequencing in biological triplicates and reads were mapped onto the mouse genome (RNAchIP‐seq). At most genes, RNA levels in the IP were correlated with levels in the input (see example of the stress‐responsive Fosl1 gene Fig 1B left). Normalized read counts per gene body (input and IP) confirmed this correlation genome‐wide in both unstimulated and PMA‐stimulated cells (Fig 1C). RNAchIP experiments were then repeated using either HP1γ cells or the parental HP1γ KO cells. RT–qPCR at the Fosl1 gene (Fig 1B; arrow) and at other genes (Fig EV2) confirmed the dependence of HP1γ RNAchIP signal on the presence of HP1γ (Figs 1D and EV2B). Interestingly, at a small number of genes, many of which encoding histones, the IP signal from the HP1γ RNAchIP data seemed uncoupled from that of the input, indicating that HP1γ does not equally associate to all transcripts (Hist1h4a and Hist1h3a, Fig 1B right).
Figure 1. HP1γ associates with RNA on chromatin.
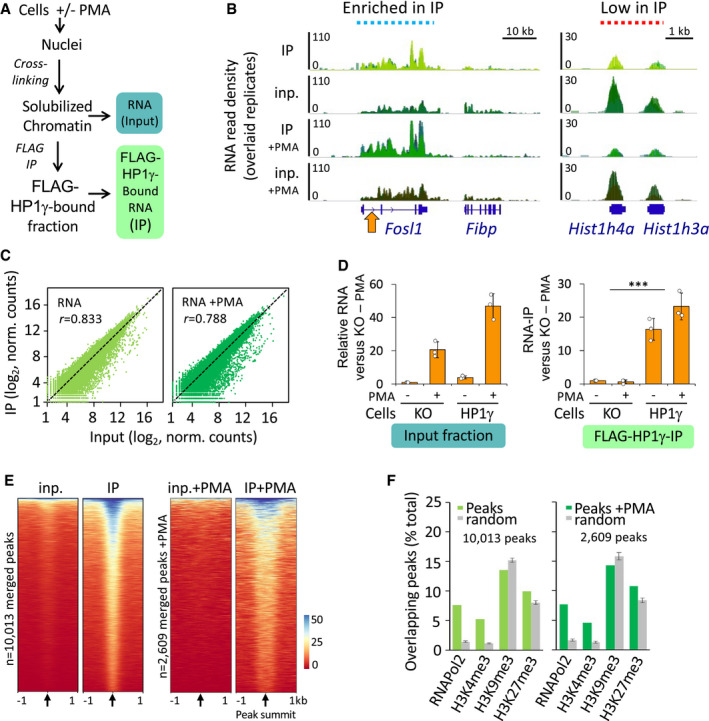
- Scheme of the strategy used to assay HP1γ association with RNA on chromatin.
- Genome views of RNA read density profiles on representative loci enriched (left) or low (right) in FLAG‐HP1γ RNAchIP (IP) relative to input RNA (inp.) in overlaid replicate samples from HP1γ cells stimulated or not with PMA. Orange arrow, position of the locus analysed in D.
- Genome‐wide scatter plot of IP and input normalized (norm.) RNA read counts per gene for the mean of the triplicates; n = 21,754; r, Pearson's correlation coefficient between IP and input.
- Relative quantities of RNA in the RNAchIP samples, detected by RT–qPCR with primers aligning on the intron1 of the Fosl1 gene as depicted in B (orange arrow). n = 3 independent experiments.
- Heat maps of RNA IP and input signal centred on the summit of RNAchIP peaks of IP versus input detected by MACS2 analysis (10,013 and 2,609 peaks) for a representative replicate (replicate 1). Black arrows represent peak summit.
- Percentage of RNAchIP peaks overlapping with indicated chromatin features in MEF samples from ENCODE database (green bars). Overlaps was evaluated by comparison with the list of merged peaks whose genomic location was randomized among genes with one hundred permutations (random, grey bars).
Data information: Histograms represent mean and SD Dots represent individual data points. P‐values indicate a significantly higher difference between IP in HP1γ and in KO cells (***P < 0.001; two‐tailed Student’s t‐test).
Source data are available online for this figure.
Figure EV1. Western blot analysis and RNA profiles in RNAchIP input and IP fractions.
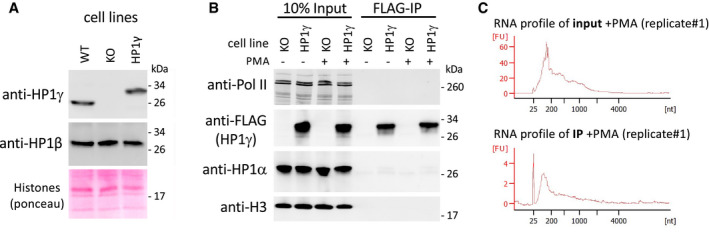
- Top panels, western blot analysis of HP1γ and HP1β protein levels in MEF‐derived cells expressing or not FLAG‐tagged HP1γ (HP1γ or KO, respectively), compared to WT MEF‐derived cells. Bottom panel, total protein staining by Ponceau S. Panel is a section of the blot centred on 17 kD, showing Histones.
- Detection of RNA polymerase II (Pol II), FLAG‐tagged HP1γ, HP1α and Histone H3 (H3) in the RNAchIP fractions depicted in Fig 1 by Western blot analysis in the HP1γ‐expressing cells (HP1γ), compared to KO cells (KO).
- Virtual gel profiles showing the size range of RNA fragments in both input and IP representative samples from HP1γ cells, obtained by Bioanalyzer (Agilent).
Source data are available online for this figure.
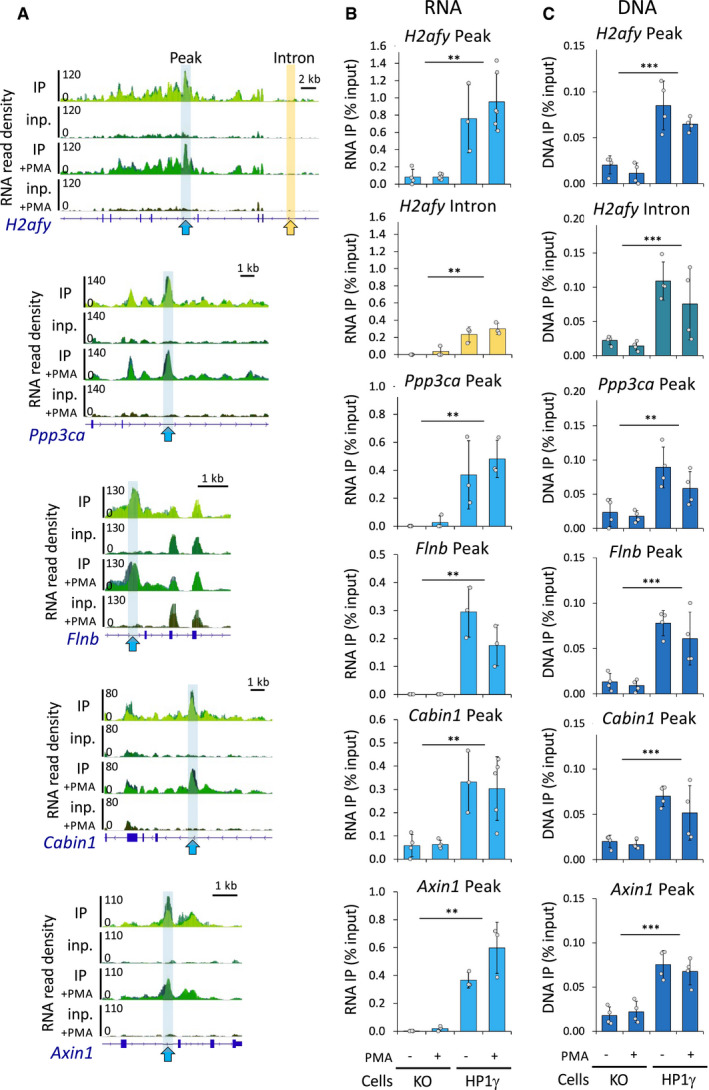
Figure EV2. HP1γ associates with RNA and DNA at different genomic loci.
-
AGenome views of RNA read density in overlaid replicates as in (Fig 1B) on representative gene loci bearing a peak (blue arrows) identified by MACS2, together with a neighbouring intronic region (yellow arrow).
-
B, CRelative quantities of RNA (B) and DNA (C) in the RNAchIP samples versus input in both HP1γ and KO cell lines, detected by RT–qPCR (B) and by PCR (C), at the peak (blue) and in the intron (yellow) regions delineated in (A). n = 3–5 independent experiments.
Data information: Histograms represent mean and SD; dots represent individual data points; P‐values indicate significantly higher difference between IP in HP1γ and in KO cells (**P < 0.005, ***P < 0.001; two‐tailed Student’s t‐test).
Within individual genes, the distribution of HP1γ‐associated RNA fluctuated along the gene body (Fig 1B). To detect regions of local enrichment, we searched for peaks appearing in IP but not in the input RNA. By merging peaks conserved in at least two of the three replicates, we identified 10,013 and 2,603 peaks, in unstimulated and in PMA‐stimulated samples, respectively (Fig 1E and examples Fig EV2; blue highlights). Several peaks were validated by RT–qPCR (Fig EV2A; arrows and Fig EV2B). Importantly, DNA regions encompassing these peaks were likewise enriched in the HP1γ immunoprecipitations, sustaining a model where HP1γ links RNA to chromatin (Fig EV2C). When exploring ChIP data from MEF cells available in the ENCODE database, we did not see a clear co‐distribution of the peaks of HP1γ‐bound RNA with H3K9me3 and H3K27me3 (Fig 1F). We note however that the very broad peaks yielded by these histone marks known to be recognized by HP1γ may have interfered with this analysis. In contrast, we observed a clear overlap of HP1γ peaks with sites enriched in RNA polymerase II and H3K4me3 histone marks, clearly linking RNA‐associated HP1γ with active transcription.
HP1γ‐associated RNA is enriched in CACACA and GAGAGA motifs
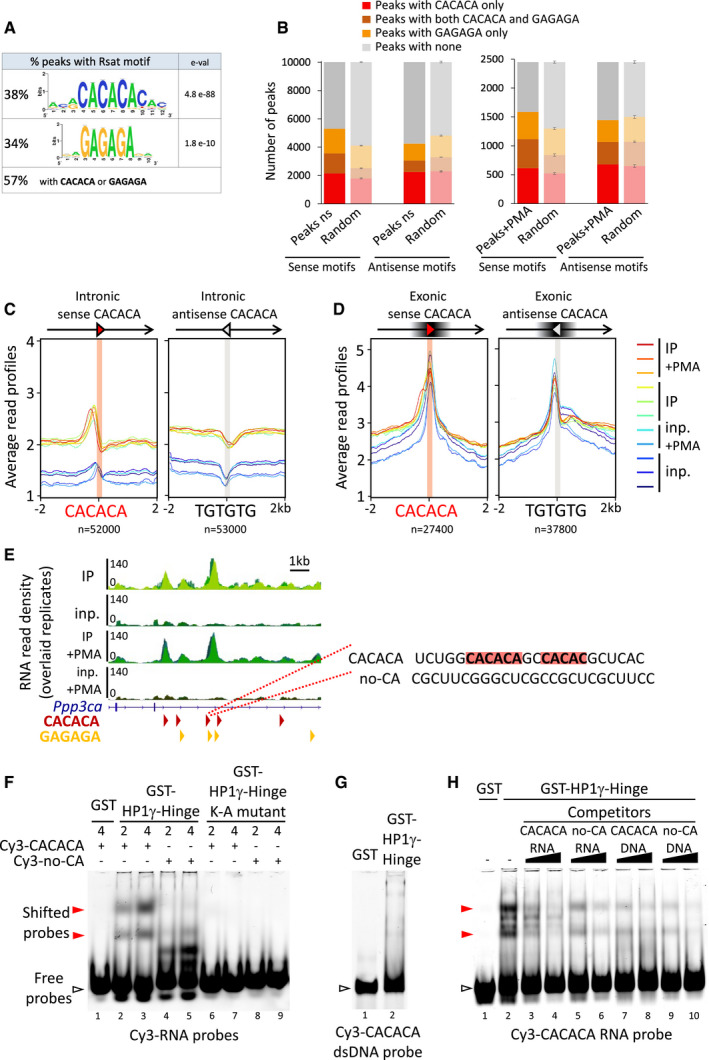
We next investigated whether sequence specific motifs could be found within the peaks. Peak‐motif analysis using RSAT on stranded sequences of all RNA peaks revealed a significant enrichment in CACACA motifs (e‐val. 4.8 e‐88) and to a lesser extend in GAGAGA motifs (e‐val. 1.8 e‐10) (Fig 2A and 2B and Appendix Fig S1). These motifs were oriented, as we observed no enrichment in the complementary (antisense) motifs (Fig 2B). Consistent with an enrichment in CACACA sequences in the RNA co‐immunoprecipitating with HP1γ, we observed an accumulation of reads around all intronic CACACA or GAGAGA motifs at expressed genes, visualized by an increased average distribution of the reads from IP compared to input RNA around these motifs (Fig 2C, and Fig EV3B), and the clustering of reads at a large number of intragenic loci centred on CACACA motifs (Fig EV3A). Noticeably, we did not find any enrichment within exons (Fig 2D) or in the TGTGTG motif, antisense to the CACACA motif (Fig 2C). The same patterns were observed with the GAGAGA motif (Fig EV3B). Enrichment within introns only is consistent with an average of 3 motifs per intron but only 0.1–0.2 motif per exon (Appendix Table S1), indicating that exons are in average devoid of such motifs.
Figure 2. HP1γ‐associated RNA is enriched in CACACA and GAGAGA motifs.
-
AConsensus motifs discovered among RNAchIP peaks with the RSAT pipeline, together with the percentage of peaks containing at least one exact hexameric CACACA or GAGAGA motifs or both. e‐val. represents the expected number of patterns which would be returned at random for a given probability.
-
BRNAchIP peaks are enriched in CACACA and GAGAGA motifs. Number of peaks containing at least one exact hexameric motif as indicated, compared to the average number of motifs in peaks whose genomic location was randomized among genes with ten permutations (random, light bars, represent mean and SD).
-
C, DDistribution profiles of average RNAchIP signal in both IP (warm colours) and input (blue colours) over ± 2 kb centred on intronic (C) and exonic (D) CACACA hexameric motifs oriented in the same orientation (sense) or in opposite orientation (antisense) relative to the overlapping annotated transcript. The antisense CACACA motifs were obtained by querying the transcript sequences with the TGTGTG motif.
-
ELeft, representative example of a locus on the Ppp3ca gene surrounding an RNAchIP merged peak, showing the RNAchIP read density as in Fig 1B. Red and orange arrowheads correspond to oriented CACACA and GAGAGA motifs, respectively. Right, sequence of the RNA surrounding a CACACA motif highlighted in red, as well as a neighbouring imperfect motif. The sequence was used to design a CACACA‐containing RNA oligonucleotide probe (CACACA), compared to a control probe (no‐CA) devoid of any related motif.
-
F–HGel mobility shift assays of bacterially expressed, purified HP1γ‐Hinge domain, fused to GST proteins and tested for its direct interaction with the Cy3‐labelled RNA (F and H) or dsDNA (G) oligonucleotide probes depicted in (C). The probes in the gels, either free (white arrowheads) or as shifted protein/RNA complexes (red arrowheads) were detected by their Cy3 fluorescence. Representative of three independent experiments.
Source data are available online for this figure.
Figure EV3. CACACA and GAGAGA motifs in RNAchIP peaks and by Gel shift assays.
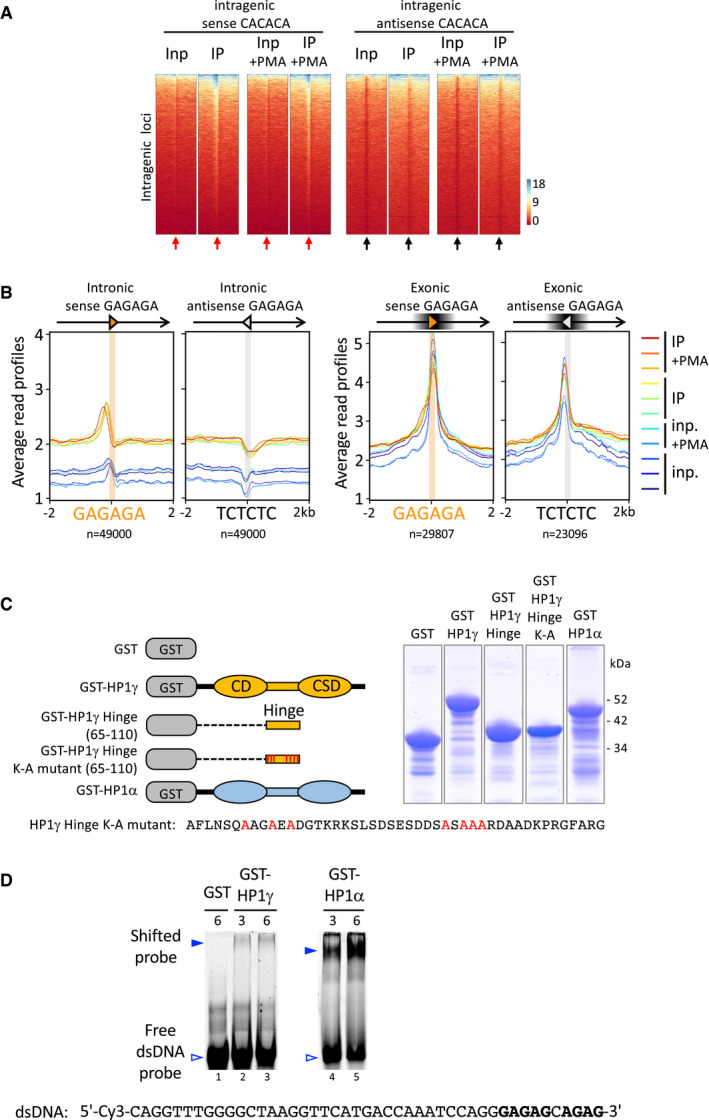
- Heat maps of IP and input signal in replicate sample 1 for each condition over ± 2 kb centred (arrows) on intragenic sense or antisense CACACA hexameric motifs (red or black arrows, respectively), corresponding to the average profiles depicted in Fig 2B.
- Distribution profiles of average RNAchIP signal in both IP (warm colours) and input (blue colours) over ± 2 kb centred on intronic (left) and exonic (right) GAGAGA hexameric motifs oriented in the same orientation (sense) or in opposite orientation (antisense) relative to the overlapping annotated transcript. The antisense GAGAGA motifs were obtained by querying the transcript sequences with the TCTCTC motif.
- Left, schematic representation of the GST‐HP1γ constructions used in gel mobility shift assay, depicting the chromo‐ and chromoshadow‐globular domains, as well as the unstructured Hinge domain (CD, CSD, Hinge, respectively). Right, Coomassie blue staining of the bacterially expressed, purified GST‐HP1 fusion proteins used in Figs 2D, EV2C and 3H.
- Gel mobility shift assay performed in the same conditions as in Fig 2, on the indicated dsDNA oligonucleotide probe. The probes in the gels, either free (white arrowheads) or as shifted protein/DNA complexes (blue arrowheads) were detected by their Cy3 fluorescence.
To test whether these motifs contribute to the association between HP1γ and RNA, we identified a representative RNA peak within the Ppp3ca gene which overlaps both CACACA and GAGAGA motifs (Fig 2E) and then used the sequence overlapping one of these motifs in vitro as an RNA probe in gel mobility shift assays. This probe was compared to a control RNA devoid of any CA motif ("no‐CA"; Fig 2E and F).
We conducted our experiments with bacterially expressed purified GST‐HP1γ Hinge region (covering amino acids 65–110; Fig EV3C), a domain of HP1γ earlier shown to have more DNA‐ and RNA‐binding activity in vitro than the full‐length proteins (Maison et al, 2002; Muchardt et al, 2002) and compare Figs EV3D and 2F). This purified GST‐HP1γ Hinge domain (Fig EV3C) readily bound the CACACA‐containing RNA probe (red arrowhead Fig 2F, lanes 2 and 3) while showing essentially no binding to a dsDNA oligonucleotide with the same sequence (Fig 2G) or for the "no‐CA" control RNA probe (Fig 2F, lanes 4 and 5, compared to lanes 2 and 3). Consistent with this, in competition assays, the GST‐HP1γ‐Hinge binding to the CACACA‐containing RNA probe was competed away by an excess of unlabelled CACACA‐containing RNA (Fig 2H, lanes 3 and 4), but not by the DNA‐ or the “no‐CA” RNA probes (Fig 2H, lanes 5–10). Mutation of positively charged basic lysine residues in the Hinge domain, previously shown to be involved in RNA binding in Swi6 (Keller et al, 2012) led to a complete loss of RNA binding in GST‐HP1γ‐Hinge (Fig 2F, lanes 6–9). HP1γ has therefore the capacity of directly interacting with RNA in a sequence specific manner, suggesting that the RNA enrichment seen in IP is, at least in some instances, due to direct HP1γ/RNA associations at specific positions enriched in CACACA motifs.
HP1γ‐associated RNA is enriched in SINE repeat motifs
Heterochromatin‐based silencing mechanisms may occur within active chromatin on repeated sequences such as interspersed repeats (SINEs, LINEs) or endogenous retroviruses (LTRs) (Leung & Lorincz, 2012; Bulut‐Karslioglu et al, 2014). We therefore asked whether HP1γ‐associated RNA could be enriched over different classes of repeated elements annotated in the RepeatMasker database. When aligned onto repeats with our multimapping alignment procedure, sequencing reads showed best enrichment on LTR and SINE repeats (Fig 3A).
Figure 3. HP1γ‐associated RNA is enriched in oriented SINE repeat motifs.
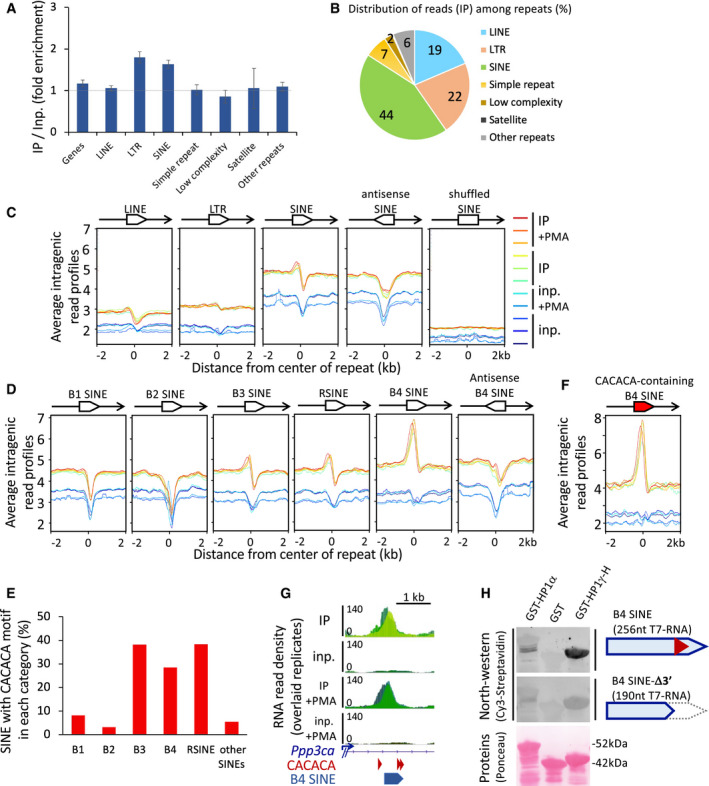
- Fold enrichment values on all repeat masker classes and on Refseq genes, on the basis of all uniquely aligned reads, shown as mean and SD, n = 6 biological replicates. Dashed line represents an IP/Input ratio of 1, taken as a reference.
- Pie chart of the distribution of RNA sequencing reads in IP per repeat masker classes counted as in (A), as a percentage of all repeats.
- Profiles of average RNAchIP signal as in Fig 2B over ± 2 kb centred on intragenic LINE, LTR or SINE repeats annotated in the Repeat masker database (n = 34,000). All repeats are in the same orientation (sense) relative to the overlapping annotated transcript, unless otherwise specified (antisense, shuffled), and as depicted by an oriented white box overlapping the transcript in 5′–3′ orientation (black line with arrowhead).
- Profiles of average RNAchIP signal, as in (C) centred on the 5 major families of intragenic SINE repeats.
- Proportions of the families of CACACA‐containing SINE repeats within each family, as a percentage of total intragenic sense SINEs.
- Profiles of average RNAchIP signal, as in (D) centred on the subset of intragenic B4 SINEs containing a consensus CACACA motif.
- Genomic position of a B4 SINE repeat and CACACA consensus motifs at the location of the RNAchIP peak depicted in Fig 2C.
- North‐western blot assay showing direct association between the indicated bacterially expressed, purified GST‐fusion proteins and in vitro transcribed, biotinylated RNA probes based on the sequence of the B4 SINE depicted in (G). Top panels, binding of a 256nt probe corresponding to the CACACA‐containing B4 SINE sequence, was compared to an identical B4 SINE deleted of its CACACA by truncation of its 3′ portion (B4 SINE‐Δ3′). RNA probes hybridized on the membranes were detected by their Cy3 fluorescence. Total GST‐fusion protein loading was visualized by Ponceau S staining. Representative of two independent experiments.
Source data are available online for this figure.
We then focused on SINEs, LINEs, and LTRs which are the most abundant repeats within gene bodies (Figs 3B and EV3A). Profile plots for IP read counts over these repeats confirmed that the best enrichments were to be found in the neighbourhood of SINEs (Fig 3C—note that the body of the various repeats are plotted as valleys because multimapping reads have been filtered away). Enrichment was most obvious on the B4 SINE family, and also more pronounced on the B3 and RSINE families, while undetected on the B1 and B2 SINEs (Fig 3D). Consistent with a preference of HP1γ for CACACA sequences, B3, B4 and RSINEs contain this hexamer motif in their sequence more frequently than other SINEs (Fig 3E). In addition, average profiles for IP read counts over CACACA‐containing B4 SINEs showed a better enrichment than that observed over B4 SINEs in general (Fig 3F, compare with Fig 3D B4 SINE panel). Noticeably, only SINEs in the same orientation as their host gene were found enriched (Fig 3C and D). Consistent with this, the reverse‐complement sequence of the B4 SINEs were not enriched in CACACA motifs (Fig EV4B).
Figure EV4. Proportions of intragenic repeats.
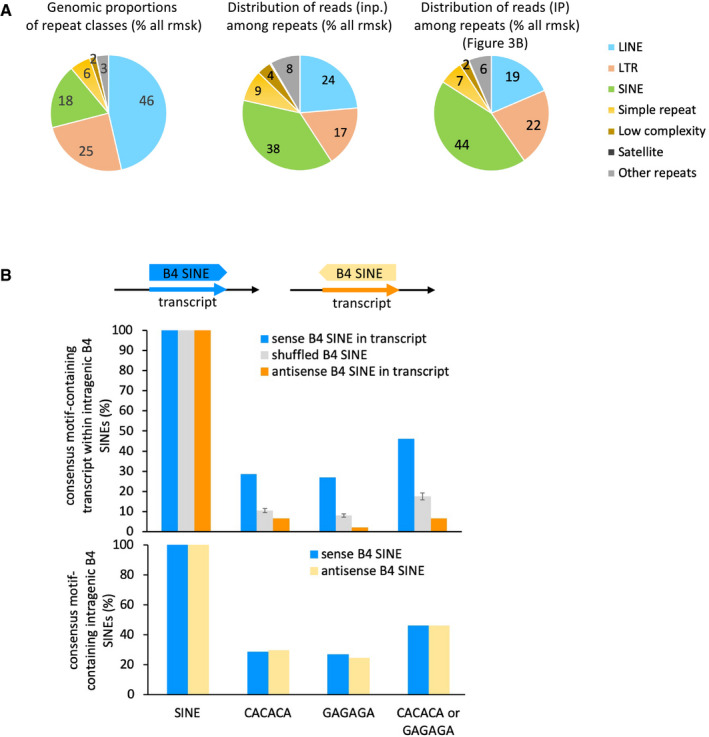
- Pie charts depicting the proportions of repeat classes of the Repeat Masker database, in terms of their cumulated genomic size (left chart), percentage of RNA sequencing reads from input (middle chart) and IP (right chart) counted per repeat classes as a percentage of all repeats, on the basis of all uniquely aligned reads.
- Intragenic B4 SINE repeats have a CACACA or GAGAGA motif density which is linked to their orientation in the gene, not with the proportions of CACACA in their intrinsic sequence. Top, schematic representation of the features. Middle, proportions of intragenic B4 SINE repeats which contain the depicted hexameric motifs when the sequence is read in the same orientation as the overlapping gene. Bottom, both sense and antisense B4 SINE repeats contain identical intrinsic motif density in their sequence. Graphs represent mean and SD for the three times randomized intervals.
Finally, we tested a SINE sequence for direct binding of HP1γ. As in Fig 2C, we selected a sequence corresponding to the IP peak present inside the Ppp3ca gene, which happens to contain a B4 SINE (Fig 3G). Because of the size of the probe (256 nt), a Northwestern assay was preferred. This assay confirmed that an RNA probe designed around the SINE sequence could establish direct contacts with HP1γ (Fig 3H). This association was dependent on the 3′ region of the probe which contains the CACACA motifs (Fig 3H). Altogether, our results are consistent with an association of HP1γ with SINE‐containing pre‐messenger transcript, not with individual SINE transcript, and suggest that the intragenic SINE repeats, concomitantly to the presence of a CACACA motif, constitute a targeting motif for the association of HP1γ with chromatin‐enriched transcripts.
The CACACA motif affects HP1γ association with introns of pre‐messenger transcripts on chromatin
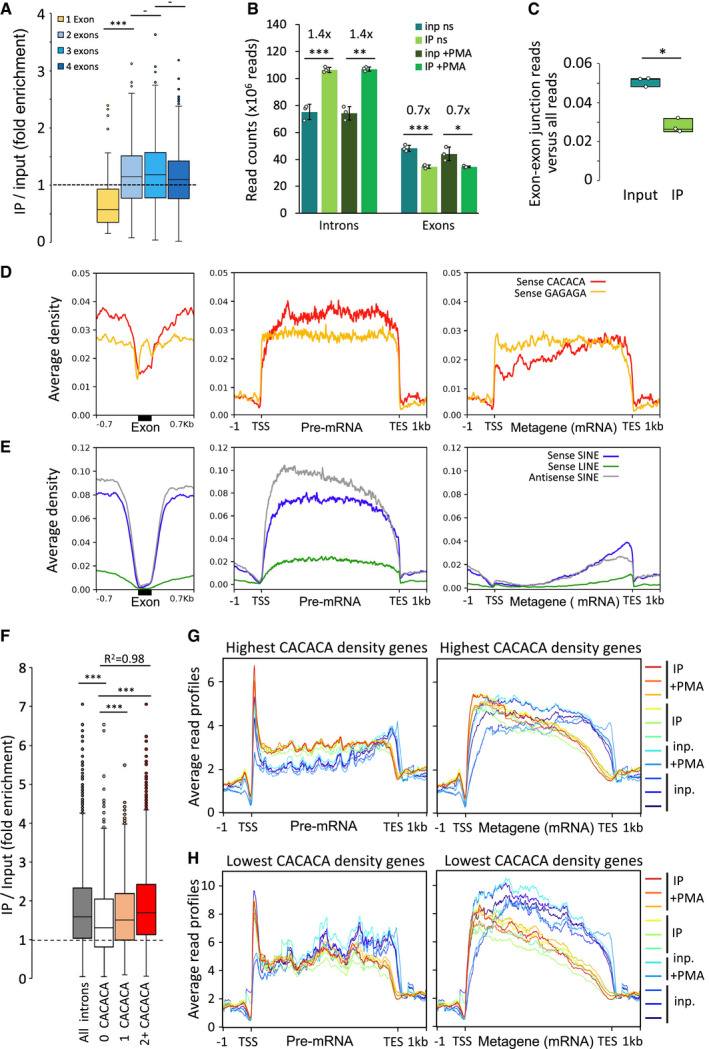
As mentioned above, transcripts from most histone genes were depleted from the IP fraction as compared to the input in the HP1γ RNAchIP (Hist1h4a and Hist1h3a, Fig 1B). Since most histone genes are intron‐less, we monitored IP RNA enrichment on genes sorted according to the number of exons they contained (Figs 4A and EV4A). Quantification of reads over transcripts of intron‐less genes appeared depleted in IP (Fig 4A, orange box plot, 1exon), while all intron‐containing genes were enriched in IP in a similar manner, independently of the number of exons (Fig 4A, blue box plots, 2, 3 and 4 exons). Further quantification of reads in IP showed a 1.4‐fold enrichment over introns and a depletion (0.7‐fold) over exons when compared to input (Fig 4B). Finally, we quantified in IP the reads aligning on junctions between two exons and therefore functioning as reporters of completed splicing reactions. The proportions of such exon–exon junction reads were significantly lower in IP relative to input (Fig 4C). Together, these observations indicated that HP1γ associated preferentially with intronic regions. Since most genes are spliced co‐transcriptionally, our results further suggest that HP1γ associates preferentially with pre‐mRNAs prior to maturation by splicing.
Figure 4. The density of CACACA motifs affects HP1γ association with introns of pre‐messenger RNA on chromatin.
-
ABox plot showing the distribution of fold enrichment values per genes sorted by exon number, n = 66, 247, 389, and 574 genes with 1, 2, 3 and 4 exons, respectively. Dashed line represents an IP/Input ratio of 1, taken as a reference.
-
BReads from input and IP counted in unstimulated and PMA stimulated triplicates give significant enrichment values of 1.4 and 0.7 on introns and exons, respectively, shown as mean and SD, n = 3 biological replicates. Dots represent individual data points.
-
CBox plot of reads belonging to spliced transcripts versus all reads in input or RNAchIP samples pooled between + and –PMA, calculated as a ratio between split reads and total reads, n = 3 biological replicates. Dots represent individual data points.
-
D, EAverage distribution profiles of the depicted hexameric motifs (D), or SINE and LINE repeats (E) on RefSeq genes, computed over exons (black box) and on ± 0.7 kb of surrounding introns (left panels), or over entire gene bodies including introns (pre‐mRNA; middle panels), or as metagenes over exons only (Metagene mRNA; right panels).
-
FBox plot as described in (A) showing the distribution of fold enrichment values on series of introns of comparable size (4kb in average, ranging from 3 to 5kb) sorted by number of sense CACACA motifs per intron (2+, two or more motifs), n = 5,782, 899, 960 and 3,234 introns for all introns, 0, 1 and 2+ CACACA categories, respectively. R2, Linear regression coefficient between 0, 1 and 2+. Dashed line represents an IP/Input ratio of 1, taken as a reference.
-
G, HAverage read profiles as in Fig 2C computed as in (D) and (E) on two groups of RefSeq genes, in the size range 4–15 kb, containing the highest (G) or lowest (H) CACACA motif density.
Data information: All box boundaries in Fig 4 represent 25th and 75th percentiles; centre line represents median; whiskers indicate ±1.5×IQR; points are values of outliers. All P‐values in Fig 4 are *P < 0.01, **P < 0.005, ***P < 0.001; two‐tailed Student’s t‐test.
Source data are available online for this figure.
To explore whether binding of HP1γ to introns could be explained by the sequence specificity of this protein, we profiled the distribution of the HP1γ‐targeting hexamer motifs within exons and in their surrounding introns (Fig 4D and E). This approach uncovered that the GAGAGA motif is excluded from the exon boundaries likely due to the strict sequence constraints linked to the definition of these boundaries. The profile of the CACACA motif was different and revealed a clear depletion of this motif from exons (red profile). Consistent with this motif being predominantly located in introns, pre‐mRNAs were found to contain higher density of CACACA motifs than their mature mRNA counterparts, devoid of introns (Fig 4D, compare red profiles in middle and right panels). An even stronger intronic enrichment was seen when considering intragenic SINE repeats (Fig 4E, left, blue and grey profiles). Indeed, unlike LINEs (green profile), SINEs were essentially absent from exons, but present inside introns throughout the gene body (compare metagene versus meta‐cDNA profiles, Fig 4E).
To probe for a correlation between the CACACA content of introns and their association with HP1γ, we selected introns of comparable size (4kb in average, ranging from 3 to 5kb) and sorted them according to their CACACA content. This approach revealed a significant increase in IP over input ratio when the number of CACACA motifs increased within introns (compare categories of introns containing no motif versus 1, and 2 or more motifs, Fig 4F). To address the impact of the CACACA motif at the scale of entire genes, we sorted genes into two categories according to their global CACACA density (1,700 genes above 0.5 hexamers/kb and 900 genes below 0.3 hexamers/kb, Fig 4G and H, respectively. Genes were 9 kb in average, ranging from 4 to 15 kb). These two categories clearly showed opposite profiles of average read density in IP. The genes containing the highest CACACA density were enriched in IP while the genes having the lowest density were depleted, affecting both pre‐messenger RNAs (compare relative position of red IP profiles and blue input profiles in Fig 4G and H, left panels), and mature mRNAs on chromatin (compare Fig 4G and H, right panels). These profiles highlight a positive correlation between the density in CACACA motifs and the enrichment in IP over whole genes and suggest that this global enrichment results from the multiplicity of discrete HP1γ binding motifs. For both categories of genes, the relative position of the average IP and input profiles were also shifted when considering metagenes rather than pre‐mRNAs profiles (compare left and right panels Fig 4G and H). This clearly suggested that mature transcripts were released from HP1γ, and it was consistent with the preferential association of HP1γ with introns that we described above. Interestingly, the genes with the highest CACACA motif density showed globally a lower average read density than the lowest CACACA category (compare Fig 4G and H). From this inverse correlation, we hypothesized that HP1γ may have a positive impact on the maturation of these transcripts and their release from chromatin in accordance with previous studies (Smallwood et al, 2012).
HP1γ has an impact on the fidelity of RNA splicing which is correlated with intronic RNA binding
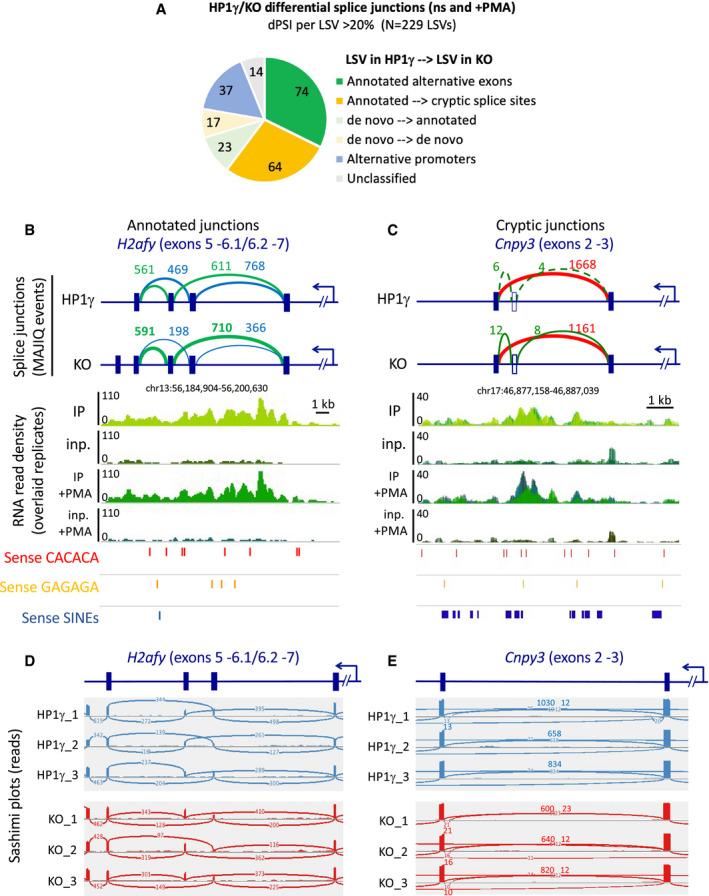
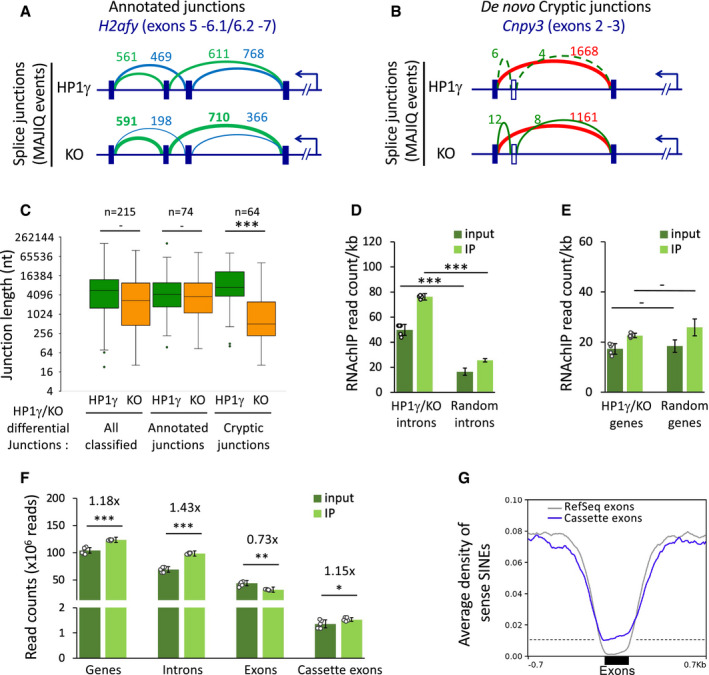
We have previously demonstrated a role for HP1γ in the regulation of alternative splicing (Saint‐Andre et al, 2011). To investigate a possible link between the binding of HP1γ at intronic repeats and its impact on splicing, we performed a transcriptome analysis on the HP1γ‐expressing (HP1γ) and HP1γ‐null (KO) cells lines (Appendix Fig S2). The differences in splicing decisions between the two cell lines were quantified with the MAJIQ algorithm (Vaquero‐Garcia et al, 2016). As anticipated from earlier studies, this approach led us to identify a number of splice junctions affected by the presence of HP1γ (178 high confidence differential splicing events in total, Pie chart in Fig EV5A, and list of events in Appendix Table S2). Most of these corresponded to alternative exons (74 events, see example Figs 5A and EV5B and D). However, we noted that in approximately one third of these differential splicing events (64 events, Fig EV5A), the loss of HP1γ was correlated with increased usage of cryptic splice sites involving intronic sequences, and often detected with a small number of reads (see example Figs 5B and EV5C and E), thereby affecting a subset of transcripts. This observation suggested a role for HP1γ in promoting usage of genuine splice sites over cryptic intronic ones, likely by decreasing the stochasticity of splicing events. To further document this, we evaluated the average length of excised introns in the two cell lines. While genuine junctions were unaffected, junctions to cryptic splice sites were significantly shorter in the absence of HP1γ (P = 2 × 10⁻⁷), strongly suggesting that additional cryptic splice sites become available to the spliceosome when this protein is missing (Fig 5C).
Figure EV5. Differential splicing events in HP1γ and KO transcriptomes.
-
ANumber of high confidence differential splice junctions detected by MAJIQ as Local Splice Variations (LSV) with d(PSI)>= 0.2 between HP1γ and KO. “Unclassified” are Junctions in rRNAs, satellite repeats or undefined junction changes (not matching any gene).
-
B, CSchemes showing the splicing event depicted in Fig 5A and B (top), together with RNAchIP read density profiles (middle) and position of the indicated oriented repeated motifs (bottom).
-
D, ESashimi plots showing the reads corresponding to the splicing events depicted in Fig EV5B and C.
Figure 5. Intronic RNA binding by HP1γ has an impact on RNA splicing.
-
A, BHP1γ‐dependent differential splicing junctions detected by MAJIQ between transcriptomes of HP1γ and KO cells. Top, Schemes of splice junctions showing annotated alternative splicing events (blue and green, panel A), or an annotated exon‐exon junction and de novo cryptic junctions increased in KO (red and green, respectively, panel B).
-
CBox plot depicting the length of exon junctions found differentially regulated by MAJIQ between HP1γ (green) and KO (orange) in three categories as in Fig EV5A, all classified differential HP1γ/KO junctions, annotated alternative exon junctions, non‐annotated de novo cryptic junctions detected in KO only; n, differential events. Box boundaries represent 25th and 75th percentiles; centre line represents median; whiskers indicate ± 1.5 × IQR; points are values of outliers.
-
DRNAchIP read density per kb on the indicated introns for input and IP in samples from both untreated and PMA stimulated cells, n = 6 biological replicates, or 3‐times randomized intervals, n = 18 samples. Dots represent individual data points. HP1γ/KO introns are all 272 intronic intervals between exon junctions differentially detected in HP1γ and KO. “Random introns” are a matching library of random intronic intervals.
-
ERNAchIP read density per kb on the genes corresponding to the introns tested in (D) and analysed as in (D), n = 6 biological replicates, or 3‐times randomized intervals, n = 18 samples.
-
FReads from input and IP counted on the indicated features in combined unstimulated and PMA stimulated triplicate samples, n = 6 biological replicates. Dots represent individual data points.
-
GAverage distribution profiles of sense SINE repeats on indicated exons and on ±0.7kb of surrounding introns.
Data information: All graphes represent mean and SD (**P < 0.005, ***P < 0.001; two‐tailed (C, D, E) or one‐tailed (F) Student’s t‐test).
Source data are available online for this figure.
We next probed the HP1γ RNAchIP for evidence of increased HP1γ RNA binding at differential splicing sites. Counting RNAchIP reads on the introns surrounding the differential splice sites revealed significantly higher levels of RNA in both input and IP samples (P = 5 × 10⁻⁶ and 6 × 10⁻¹⁰, respectively), relative to a matching list of introns chosen randomly (Figs 5D and EV5B and C). This increase in read density was not observed when considering the host genes in their entirety (Fig 5E). Together, these observations are indicative of HP1γ‐RNA association having a local effect on splicing events.
Finally, as HP1γ also affects splicing of alternative exons (Fig 5A and Saint‐Andre et al, 2011), we examined RNAchIP read accumulation at exons annotated as “cassette exons” (i.e. exons being skipped/included between two other exons) in the UCSC Alt Events database. Accumulation of reads at cassette exons was then compared to that observed either at introns or exons as defined in the RefSeq database. Consistent with HP1γ binding pre‐mRNA, intronic reads were enriched in the IP fraction when compare to the input, while exonic reads were depleted (Fig 5F). Interestingly, when restricting the analysis to cassette exons, we observed a moderate enrichment similar to the one seen on introns. Thus, when considering RNAchIP density profiles, cassette exons are intermediary between exons and introns. Next, to search for elements that could discriminate alternative exons from constant exons, we compared the densities of HP1γ binding motifs on cassette exons and RefSeq exons. We found that, while SINE repeats are excluded from RefSeq exons, as shown previously (Fig 4E), cassette exons have a propensity to contain SINEs in their sequence (Fig 5G). This suggests that cassette exon RNA is more prone to HP1γ binding than the average exonic RNA, a phenomenon that may contribute to the alternative usage of cassette exons.
Mutation of CACACA motifs impairs HP1γ functionality in a splicing reporter assay
To document a direct link between the binding of HP1γ to RNA and its impact on splicing, we finally tested minigene reporter constructs containing or not a tandem of (CA)n motifs located inside an alternative exon of the rat Prl gene. This alternative exon was framed by two exons from the human beta globin gene (Fig 6A). The resulting reporter referred to as Prl3 wt was originally constructed to assay the splicing activity of hnRNP‐L, that like HP1γ has affinity for CA‐rich motifs (Lei et al, 2018). We also designed a version of this reporter, referred to as Prl3 CAmut, with point mutations within the sequence of these (CA)n motifs (Fig 6A).
Figure 6. Mutation of CACACA motifs impairs the impact of HP1γ on the splicing of a reporter minigene.
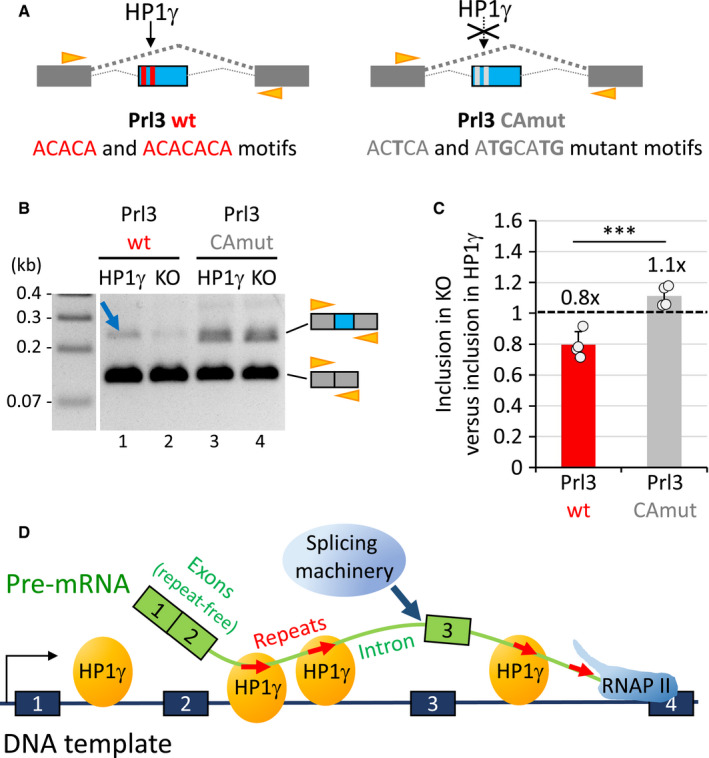
- Scheme of the minigene constructs containing the Prl exon and surrounding introns (blue) between human beta globin exons (dark grey), and containing CACACA motifs (red boxes; Prl3 wt) or mutant versions (light grey boxes; Prl3 CAmut). Orange arrowheads, position of the primers used in the assay performed in B.
- RT–PCR analysis of the RNAs produced in the splicing assay with the Prl3 wt or Prl3 CAmut constructs as depicted in A transfected into HP1γ or KO cell lines. The top 210bp and bottom 120bp amplicons correspond to the included form (beta globin with Prl exon, more included in lane1, blue arrow, compared to lane 2),and the skipped form (beta globin exons only) of RNA, respectively. Orange arrowheads, position of the HBGEX‐F and HBGEX‐R primers used in PCR analysis.
- Histogram showing the loss of inclusion of the Prl3 exon upon depletion of HP1γ (in KO) relative to inclusion in the presence of HP1γ with the Prl3 wt (red) or Prl3 CA mut (grey) reporters. Based on the quantitation of 4 experiments as the one depicted in B. Values represent the fold change relative to HP1γ as a reference (dashed line). Graph represents mean and SD (***P < 0.001; two‐tailed Student’s t‐test; n = 4).
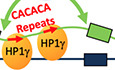
- Model of HP1γ‐dependent impact on splicing events via its binding to repeated intronic hexameric motifs (red arrows).
Source data are available online for this figure.
The constructs were transfected into either HP1γ and KO cells and the splicing products were analysed by RT–PCR. For the wt construct, inclusion of the Prl exon was highly dependent on the presence of HP1γ (Fig 6B, lanes 1 and 2). In contrast, the mutant construct yielded more abundant and more complex alternative splicing products in an HP1γ‐independent manner (Fig 6B, lanes 3 and 4). Quantification of four independent experiments established that inclusion of the wt Prl exon was reduced 1.25‐fold in the absence of HP1γ (Fig 6C, Prl3 wt), while inclusion of the mutant version of this alternative exon having lost the HP1γ‐binding motifs was essentially independent of this protein (Fig 6C, Prl3 CAmut). The consistently higher inclusion of the Prl3 CAmut exon compared to the wt exon (lanes 3,4 versus 1,2) also suggested that HP1γ may compete with the repressive hnRNP‐L splicing factor for binding partly overlapping regulatory motifs. Together, these observations reveal that the function of HP1γ as a modulator of splicing on the Prl exon is lost in the absence of (CA)n motifs.
Collectively, our data suggest that CACACA motifs and the associated SINE repeats drive the targeting of HP1γ onto newly transcribed RNA, allowing HP1γ to participate in the accurate selection of genuine splice sites by the splicing machinery on chromatin (Fig 6D).
Discussion
Elimination of intronic sequences from the pre‐mRNA requires identification of the boundaries of exons with a resolution of one base. The initial recognition of a 5′ splice site (5′SS) relies on its base pairing with the U1 snRNP that then triggers the recruitment of the spliceosome. However, the consensus sequence recognized by the U1 snRNP is short and accepts many variants. Therefore, the mechanisms allowing U1 to distinguish between bona fide 5′SS and the many pseudo‐5′SS present in the neighbouring introns require the contribution of splicing co‐regulators (Wahl et al, 2009). Here, we uncovered that HP1γ associates with repeated sequences present only in intronic RNA and that inactivation of the HP1γ/Cbx3 gene results in increased usage of cryptic splice sites. These observations strongly suggest that HP1γ, by associating with intron‐specific RNA sequences and tethering them to chromatin, participates in the positive selection of genuine splice sites. Interestingly, similar mechanism may apply at cassette exons that are intermediates between introns and exons in terms of content in sequences recognized by HP1γ.
Our strategy to identify chromatin‐enriched RNA associated with HP1γ relied on a modification of our native chromatin immunoprecipitation assay. This approach revealed that the association of HP1γ with pre‐messenger RNA on chromatin is based on its capacity to be targeted to RNA molecules bearing preferentially a consensus CACACA or GAGAGA motif. The PMA treatment initially included in this study for its impact on HP1γ‐mediated splicing did not seem to affect the sequence specificity of the protein. In contrast, PMA stimulation modified the number and width of peaks of HP1γ‐associated RNA, suggesting that it affects the mobility and hence the on/off rate of the HP1γ binding to its RNA targets.
The Hinge domain which contributes to RNA binding in HP1 proteins is not annotated in any of the common families of RNA‐binding domains. This Hinge region is an essentially unstructured peptidic segment between the two globular domains in HP1 and contains many positively charged basic residues, Lysines and Arginines, which create an electrostatic interface (Hiragami‐Hamada et al, 2016). Considering the recent concept that heterochromatin‐mediated gene silencing may occur in part through liquid–liquid phase separation involving association of HP1α with DNA (Larson et al, 2017; Strom et al, 2017), these physicochemical properties may be at play in the process of HP1γ association with RNA via its unstructured domain, creating local foci of chromatin condensation.
The two RNA consensus motifs we identified greatly enhanced the direct binding of purified HP1γ to RNA in vitro. However, an exact match with the consensus motifs was present in no more than half of the RNAchIP peaks. A possible reason for this discrepancy is that a subset of peaks contains motifs moderately divergent from the consensus. This suggests that HP1γ still recognizes an imperfect consensus, such as CACAC, the second motif present in the RNA probe used in our gel mobility shift assay. Interestingly, the CACACA motif is one of the motifs recognized by hnRNP‐L, an abundant nuclear protein that more generally binds intronic CA repeats and CA‐rich elements to regulate alternative splicing in mammals (Hui et al, 2005; Rossbach et al, 2014). We note however that genome‐wide RNA‐binding sites of hnRNP‐L differ from those of HP1γ‐bound RNA with a preference of hnRNP‐L for 3′UTRs (Rossbach et al, 2014), that we did not see for HP1γ. HP1γ and hnRNP‐L may nevertheless be competing for putative common sites in the context of splicing regulation as we could observe on the rat Prl3 cryptic exon in our splicing reporter experiment. The splicing factor 9G8 is also a potential competitor of HP1γ as it associates with the GAGAGA consensus motif (Cavaloc et al, 1999). Possibly, by recognizing multiple RNA motifs, HP1γ may act by interfering or cooperating with multiple positive and negative regulatory splicing factors, via their own RNA targeting motif within chromatin. Alternatively, a subset of HP1γ / RNA peaks may be linked to an indirect recruitment of HP1 as part of a complex with specific DNA‐binding transcription factors such as ADNP in the context of the ChAHP complex (Ostapcuk et al, 2018). ADNP in ES cells was shown to bind to a subset of B2 SINE elements bearing a consensus GAAGAGGG DNA binding motif (Kaaij et al, 2019) reminiscent of our second RNA‐binding motif, GAGAGA. Beyond the notion of direct or indirect HP1γ association with RNA, these data, taken together with our own results delineate targeting determinants in the recruitment and functionality of HP1γ and its associated factors.
In humans, the short interspersed Alu repeats, when transcribed in antisense orientation generate a consensus 5′SS and therefore have contributed to the emergence of novel exon–exon junctions (Elbarbary et al, 2016). The SINE repeats involved in our model were in the sense orientation and were, in many of our examples, located near but not at differentially regulated exon–exon junctions. This strongly suggested that they were not used as a source of 5′SS. Instead, SINEs may function as anchors maintaining pre‐messenger RNA on chromatin to facilitate the accurate co‐transcriptional splicing. More precisely the function carried by the SINE elements in our system appears to be rather driven by several categories of LINE repeats in humans when considering the proportions of repeat elements with CACACA motif(s) (Appendix Fig S3). But these differences in humans are still compatible with a role of the CACACA motif as a driver of HP1γ association with RNA. On the human CD44 gene where HP1γ contributes to regulation of alternative splicing while also tethering the pre‐mRNA to the CD44 locus (Saint‐Andre et al, 2011), a stretch of 18 CA motifs is located precisely in the same orientation as a small antisense RNA which is suspected to contribute to the regulation of alternative splicing in CD44 in relationship with AGO proteins linked to HP1γ (Appendix Fig S4; Ameyar‐Zazoua et al, 2012). As a complement to this, we observed that a large majority of novel splicing junction involving cryptic splice sites in the absence of HP1γ were consistently spanning over shorter intronic regions than did similar splicing events in the presence of HP1γ. This raises the possibility that HP1γ also impacts on binding of splicing regulators by maintaining the pre‐mRNA on chromatin. In this case, HP1γ may have an impact on decreasing the stochasticity of splicing events thereby allowing the timely recruitment of regulatory subunits of the spliceosome, including the U2 snRNP that we found associated with HP1γ (Allemand et al, 2016). This configuration would provide a kinetic advantage of the strong splice donors and acceptors over cryptic sites, hence reinforcing the accuracy of splicing decisions.
Altogether, our results add a new key element to the model of chromatin‐based regulation of pre‐mRNA splicing by suggesting that HP1γ proteins may compete or synergize with splicing regulatory factors such as SR proteins and hnRNPs. In parallel, B4 SINE repeats, because they are enriched in CACACA motifs appear to be coincidentally good markers of the genome‐wide distribution of HP1γ RNA‐binding sites. In that sense, our data reconcile the heterochromatic and euchromatic functions of HP1 protein that are shown here to use similar repeat‐binding properties both to silence interspersed repeats in intergenic region or inactive genes and to facilitate splicing of expressed genes. In fact, it seems that in the case of HP1γ, the function of heterochromatin‐based silencing of SINE repeat elements within gene bodies has shifted towards regulation of alternative splicing at the locations of SINE repeats. Because of the diversity of HP1γ target genes and chromatin configurations, a wide spectrum of functional effects is observed, even from the specific point of view of splicing. The functional consequences of the CACACA‐dependent targeting of HP1γ to RNA may have to be explored in specific cellular model systems for cell lineage specification.
Materials and Methods
Cell lines and tissue culture
Mouse embryonic fibroblast (MEF)‐derived cell lines were obtained exactly as previously described (Harouz et al, 2014). Briefly, HP1γ‐expressing or KO cells were obtained by stable re‐complementation of immortalized MEF HP1γ −/− cells by retroviral transduction using a retroviral vector carrying HP1γ cDNA, or an empty vector, respectively. Cells were grown in DMEM (Invitrogen) supplemented with 10% (v/v) foetal calf serum and 100 U.ml‐1 penicillin‐streptomycin. PMA‐treated samples were obtained by addition of 100nM of Phorbol 12‐Myristate 13‐Acetate (PMA) in DMSO for 30 min on nearly confluent cells. HP1γ and KO Cell lines are available upon request to the corresponding authors.
Antibodies
Anti‐HP1alpha (Euromedex, 2HP2G9AS), anti‐HP1beta (Euromedex, 1MOD1A9AS), anti‐HP1gamma (Euromedex, 2MOD1G6AS), anti‐FLAG (Sigma, F7425), anti‐H3 (Abcam ab1791) and anti‐RNA Pol II (Santa Cruz, sc‐899) were used for immunoblotting experiments following the manufacturer’s recommendations.
Direct in vitro protein‐RNA‐binding assay ‐ Gel mobility shift assay
Assay was performed with bacterially expressed, purified GST fusion proteins, as depicted in Fig EV3C, prepared as previously described (Mateescu et al, 2008). Between 0.2 and 0.8 nmoles of GST‐fusion proteins were incubated with 1 pM of Cy3‐labelled RNA oligonucleotide probes on ice for 20 min at 4°C in EMSA buffer (10 mM Tris–HCl (pH 8.0), 50 mM NaCl, 10% glycerol (w/v), 0.01% NP40, 0.1 mg/ml BSA). The reaction was resolved by gel electrophoresis at 150 V for 20 min at +4°C, on a 5% native polyacrylamide gel (37.5:1) in 0.5× TBE buffer (45 mM Tris‐borate, 1 mM EDTA). The gel was then immediately scanned on a Typhoon FLA 9000 (GE Healthcare) and subsequently stained with Coomassie blue R‐250 (Sigma).
Direct in vitro protein‐RNA‐binding assay ‐ North‐western blot binding assay
Assay was performed essentially as described previously (Muchardt et al, 2002). Briefly, bacterially expressed, purified GST‐fusion proteins as above were separated by SDS–PAGE, transferred onto a nitrocellulose membrane (Bio‐Rad), renatured in PBS containing 5% of bovine serum albumin and then hybridized for 1h at room temperature with biotinylated RNA probes that had been in vitro transcribed in the presence of biotin‐16‐UTP (Sigma) with T7 RNA polymerase (NEB) following the manufacturer’s instructions. After two washes and hybridization of Cy3‐streptavidin (BioLegend, Inc.), membranes were scanned on a Typhoon FLA 9000 (GE Healthcare) and subsequently stained with Ponceau S (Sigma).
Nuclei isolation and crosslinking
4x10⁷ cells treated or not with 100 nM PMA for 30 min were washed directly on their tissue culture plate twice with ice cold phosphate‐buffered saline (PBS). All subsequent steps were performed at 4°C, unless otherwise specified. Cell were allowed to swell on ice for 5 min in 5 ml of ice cold swelling buffer: (10 mMTris–HCl pH7.5, 2 mM MgCl2, 3 mM CaCl2, supplemented before use with: 1× antiprotease (Roche), 0.5 mM Na3VO4, 20 mM β‐Glycerophosphate, 80 U/ml RNAsin (Promega), 0.1 mM DTT). Cells were removed from the plate with a plastic cell scraper, transferred to a 15 ml conical and pelleted for 5 min at 4°C at 450 g. Cells were resuspended in 0.7 ml of swelling buffer supplemented with 10% glycerol and 0.5% Igepal CA630 (Sigma) and gently pipetted up and down 15 times using a p1000 tip. Nuclei were pelleted for 5 min at 4°C at 1,100 g and washed once in 1 ml swelling buffer supplemented with 10% glycerol. Nuclei were then fixed with 0.3% formaldehyde in 300 µl swelling buffer supplemented with 10% glycerol for 10 min at room temperature. Crosslinking was quenched during 10 min with 50 mM glycine. Nuclei were pelleted for 5 min at 4°C at 2,200 g and then washed once in 1ml swelling buffer.
Chromatin‐enriched RNA immunoprecipitation assay (RNAchIP)
Crosslinked nuclei were extracted in 0.8 ml modified RIPA lysis buffer (50 mM Tris–HCl pH7.5, 150 mM NaCl, 0.5% sodium deoxycholate, 0.2% SDS, 1% NP‐40, supplemented with 1× antiprotease (Roche), RNasin (Promega) and 0.5 mM DTT). Cell suspension was sonicated using a Diagenode Bioruptor for four times 20s cycles at High amplitude. 7 μl of Turbo DNase (Ambion, AM2238) and 7 μl MgCl2 1 M were added to sonicated material, incubated at 37°C for 10 min and spun down at 13,000 g for 10 min at 4°C. Ten per cent of solubilized chromatin lysate was kept as input. The remaining volume was mixed with 350 μl PBS and 200 μl anti‐FLAG magnetic beads suspension (Sigma, M8823) that were previously blocked in PBS containing 0.1% BSA, 0.5% Triton X‐100 and 0.1% polyvinylpyrrolidone‐40 (Sigma) and incubated at 4°C for 2 h on a rotating wheel. Beads were then washed once in low salt wash buffer (1× PBS, 0.1% SDS, 0.5% NP‐40), twice in high salt wash buffer (5× PBS, 0.1% SDS, 0.5% NP‐40), and once more in low salt wash buffer. Beads were then eluted twice 10 min in 250 μl elution buffer (150 ng/μl 3xFLAG peptide (Sigma) in low salt wash buffer supplemented with RNasin). Eluates were combined for a total of 500 μl. Eluates were then adjusted to 200 mM NaCl and 10 mM EDTA and incubated with 10 μg of Proteinase K at 50°C for 45 min and then placed at 65°C for 2 h to reverse crosslinking. Samples were then subjected to phenol:chloroform extraction under acidic conditions followed with ethanol precipitation with Glycoblue (Ambion) as a carrier. Nucleic acid Pellets were then washed once in 75% ethanol, air‐dried briefly and resuspended in 30 μl of RNase‐free water for DNase treatment 20 min at 37°C, followed by RT–qPCR or library preparation.
Reverse transcription and qPCR (RT–qPCR)
Reverse transcription was carried out with SuperScript III (Invitrogen) and random hexanucleotides for 1 h at 50°C on 1 μg RNA, quantified with a nanodrop (Thermo Scientific). Real‐time quantitative PCR (qPCR) was carried out on a Stratagene Mx3005p with Brilliant III SYBR Green kits (Stratagene) according to the manufacturer’s instructions. Primer sequences are listed in Appendix Table S2.
Total RNA preparation and sequencing for transcriptome analysis
Total RNA was prepared out of HP1γ and KO cells by guanidinium thiocyanate‐phenol‐chloroform extraction according to the method of Chomczynski and Sacchi (Chomczynski & Sacchi, 2006), followed by proteinase K and DNAse treatments as described above. Total RNA library preparation and sequencing were performed on DNase‐treated RNA samples by Novogene Co., Ltd, as a lncRNA sequencing service, including lncRNA stranded library preparation with rRNA depletion (Ribo‐Zero Magnetic Kit), quantitation, pooling and PE 150 sequencing (30G raw data‐100 M raw reads/sample) on Illumina HiSeq 2500 platform.
RNAchIP Library preparation
RNA quality and yield were assessed by the RNA integrity number (RIN) algorithm, using the 2100 Bioanalyzer. Directional libraries were prepared using the Smarter Stranded Total RNA‐Seq kit‐Pico Input Mammalian kit following the manufacturer’s instructions (Clontech, 635005). The quality of all libraries was verified with the DNA‐1000 kit (Agilent) on a 2100 Bioanalyzer and quantification was performed with Quant‐It assays on a Qubit 3.0 fluorometer (Invitrogen). Clusters were generated for the resulting libraries, with the Illumina HiSeq SR Cluster Kit v4 reagents. Sequencing was performed using the Illumina HiSeq 2500 system and HiSeq SBS kit v4 reagents. Runs were carried out over 65 cycles, including seven indexing cycles, to obtain 65‐bp single‐end reads. Sequencing data were then processed with the Illumina Pipeline software, Casava (v.1.9).
Bioinformatics analysis
Bioinformatics analysis of the RNAchIP‐seq was performed using the RNA‐seq pipeline from Sequana (Cokelaer et al, 2017). Reads were cleaned of adapter sequences and low‐quality sequences using cutadapt (v.1.11) (Martin, 2011). Only sequences at least 25 nt in length were considered for further analysis. STAR (v.2.5.0a) (Dobin et al, 2013) (parameters: ‐‐outFilterMultimapNmax 30 ‐‐outSAMmultNmax 1 ‐‐outMultimapperOrder Random) was used for alignment on the reference genome (Mus musculus mm9 from UCSC). Genes were counted using featureCounts (v.1.4.6‐p3) (Liao et al, 2014) from Subreads package (parameters: ‐t CDS ‐g ID ‐s 1). MACS2 (v.2.1.0) (Zhang et al, 2008) was used to call HP1‐binding peaks on RNA‐ChIP data (parameters: ‐‐nomodel –extsize = 150 ‐q 0.1). Bamcoverage from Deeptools (Ramirez et al, 2016) was used to produce normalized BigWig files to 1X. Finally, Bedtools (v.2.25.0) (Quinlan & Hall, 2010) closestBed (parameters: ‐D ref ‐mdb each) was used to annotate each peak from all conditions with related and public ChIP‐seq data from Gene Expression Omnibus database (H3k4me3, RNA pol II, H3K9me3, H3K27me3; GEO sample accessions: GSM769029, GSM918761, GSM2339533, GSM946547, respectively). All random controls were performed with Bedtools (v.2.25.0) Shuffle over intragenic intervals (parameter: ‐incl option to restrict randomizations to within gene bodies). Average profiles were obtained using plotProfile (parameter: ‐‐perGroup) and heat maps using plotHeatmap (default parameters) out of matrices generated by computeMatrix (parameters: ‐‐referencePoint centre, Figs 1, 2, 3, or scale‐regions, Figs 4 and 5), from Deeptools, on BigWig files of RNA‐ChIP reads or intragenic SINE, LINE or hexameric CACACA or GAGAGA motifs. SINE and LINE repeats were obtained from the RepeatMasker database at UCSC. CACACA or GAGAGA strict hexameric motifs were obtained with the scanMotifGenomeWide.pl tool from the Homer package (v. 4.9.1). Intragenic features were obtained with intersectBed from Bedtools, with strand orientation based on the Mus_musculus mm9 reference database (Ensembl release 67), and then converted into BigWig files for analysis via computeMatrix. All genome views were done using the Integrative Genomics Viewer software (IGV)(Robinson et al, 2011).
Statistical analysis
Each count dataset was analysed using R (v.3.4.1) and the Bioconductor package DESeq2 (v.1.16.0) (Love et al, 2014) to test for the differential gene expression (DGE). The normalization and dispersion estimation were performed with DESeq2 using the default parameters, and statistical tests for differential expression were performed applying the independent filtering algorithm. A generalized linear model was set in order to test for the differential expression between the biological conditions. For RNAchIP‐seq, triplicates IP samples were compared to input samples in each PMA‐treated and unstimulated samples. For RNA‐seq, triplicate HP1 samples were compared to KO samples in each PMA‐treated and unstimulated cells. For each pairwise comparison, raw P‐values were adjusted for multiple testing according to the Benjamini and Hochberg (BH) procedure(Benjamini & Hochberg, 1995) and genes with an adjusted P‐value lower than 0.05 were considered differentially expressed.
Motif discovery by RSAT
Motif discovery by RSAT was performed online on the RSAT peak motif search interface (http://rsat.sb‐roscoff.fr/) (Thomas‐Chollier et al, 2012). First, sequences of the merged RNAchIPseq peaks from PMA‐treated and unstimulated conditions were obtained in fasta format with strand orientation based on the Mus_musculus mm9 reference database (Ensembl release 67). The fasta files were then used as queries for RSAT peak‐motif discovery (parameters: peak‐motifs ‐v 1 ‐markov auto ‐disco oligos, positions ‐nmotifs 5 ‐minol 6 ‐maxol 8 ‐no_merge_lengths −1str ‐origin centre). The e‐value associated with each discovered motif represents the expected number of patterns which would be returned at random for a given probability of occurrence (P‐value).
Analysis of differential splicing events in the transcriptome by MAJIQ
Alternative splicing events occurring in the transcriptome between different conditions were analysed by the MAJIQ computational framework (v.2.1‐179b437) (Vaquero‐Garcia et al, 2016) with default parameters. For this purpose, the transcriptome was aligned with STAR (parameters: ‐‐outFilterMismatchNmax 1 ‐‐outMultimapperOrder Random ‐‐outSAMmultNmax 1 ‐‐outFilterMultimapNmax 30) on the mouse GRCm38/mm10 unmasked genome. The definition of annotated and de novo junctions were based on the mouse GRCm38/mm10 Ensembl annotation database. Analyses were performed by pairwise comparisons between experimental conditions, namely HP1γ versus KO, and HP1γ +PMA versus KO+PMA, for each triplicate. Local splicing variations (LSVs) were detected by the software and their relative abundance (PSI) quantified for each condition, leading to a relative change (dPSI) between HP1γ and KO for each junction involved in the LSV. The default threshold of change of |dPSI| >= 0.2 (20%) between conditions was used. Genomic locations of LSVs were converted from mm10 to mm9 by the Liftover tool at UCSC genome browser before further analysis.
Reporter minigene and splicing assay
The Prl3 reporter construct is based on the rat Prl gene fragment as described previously by the laboratory of J. Xie (Prl3 wt; (Lei et al, 2018). We designed a version of this construct with point mutations in the sequence of its (CA)n repeat motifs as described in Fig 6A (Prl3 CAmut). Both gene fragments were obtained by gene synthesis (Eurofins Genomics) and inserted with ApaI and BglII between two human beta globin exons in the pDUP175 vector. Transient transfections of the two Prl3 constructs were performed in 6‐well plates into HP1γ and KO cell lines with Fugene HD according to the manufacturer’s instructions. Total RNA was prepared as previously Chomczynski and Sacchi (2006). After DNAse treatment at 37°C for 20 min, reverse transcription was carried out with RT gene‐specific primer DUP1‐R, GCAGCTCACTCAGTGTGGCA and SuperScript III (Invitrogen) for 1h at 42°C on 0.5μg RNA, quantified with a nanodrop (Thermo Scientific). PCR (qPCR) was carried out on a Stratagene Mx3005p with Brilliant III SYBR Green kits (Stratagene) according to the manufacturer’s instructions with HBGEX‐F and HBGEX‐R primer pair, as listed in Appendix Table S2. Products of qPCR reactions performed for 25‐28 cycles only were resolved in 2% agarose gels with ethidium bromide, visualized and documented with a digital camera under UV. The PCR products corresponding to the included form (top band, 210bp) and to the skipped form (bottom band, 120bp) were quantitated via their intensities in the gels. These quantitations were used to calculate the inclusion of the Prl exon as the ratio between the 210bp band and total products (i.e. 120bp band and 210bp band).
Author contributions
CR conceived, carried out and analysed the experiments and performed some bioinformatics analyses. RL performed bioinformatics analyses for the RNAchIPseq and transcriptome. MC performed bioinformatics analyses with MAJIQ. HV performed statistical analyses. JY carried out the RNA preparations for the transcriptome. EK contributed to bioinformatics analysis of RNAchIP peak colocalizations. CM performed some bioinformatics analyses. CR and CM contributed to the overall orientations of the project. CR wrote the manuscript and all authors were involved in revising it critically for important intellectual content.
Conflict of interest
The authors declare that they have no conflict of interest.
Supporting information
Review Process File
Appendix
Expanded View Figures PDF
Table EV1
Source Data for Expanded View
Source Data for Figure 1
Source Data for Figure 2
Source Data for Figure 3
Source Data for Figure 4
Source Data for Figure 5
Source Data for Figure 6
Acknowledgements
We are grateful to all members of the Epigenetic Regulation unit for helpful discussions, Madeleine Moscatelli and Cynthia Bezier for helpful preliminary experiments, Catherine Bodin for technical assistance and Edith Ollivier for administrative assistance. Thanks to Caroline Proux for her expertise in library preparation and Illumina sequencing and to Eric Batsché for critically reading the manuscript. We thank Jiuyong Xie for the gift of plasmids. This work was supported by Institut National de la Santé et la Recherche Médicale (Inserm; C.R.), Centre National de la Recherche Scientifique (CNRS; C.M.), with grants from Institut Pasteur, Agence Nationale de la Recherche (ANR‐11‐BSV8–0013), Inserm Cancer (ITMO Cancer 20CN068‐00) and Labex REVIVE ‐ Investissements d’Avenir (to E.K. and C.M.). J.Y. is part of the Pasteur—Paris University (PPU) International PhD Program. This programme has received funding from the European Union's Horizon 2020 research and innovation programme under the Marie Sklodowska‐Curie grant agreement No 665807.
EMBO reports (2021) 22: e52320.
Contributor Information
Christophe Rachez, Email: christophe.rachez@sorbonne-universite.fr.
Christian Muchardt, Email: christian.muchardt@sorbonne-universite.fr.
Data availability
RNAchIP‐seq and RNA‐seq data have been deposited in the NCBI Gene Expression Omnibus database under GEO accession number GSE133267 (https://www.ncbi.nlm.nih.gov/geo/query/acc.cgi?acc=GSE133267).
References
- Allemand E, Myers MP, Garcia‐Bernardo J, Harel‐Bellan A, Krainer AR, Muchardt C (2016) A broad set of chromatin factors influences splicing. PLoS Genet 12: e1006318 [DOI] [PMC free article] [PubMed] [Google Scholar]
- Alló M, Buggiano V, Fededa JP, Petrillo E, Schor I, de la Mata M, Agirre E, Plass M, Eyras E, Elela SAet al (2009) Control of alternative splicing through siRNA‐mediated transcriptional gene silencing. Nat Struct Mol Biol 16: 717–724 [DOI] [PubMed] [Google Scholar]
- Almouzni G, Probst AV (2011) Heterochromatin maintenance and establishment: lessons from the mouse pericentromere. Nucleus 2: 332–338 [DOI] [PubMed] [Google Scholar]
- Ameyar‐Zazoua M, Rachez C, Souidi M, Robin P, Fritsch L, Young R, Morozova N, Fenouil R, Descostes N, Andrau J‐Cet al (2012) Argonaute proteins couple chromatin silencing to alternative splicing. Nat Struct Mol Biol 19: 998–1004 [DOI] [PubMed] [Google Scholar]
- Bannister AJ, Zegerman P, Partridge JF, Miska EA, Thomas JO, Allshire RC, Kouzarides T (2001) Selective recognition of methylated lysine 9 on histone H3 by the HP1 chromo domain. Nature 410: 120–124 [DOI] [PubMed] [Google Scholar]
- Benjamini Y, Hochberg Y (1995) Controlling the false discovery rate ‐ a practical and powerful approach to multiple testing. J R Stat Soc B Stat Methodol 57: 289–300 [Google Scholar]
- Bulut‐Karslioglu A, De La Rosa‐Velázquez I, Ramirez F, Barenboim M, Onishi‐Seebacher M, Arand J, Galán C, Winter G, Engist B, Gerle Bet al (2014) Suv39h‐dependent H3K9me3 marks intact retrotransposons and silences LINE elements in mouse embryonic stem cells. Mol Cell 55: 277–290 [DOI] [PubMed] [Google Scholar]
- Casale AM, Cappucci U, Fanti L, Piacentini L (2019) Heterochromatin protein 1 (HP1) is intrinsically required for post‐transcriptional regulation of Drosophila Germline Stem Cell (GSC) maintenance. Sci Rep 9: 4372 [DOI] [PMC free article] [PubMed] [Google Scholar]
- Cavaloc Y, Bourgeois CF, Kister L, Stevenin J (1999) The splicing factors 9G8 and SRp20 transactivate splicing through different and specific enhancers. RNA 5: 468–483 [DOI] [PMC free article] [PubMed] [Google Scholar]
- Chomczynski P, Sacchi N (2006) The single‐step method of RNA isolation by acid guanidinium thiocyanate‐phenol‐chloroform extraction: twenty‐something years on. Nat Protoc 1: 581–585 [DOI] [PubMed] [Google Scholar]
- Cokelaer T, Desvillechabrol D, Legendre R, Cardon M (2017) “Sequana”: a set of snakemake NGS pipelines. J Open Source Soft 2: 352 [Google Scholar]
- Dialynas GK, Terjung S, Brown JP, Aucott RL, Baron‐Luhr B, Singh PB, Georgatos SD (2007) Plasticity of HP1 proteins in mammalian cells. J Cell Sci 120: 3415–3424 [DOI] [PubMed] [Google Scholar]
- Dobin A, Davis CA, Schlesinger F, Drenkow J, Zaleski C, Jha S, Batut P, Chaisson M, Gingeras TR (2013) STAR: ultrafast universal RNA‐seq aligner. Bioinformatics 29: 15–21 [DOI] [PMC free article] [PubMed] [Google Scholar]
- Elbarbary RA, Lucas BA, Maquat LE (2016) Retrotransposons as regulators of gene expression. Science 351: aac7247 [DOI] [PMC free article] [PubMed] [Google Scholar]
- Harouz H, Rachez C, Meijer BM, Marteyn B, Donnadieu F, Cammas F, Muchardt C, Sansonetti P, Arbibe L (2014) Shigella flexneri targets the HP1gamma subcode through the phosphothreonine lyase OspF. EMBO J 33: 2606–2622 [DOI] [PMC free article] [PubMed] [Google Scholar]
- Hiragami‐Hamada K, Soeroes S, Nikolov M, Wilkins B, Kreuz S, Chen C, De La Rosa‐Velazquez IA, Zenn HM, Kost N, Pohl Wet al (2016) Dynamic and flexible H3K9me3 bridging via HP1beta dimerization establishes a plastic state of condensed chromatin. Nat Commun 7: 11310 [DOI] [PMC free article] [PubMed] [Google Scholar]
- Huang C, Su T, Xue Y, Cheng C, Lay FD, McKee RA, Li M, Vashisht A, Wohlschlegel J, Novitch BGet al (2017) Cbx3 maintains lineage specificity during neural differentiation. Genes Dev 31: 241–246 [DOI] [PMC free article] [PubMed] [Google Scholar]
- Hui J, Hung LH, Heiner M, Schreiner S, Neumuller N, Reither G, Haas SA, Bindereif A (2005) Intronic CA‐repeat and CA‐rich elements: a new class of regulators of mammalian alternative splicing. EMBO J 24: 1988–1998 [DOI] [PMC free article] [PubMed] [Google Scholar]
- Kaaij LJT, Mohn F, Van Der Weide RH, De Wit E, Buhler M (2019) The ChAHP complex counteracts chromatin looping at CTCF sites that emerged from SINE expansions in mouse. Cell 178: 1437–1451.e14 [DOI] [PubMed] [Google Scholar]
- Keller C, Adaixo R, Stunnenberg R, Woolcock KJ, Hiller S, Buhler M (2012) HP1(Swi6) mediates the recognition and destruction of heterochromatic RNA transcripts. Mol Cell 47: 215–227 [DOI] [PubMed] [Google Scholar]
- Lachner M, O'Carroll D, Rea S, Mechtler K, Jenuwein T (2001) Methylation of histone H3 lysine 9 creates a binding site for HP1 proteins. Nature 410: 116–120 [DOI] [PubMed] [Google Scholar]
- Larson AG, Elnatan D, Keenen MM, Trnka MJ, Johnston JB, Burlingame AL, Agard DA, Redding S, Narlikar GJ (2017) Liquid droplet formation by HP1alpha suggests a role for phase separation in heterochromatin. Nature 547: 236–240 [DOI] [PMC free article] [PubMed] [Google Scholar]
- Lei L, Cao W, Liu L, Das U, Wu Y, Liu G, Sohail M, Chen Y, Xie J (2018) Multilevel differential control of hormone gene expression programs by hnRNP L and LL in pituitary cells. Mol Cell Biol 38: e00651‐17 [DOI] [PMC free article] [PubMed] [Google Scholar]
- Leung DC, Lorincz MC (2012) Silencing of endogenous retroviruses: when and why do histone marks predominate? Trends Biochem Sci 37: 127–133 [DOI] [PubMed] [Google Scholar]
- Liao Y, Smyth GK, Shi W (2014) featureCounts: an efficient general purpose program for assigning sequence reads to genomic features. Bioinformatics 30: 923–930 [DOI] [PubMed] [Google Scholar]
- Love MI, Huber W, Anders S (2014) Moderated estimation of fold change and dispersion for RNA‐seq data with DESeq2. Genome Biol 15: 550 [DOI] [PMC free article] [PubMed] [Google Scholar]
- Luco RF, Allo M, Schor IE, Kornblihtt AR, Misteli T (2011) Epigenetics in alternative pre‐mRNA splicing. Cell 144: 16–26 [DOI] [PMC free article] [PubMed] [Google Scholar]
- Maison C, Bailly D, Peters AH, Quivy JP, Roche D, Taddei A, Lachner M, Jenuwein T, Almouzni G (2002) Higher‐order structure in pericentric heterochromatin involves a distinct pattern of histone modification and an RNA component. Nat Genet 30: 329–334 [DOI] [PubMed] [Google Scholar]
- Maison C, Bailly D, Roche D, Montes De Oca R, Probst AV, Vassias I, Dingli F, Lombard B, Loew D, Quivy JPet al (2011) SUMOylation promotes de novo targeting of HP1alpha to pericentric heterochromatin. Nat Genet 43: 220–227 [DOI] [PubMed] [Google Scholar]
- Maison C, Bailly D, Quivy JP, Almouzni G (2016) The methyltransferase Suv39h1 links the SUMO pathway to HP1alpha marking at pericentric heterochromatin. Nat Commun 7: 12224 [DOI] [PMC free article] [PubMed] [Google Scholar]
- Martin M (2011) Cutadapt removes adapter sequences from high‐throughput sequencing reads. EMBnet.journal 17: 10 [Google Scholar]
- Mateescu B, Bourachot B, Rachez C, Ogryzko V, Muchardt C (2008) Regulation of an inducible promoter by an HP1beta‐HP1gamma switch. EMBO Rep 9: 267–272 [DOI] [PMC free article] [PubMed] [Google Scholar]
- Minc E, Courvalin JC, Buendia B (2000) HP1gamma associates with euchromatin and heterochromatin in mammalian nuclei and chromosomes. Cytogenet Cell Genet 90: 279–284 [DOI] [PubMed] [Google Scholar]
- Motamedi MR, Hong EJ, Li X, Gerber S, Denison C, Gygi S, Moazed D (2008) HP1 proteins form distinct complexes and mediate heterochromatic gene silencing by nonoverlapping mechanisms. Mol Cell 32: 778–790 [DOI] [PMC free article] [PubMed] [Google Scholar]
- Muchardt C, Guilleme M, Seeler JS, Trouche D, Dejean A, Yaniv M (2002) Coordinated methyl and RNA binding is required for heterochromatin localization of mammalian HP1alpha. EMBO Rep 3: 975–981 [DOI] [PMC free article] [PubMed] [Google Scholar]
- Ostapcuk V, Mohn F, Carl SH, Basters A, Hess D, Iesmantavicius V, Lampersberger L, Flemr M, Pandey A, Thomä NHet al (2018) Activity‐dependent neuroprotective protein recruits HP1 and CHD4 to control lineage‐specifying genes. Nature 557: 739–743 [DOI] [PubMed] [Google Scholar]
- Pan Q, Shai O, Lee LJ, Frey BJ, Blencowe BJ (2008) Deep surveying of alternative splicing complexity in the human transcriptome by high‐throughput sequencing. Nat Genet 40: 1413–1415 [DOI] [PubMed] [Google Scholar]
- Piacentini L, Fanti L, Negri R, Del Vescovo V, Fatica A, Altieri F, Pimpinelli S (2009) Heterochromatin protein 1 (HP1a) positively regulates euchromatic gene expression through RNA transcript association and interaction with hnRNPs in Drosophila. PLoS Genet 5: e1000670 [DOI] [PMC free article] [PubMed] [Google Scholar]
- Quinlan AR, Hall IM (2010) BEDTools: a flexible suite of utilities for comparing genomic features. Bioinformatics 26: 841–842 [DOI] [PMC free article] [PubMed] [Google Scholar]
- Ramirez F, Ryan DP, Gruning B, Bhardwaj V, Kilpert F, Richter AS, Heyne S, Dundar F, Manke T (2016) deepTools2: a next generation web server for deep‐sequencing data analysis. Nucleic Acids Res 44: W160–W165 [DOI] [PMC free article] [PubMed] [Google Scholar]
- Robinson JT, Thorvaldsdottir H, Winckler W, Guttman M, Lander ES, Getz G, Mesirov JP (2011) Integrative genomics viewer. Nat Biotechnol 29: 24–26 [DOI] [PMC free article] [PubMed] [Google Scholar]
- Rossbach O, Hung LH, Khrameeva E, Schreiner S, Konig J, Curk T, Zupan B, Ule J, Gelfand MS, Bindereif A (2014) Crosslinking‐immunoprecipitation (iCLIP) analysis reveals global regulatory roles of hnRNP L. RNA Biol 11: 146–155 [DOI] [PMC free article] [PubMed] [Google Scholar]
- Saint‐Andre V, Batsche E, Rachez C, Muchardt C (2011) Histone H3 lysine 9 trimethylation and HP1gamma favor inclusion of alternative exons. Nat Struct Mol Biol 18: 337–344 [DOI] [PubMed] [Google Scholar]
- Skourti‐Stathaki K, Kamieniarz‐Gdula K, Proudfoot NJ (2014) R‐loops induce repressive chromatin marks over mammalian gene terminators. Nature 516: 436–439 [DOI] [PMC free article] [PubMed] [Google Scholar]
- Smallwood A, Hon GC, Jin F, Henry RE, Espinosa JM, Ren B (2012) CBX3 regulates efficient RNA processing genome‐wide. Genome Res 22: 1426–1436 [DOI] [PMC free article] [PubMed] [Google Scholar]
- Smothers JF, Henikoff S (2000) The HP1 chromo shadow domain binds a consensus peptide pentamer. Curr Biol 10: 27–30 [DOI] [PubMed] [Google Scholar]
- Sridharan R, Gonzales‐Cope M, Chronis C, Bonora G, Mckee R, Huang C, Patel S, Lopez D, Mishra N, Pellegrini Met al (2013) Proteomic and genomic approaches reveal critical functions of H3K9 methylation and heterochromatin protein‐1gamma in reprogramming to pluripotency. Nat Cell Biol 15: 872–882 [DOI] [PMC free article] [PubMed] [Google Scholar]
- Strom AR, Emelyanov AV, Mir M, Fyodorov DV, Darzacq X, Karpen GH (2017) Phase separation drives heterochromatin domain formation. Nature 547: 241–245 [DOI] [PMC free article] [PubMed] [Google Scholar]
- Sun M, Ha N, Pham DH, Frederick M, Sharma B, Naruse C, Asano M, Pipkin ME, George RE, Thai TH (2017) Cbx3/HP1gamma deficiency confers enhanced tumor‐killing capacity on CD8(+) T cells. Sci Rep 7: 42888 [DOI] [PMC free article] [PubMed] [Google Scholar]
- Thomas‐Chollier M, Herrmann C, Defrance M, Sand O, Thieffry D, Van Helden J (2012) RSAT peak‐motifs: motif analysis in full‐size ChIP‐seq datasets. Nucleic Acids Res 40: e31 [DOI] [PMC free article] [PubMed] [Google Scholar]
- Vakoc CR, Mandat SA, Olenchock BA, Blobel GA (2005) Histone H3 lysine 9 methylation and HP1gamma are associated with transcription elongation through mammalian chromatin. Mol Cell 19: 381–391 [DOI] [PubMed] [Google Scholar]
- Vaquero‐Garcia J, Barrera A, Gazzara MR, Gonzalez‐Vallinas J, Lahens NF, Hogenesch JB, Lynch KW, Barash Y (2016) A new view of transcriptome complexity and regulation through the lens of local splicing variations. Elife 5: e11752 [DOI] [PMC free article] [PubMed] [Google Scholar]
- Wahl MC, Will CL, Luhrmann R (2009) The spliceosome: design principles of a dynamic RNP machine. Cell 136: 701–718 [DOI] [PubMed] [Google Scholar]
- Wang ET, Sandberg R, Luo S, Khrebtukova I, Zhang L, Mayr C, Kingsmore SF, Schroth GP, Burge CB (2008) Alternative isoform regulation in human tissue transcriptomes. Nature 456: 470–476 [DOI] [PMC free article] [PubMed] [Google Scholar]
- Yearim A, Gelfman S, Shayevitch R, Melcer S, Glaich O, Mallm J‐P, Nissim‐Rafinia M, Cohen A‐H, Rippe K, Meshorer Eet al (2015) HP1 is involved in regulating the global impact of DNA methylation on alternative splicing. Cell Rep 10: 1122–1134 [DOI] [PubMed] [Google Scholar]
- Zhang Y, Liu T, Meyer CA, Eeckhoute J, Johnson DS, Bernstein BE, Nussbaum C, Myers RM, Brown M, Li Wet al (2008) Model‐based analysis of ChIP‐Seq (MACS). Genome Biol 9: R137 [DOI] [PMC free article] [PubMed] [Google Scholar]
Associated Data
This section collects any data citations, data availability statements, or supplementary materials included in this article.
Supplementary Materials
Review Process File
Appendix
Expanded View Figures PDF
Table EV1
Source Data for Expanded View
Source Data for Figure 1
Source Data for Figure 2
Source Data for Figure 3
Source Data for Figure 4
Source Data for Figure 5
Source Data for Figure 6
Data Availability Statement
RNAchIP‐seq and RNA‐seq data have been deposited in the NCBI Gene Expression Omnibus database under GEO accession number GSE133267 (https://www.ncbi.nlm.nih.gov/geo/query/acc.cgi?acc=GSE133267).