

Abstract
Background
Environmental fluctuation during embryonic and fetal development can permanently alter an organism’s morphology, physiology, and behaviour. This phenomenon, known as developmental plasticity, is particularly relevant to reptiles that develop in subterranean nests with variable oxygen tensions. Previous work has shown hypoxia permanently alters the cardiovascular system of snapping turtles and may improve cardiac anoxia tolerance later in life. The mechanisms driving this process are unknown but may involve epigenetic regulation of gene expression via DNA methylation. To test this hypothesis, we assessed in situ cardiac performance during 2 h of acute anoxia in juvenile turtles previously exposed to normoxia (21% oxygen) or hypoxia (10% oxygen) during embryogenesis. Next, we analysed DNA methylation and gene expression patterns in turtles from the same cohorts using whole genome bisulfite sequencing, which represents the first high-resolution investigation of DNA methylation patterns in any reptilian species.
Results
Genome-wide correlations between CpG and CpG island methylation and gene expression patterns in the snapping turtle were consistent with patterns observed in mammals. As hypothesized, developmental hypoxia increased juvenile turtle cardiac anoxia tolerance and programmed DNA methylation and gene expression patterns. Programmed differences in expression of genes such as SCN5A may account for differences in heart rate, while genes such as TNNT2 and TPM3 may underlie differences in calcium sensitivity and contractility of cardiomyocytes and cardiac inotropy. Finally, we identified putative transcription factor-binding sites in promoters and in differentially methylated CpG islands that suggest a model linking programming of DNA methylation during embryogenesis to differential gene expression and cardiovascular physiology later in life. Binding sites for hypoxia inducible factors (HIF1A, ARNT, and EPAS1) and key transcription factors activated by MAPK and BMP signaling (RREB1 and SMAD4) are implicated.
Conclusions
Our data strongly suggests that DNA methylation plays a conserved role in the regulation of gene expression in reptiles. We also show that embryonic hypoxia programs DNA methylation and gene expression patterns and that these changes are associated with enhanced cardiac anoxia tolerance later in life. Programming of cardiac anoxia tolerance has major ecological implications for snapping turtles, because these animals regularly exploit anoxic environments throughout their lifespan.
Supplementary Information
The online version contains supplementary material available at 10.1186/s13072-021-00414-7.
Introduction
The environment that an organism experiences in early life can have profound and long-lasting effects on their phenotype. This phenomenon, termed developmental plasticity, allows animals to permanently alter their morphology, physiology and behaviour in response to environmental signals [1]. In many cases, developmental plasticity provides organisms with a powerful mechanism to cope with environmental heterogeneity later in life [2]. However, unexpected or severe environmental stress during development can produce maladaptive phenotypes that increase disease susceptibility [3]. Despite the profound ecological implications of developmental plasticity, the underlying cellular and molecular mechanisms remain poorly defined.
Due to the profound health implications, most studies investigating developmental plasticity have focused on mammalian models of disease [4]. However, environmental variation during development is much more common in ectothermic animals, particularly oviparous species [5, 6]. These animals typically develop with little or no parental care and are routinely subjected to wide variations in abiotic factors such as temperature, water availability and atmospheric gases [7]. In particular, oviparous reptile nests can become severely hypoxic due to a progressive decline in nest oxygen tension from embryonic metabolism and microbial activity [8, 9]. The extent of hypoxia is nest-specific, but field estimates suggest reptilian eggs located farthest from the surface can be subjected to oxygen tensions as low as 11%, while those at the top of the nest remain at atmospheric oxygen (21%) [10]. Similar to other vertebrates, developmental hypoxia significantly alters turtle morphology and physiology, particularly at the level of the cardiovascular system [11–15]. Embryonic turtles exposed to hypoxia have different intrinsic heart rates and variable expression of receptors involved in cardiac regulation [11, 13, 16–19]. Furthermore, the effects of developmental hypoxia extend into juvenile and adult life, affecting cardiac performance and physiological traits [14, 15]. Of particular note, our recent study suggests juvenile turtles from hypoxic incubations possess cardiomyocyte specialisations that improve anoxia tolerance [20]. The programming of cardiac anoxia tolerance has major ecological implications for turtles, because many freshwater species, including Chrysemys picta, Trachemys scripta, and Chelydra serpentina, regularly engage in breath-hold dives that last several hours at warm temperatures, and they overwinter in anoxia for up to 5 months in ice-covered lakes [21, 22]. Even when metabolic rate and body temperature are taken into account, these freshwater turtles can survive anoxia 1000 times longer than a similarly sized mammal [23]. The maintenance of cardiac function is crucial for anoxia survival to ensure the delivery of nutrients and the removal of waste [24]. Therefore, early exposure to hypoxia may prime turtle heart physiology for a future life in anoxic environments.
The molecular mechanisms underlying cardiac programming in turtles are completely unknown but may involve epigenetic regulation of gene expression. Post-translational histone modifications and DNA methylation are the primary epigenetic marks shown to play a role in development and differentiation [25–27]. These marks regulate gene expression patterns, cell-fate decisions, and cellular physiology by altering DNA accessibility and chromatin structure. For example, trimethylation of histone H3 on lysine 4 (H3K4me3) at promoters is associated with gene activation, while trimethylation of lysine 27 on histone H3 (H3K27me3) is a repressive mark [28]. At least 70 different histone marks have been identified, each having unique effects on gene expression. The complexity of the histone code contrasts with the relative simplicity of DNA methylation, which is associated with transcriptional repression. DNA methylation is thought to inhibit transcription by interfering with transcription factor (TF) binding, though TF binding might reciprocally inhibit DNA methylation [29, 30]. Moreover, histone modifications and DNA methylation are interdependent, so de novo DNA methylation patterns laid down during embryogenesis help set the stage for maintenance of DNA methylation patterns and histone modifications through repeated cell divisions and into postnatal life [31, 32].
DNA methylation is a particularly stable, long-term mark that might be subject to environmental modification during development [33]. The most common mark is methylation of cytosines adjacent to guanines (i.e., CpG dinucleotides). Individual CpGs are typically methylated, while CpGs in clusters, called CpG islands (CGIs), are usually, though not always, found in an unmethylated state. The impact of CpG and CGI methylation on gene expression also depends upon their location within the genome. Recent work, for instance, has shown that enhancers and silencers display different patterns of CpG methylation and that orphan CGIs can act as potent enhancers [34–36]. This is on top of the classical observation that 60–70% of promoters contain CGIs [37].
Developmental hypoxia is known to alter DNA methylation and gene expression patterns in mammals, and the molecular signature is associated with cardiac abnormalities in adulthood [38, 39]. Therefore, programming of cardiac anoxia tolerance in snapping turtles may be achieved by similar mechanisms. Very little is currently known about DNA methylation landscapes in reptiles, because prior studies have almost exclusively measured global DNA methylation levels. We found one study that examined spatial patterns using MeDIP-Seq in the painted turtle, Chrysemys picta [40]. Key observations were that CpG distribution is bimodal in turtle promoters, as in other vertebrates [41], and that there is differential CpG methylation between hatchling ovaries and testes, including methylation differences in putative sex-determining genes. While MeDIP-Seq provides an overview of the methylation landscape at an affordable cost, it is an enrichment-based technique with shortcomings in terms of quantitatively measuring methylation levels and presenting a biased representation of the genome [42]. More importantly, we could not find a single study describing the most fundamental relationships between DNA methylation and gene expression patterns in reptiles.
In this study, we hypothesised that developmental hypoxia alters DNA methylation and gene expression patterns in turtles and that these patterns are associated with greater cardiac anoxia tolerance later in life. Snapping turtles take 9 to 18 years to reach sexual maturity, which makes it impractical to study developmental programming in adults. Instead, we tested for effects that persist in juvenile turtles months after their embryonic exposure to hypoxic conditions. To directly test these hypotheses, we first assessed cardiac performance during 2 h of acute anoxia in juvenile turtles previously exposed to normoxia (21% oxygen: N21) or hypoxia (10% oxygen: H10) during embryonic development. Next, we measured DNA methylation patterns in heart ventricles from the same cohorts using whole genome bisulfite sequencing (WGBS), the “gold standard” for DNA methylation analyses, as well as gene expression patterns using RNA-Seq. These experiments represent the first high-resolution investigation of DNA methylation patterns in any reptilian species. As hypothesized, developmental hypoxia increased juvenile turtle cardiac anoxia tolerance and programmed CpG and CGI methylation and gene expression patterns. DNA methylation and gene expression were broadly correlated at a genome-wide scale (e.g., genes with higher methylation at their promoters displayed lower expression, while those with lower promoter methylation displayed higher expression). In addition, genes that were differentially methylated between turtles from normoxic and hypoxic incubations were significantly more likely to be differentially expressed. The results suggest developmental hypoxia can programme turtle cardiovascular phenotype, spanning from molecular to physiological levels, which has important ecological implications for species that exploit anoxic environments.
Results
Developmental hypoxia improves cardiac anoxia tolerance
Body and heart masses of juvenile turtles used for in situ studies of cardiovascular physiology are provided in Table 1. Acute exposure to anoxia caused a progressive bradycardia (i.e., decreased heart rate) in both experimental groups (Fig. 1A), but the magnitude of this response was significantly greater in N21 (34 ± 6%) vs. H10 (20 ± 10%) turtles. A decrease in heart rate in low oxygen environments is a key feature of the “diving reflex”, which aids in the conservation of oxygen stores in air breathing vertebrates. In the N21 group, bradycardia was associated with a progressive reduction in systemic blood flow () and pulmonary blood flow () (Fig. 1B, C), while systemic stroke volume () and pulmonary stroke volume () remained relatively constant (Fig. 1E, F). The reduction in pulmonary blood flow () in N21 turtles during anoxia was proportionately greater than the reduction in systemic blood flow (), leading to an increase in the right-to-left (R–L) shunt of blood from the pulmonary to the systemic circulation (Fig. 1H). Turtles are able to physiologically control the outflow of blood through the pulmonary artery vs. systemic arteries (i.e., left and right aortas), because they have a three chambered heart with a single ventricle that is only partially divided by vertical and horizontal septa. An increase in R–L shunting recirculates systemic venous blood and bypasses the pulmonary circuit, while greater left-to-right (L–R) shunting recirculates blood through the pulmonary circuit. Changes in shunting may allow more efficient regulation of blood gases during periods of activity vs. rest [43]. Despite a significant reduction in total blood flow () in N21 turtles (Fig. 1D), there was only a small non-significant reduction in cardiac power output (Fig. 1J), while mean ventricular pressure remained relatively constant (Fig. 1I).
Table 1.
Body and heart masses of juvenile snapping turtles exposed to normoxia (N21) or hypoxia (H10) during embryonic development
| Cohort | Body mass (g) | Heart mass (mg) | Heart-to-body-mass ratio |
|---|---|---|---|
| N21 | 308.8 ± 24.5 | 648.7 ± 67.1 | 0.21 ± 0.01 |
| H10 | 314.9 ± 52.2 | 713.4 ± 115.9 | 0.23 ± 0.01* |
Significant differences were revealed by generalized linear models, followed by Sidak post-hoc tests, for multiple comparisons, and are denoted by asterisks (*), when P ≤ 0.05
Fig. 1.

Effects of acute anoxia and reoxygenation on haemodynamic variables from N21 and H10 turtles. Turtles from the N21 (red circles, n = 6) and H10 (blue squares, n = 5) cohorts were subjected to 120 min of anoxia followed by 30 min reoxygenation. A Heart rate (), B systemic blood flow (), C pulmonary blood flow (), D total blood flow (), E systemic stroke volume (), F pulmonary stroke volume (), G shunt distribution (), H shunt ratio (), I mean ventricular pressure (), and J cardiac power output. Values are mean ± SEM, asterisks (*) indicate statistically significance difference between N21 and H10 groups, dollar ($) and psi (Ψ) symbols denote a significant difference between that data point and pre-anoxic levels (time zero) in the N21 and H10 groups, respectively (p ≤ 0.05)
Apart from the “diving reflex” (i.e., bradycardia), other cardiovascular responses in H10 turtles were quite distinct from N21 turtles. Surprisingly, the anoxic bradycardia in H10 turtles was not associated with any changes in systemic () or pulmonary () blood flow or the R–L shunt, which all changed in N21 turtles. This meant that systemic () and pulmonary () stroke volumes were significantly elevated in H10 turtles during acute anoxia (Fig. 2). As a result of the elevated stroke volume, mean ventricular pressure and cardiac power output was maintained during 2 h of anoxia in H10 turtles (Fig. 1I, J). Therefore, the H10 group maintained higher blood flows, systemic stroke volume, and heart rate (, , , )and cardiac power output than the N21 cohort throughout the anoxic period (Figs. 1 and 2). In the N21 group, all haemodynamic variables reverted to normoxic levels after 30 min of reoxygenation (Fig. 1). For the H10 group, mean ventricular pressure was slightly depressed at the end of reoxygenation (Fig. 1I), and remained elevated (Fig. 1F), while all other haemodynamic variables returned to normoxic levels (Fig. 1).
Fig. 2.

Original traces of the effects of anoxia and reoxygenation on cardiac haemodynamic variables. Ventricular pressure (), left aortic arch blood flow (), left pulmonary artery blood flow () and heart rate () were measured in N21 (red lines) and H10 (blue lines) turtles during 10-min normoxia, 120-min anoxia, and 20-min reoxygenation
In addition to influencing responses to anoxia and reoxygenation, developmental hypoxia altered resting cardiovascular variables in snapping turtles, similar to previous reports [14]. While all haemodynamic variables fell within previously published in situ and in vivo values from Chelydra, Chrysemys, and Trachemys [14, 44], anaesthetised H10 turtles had significantly greater resting systemic blood flow (QSys)than N21 turtles, leading to a larger R–L shunt, elevated total blood flow (QTot) and elevated cardiac power output (Fig. 1, pre-anoxic levels). All the other haemodynamic variables were similar between experimental groups.
Embryonic hypoxia programs transcriptome-wide patterns of gene expression
Transcriptome-wide patterns of gene expression were investigated in 7- and 9-month-old snapping turtles previously exposed to hypoxia (H10, n = 8) or normoxia (N21, n = 8) during embryonic development. Within the hypoxic cohort, turtles had two distinct cardiac phenotypes; normal-sized (n = 4) and enlarged (n = 4) hearts, relative to their body size. Gene expression within both cohorts was found to be significantly affected by age, relative heart size, and embryonic oxygen concentration. Firstly, oxygen concentration during embryogenesis altered expression of 151 genes in juvenile turtles: 75 genes were up-regulated and 76 genes were down-regulated in ventricles from the H10 group, relative to the N21 group (Table 2). Ninety-seven genes displayed significant oxygen concentration by age interactions (Table 3) and 13 of these genes were also influenced by the main effect of oxygen concentration. Finally, 256 genes were differentially expressed between ventricles from normal-sized vs. enlarged hearts (47 of these genes were among the genes listed above). A total of 131 genes were up-regulated in ventricles of enlarged hearts, while 125 genes were down-regulated (Table 4). Altogether, there were 443 differentially expressed genes.
Table 2.
Genes that were differentially expressed between ventricles from juvenile snapping turtles exposed to normoxia (N21) or hypoxia (H10) during embryonic development
| Locus # | Gene name | Gene symbol | Log2 (H10/N21) |
|---|---|---|---|
| CS000018264 | Zinc finger family member 783 | − 2.834627001 | |
| CS000001503 | − 2.701680389 | ||
| CS000000288 | Myosin heavy chain 7 | − 2.041584511 | |
| CS000024278 | RALY RNA-binding protein-like | RALYL | − 1.527633917 |
| CS000008734 | Mast cell proteinase-3 | − 1.496662823 | |
| CS000015120 | − 1.356777695 | ||
| CS000017586 | Zinc finger protein 3 | − 1.273941158 | |
| CS000023536 | C-type lectin-domain family 2, member e | − 1.208247243 | |
| CS000009112 | Calcium-binding protein 5 | CABP5 | − 1.181213024 |
| CS000003610 | Serine/threonine kinase 32A | STK32A | − 1.121027915 |
| CS000017023 | Adhesion G protein-coupled receptor B2 | − 1.110900385 | |
| CS000011584 | Tripartite motif containing 58 | − 1.045883825 | |
| CS000002712 | Pseudouridylate synthase 1 | PUS1 | − 1.035714387 |
| CS000021405 | − 1.006176746 | ||
| CS000020555 | Granzyme H | GZMH | − 0.853897751 |
| CS000010063 | General transcription factor IIA subunit 1-like | GTF2A1L | − 0.792335632 |
| CS000018042 | Tribbles pseudokinase 1 | TRIB1 | − 0.765772922 |
| CS000008605 | Contactin associated protein 1 | CNTNAP1 | − 0.743987654 |
| CS000022576 | Immunoglobulin heavy constant gamma 2 (G2m marker) | − 0.740245463 | |
| CS000002010 | Nuclear receptor subfamily 1 group D member 2-like | − 0.731931571 | |
| CS000016349 | Zinc finger protein 3 | − 0.722476444 | |
| CS000011191 | Deoxyribonuclease 1-like 3 | DNASE1L3 | − 0.710756946 |
| CS000002882 | Short chain dehydrogenase (predicted) | − 0.697002063 | |
| CS000004234 | Lysozyme C-like | − 0.694683419 | |
| CS000019361 | Sperm flagellar 2 | − 0.637371303 | |
| CS000009788 | Bone morphogenetic protein 10 | BMP10 | − 0.625646157 |
| CS000022673 | Centrosomal protein 295 | − 0.621246238 | |
| CS000010768 | MAM domain containing 4 | MAMDC4 | − 0.616068017 |
| CS000002550 | Family with sequence similarity 217 member B | FAM217B | − 0.606523849 |
| CS000021864 | PZP, alpha-2-macroglobulin-like | − 0.600912295 | |
| CS000022474 | Dedicator of cytokinesis 2 | − 0.593278276 | |
| CS000007572 | − 0.564178825 | ||
| CS000002388 | Suppression of tumorigenicity 14 | ST14 | − 0.563702692 |
| CS000010941 | Coiled-coil domain containing 40 | CCDC40 | − 0.526253468 |
| CS000018526 | Modulator of smoothened protein | MOSMO | − 0.507345817 |
| CS000008639 | Kell blood group, metallo-endopeptidase | KEL | − 0.501729677 |
| CS000008272 | − 0.500144159 | ||
| CS000013388 | Coiled-coil domain containing 69 | − 0.488161437 | |
| CS000023033 | Calcitonin receptor | CALCR | − 0.478006366 |
| CS000013081 | PR/SET domain 8 | PRDM8 | − 0.470914245 |
| CS000010506 | NAD(P)H quinone dehydrogenase 2 | NQO2 | − 0.470257899 |
| CS000010015 | Proteolipid protein 1 | PLP1 | − 0.451285412 |
| CS000009837 | 6-Phosphofructo-2-kinase/fructose-2,6-biphosphatase 1 | PFKFB1 | − 0.445995285 |
| CS000013172 | Sperm flagellar 2 | SPEF2 | − 0.405206127 |
| CS000007175 | Adhesion G protein-coupled receptor L3 | ADGRL3 | − 0.390432656 |
| CS000018864 | Zinc finger protein 3 | − 0.387733152 | |
| CS000003471 | DNA damage inducible transcript 4-like | DDIT4L | − 0.381244306 |
| CS000013715 | THAP domain containing 9 | THAP9 | − 0.367754654 |
| CS000016980 | Leucine rich repeat containing 8 family member D | LRRC8D | − 0.360578313 |
| CS000024331 | Ceramide synthase 4 | CERS4 | − 0.329175611 |
| CS000004429 | Diphthamide biosynthesis 7 | DPH7 | − 0.31321296 |
| CS000024488 | Endogenous retrovirus group MER34 member 1 | − 0.283738212 | |
| CS000002360 | Activating transcription factor 1 | ATF1 | − 0.279120084 |
| CS000015148 | Tumor necrosis factor superfamily member 10 | TNFSF10 | − 0.25585253 |
| CS000001723 | ATM serine/threonine kinase | ATM | − 0.249457117 |
| CS000014235 | Anthrax toxin receptor 2 | ANTXR2 | − 0.244822743 |
| CS000023516 | Hypoxia inducible factor 1 alpha subunit | HIF1A | − 0.237980337 |
| CS000010455 | SURF1, cytochrome c oxidase assembly factor | SURF1 | − 0.222451553 |
| CS000021833 | Rho GTPase activating protein 45 | ARHGAP45 | − 0.221222304 |
| CS000013956 | Tribbles pseudokinase 2 | TRIB2 | − 0.217959675 |
| CS000002385 | Rho GTPase-activating protein 32 | ARHGAP32 | − 0.215929188 |
| CS000004163 | Solute carrier family 4 member 2 | SLC4A2 | − 0.212349304 |
| CS000010124 | Solute carrier family 35 member A1 | slc35a1 | − 0.20854517 |
| CS000007017 | Cingulin-like 1 | CGNL1 | − 0.198504808 |
| CS000009705 | F-box and leucine rich repeat protein 20 | FBXL20 | − 0.168085068 |
| CS000025011 | Retinoic acid receptor, alpha | 0.154424605 | |
| CS000009251 | Taxilin beta | TXLNB | 0.158953455 |
| CS000005867 | Epidermal growth factor receptor pathway substrate 8 | EPS8 | 0.163637442 |
| CS000023373 | Mannosidase beta | MANBA | 0.166087668 |
| CS000021122 | Sprouty related EVH1 domain containing 2 | SPRED2 | 0.170050721 |
| CS000008545 | Erb-b2 receptor tyrosine kinase 2 | ERBB2 | 0.187176414 |
| CS000000599 | Tubulin folding cofactor B | TBCB | 0.195969098 |
| CS000013318 | G protein subunit gamma 10 | GNG10 | 0.208058965 |
| CS000003073 | Cadherin 11, type 2, OB-cadherin (osteoblast) | 0.208906093 | |
| CS000008574 | 2′,3′-Cyclic nucleotide 3′ phosphodiesterase | CNP | 0.212460195 |
| CS000007985 | STARD3 N-terminal-like | STARD3NL | 0.219747393 |
| CS000009739 | Tropomyosin 3 | TPM3 | 0.236963141 |
| CS000024894 | Serine/threonine kinase 38-like | STK38L | 0.238422059 |
| CS000015359 | Spectrin beta, erythrocytic | 0.241602606 | |
| CS000013674 | Eva-1 homolog C | EVA1C | 0.245944042 |
| CS000010784 | Cholesteryl ester transfer protein | CETP | 0.246380083 |
| CS000010497 | Serpin peptidase inhibitor, clade B (ovalbumin), member 6 | 0.248181093 | |
| CS000009948 | 0.252507277 | ||
| CS000008411 | Integrin subunit alpha 11 | ITGA11 | 0.254329861 |
| CS000003646 | Ubiquitin conjugating enzyme E2 B | UBE2B | 0.254817922 |
| CS000014028 | C-type lectin-domain family 2 member D | 0.264505749 | |
| CS000011229 | Ribonuclease H2 subunit C | rnaseh2c | 0.27146634 |
| CS000023524 | Protein tyrosine phosphatase, non-receptor type 23 | 0.277562695 | |
| CS000009501 | Heparan sulfate 6-O-sulfotransferase 2 | HS6ST2 | 0.28065352 |
| CS000005400 | Inositol-trisphosphate 3-kinase A | ITPKA | 0.29921558 |
| CS000008774 | Mitogen-activated protein kinase kinase kinase 5 | MAP3K5 | 0.309585444 |
| CS000019402 | Heat shock protein family B (small) member 3 | HSPB3 | 0.328843966 |
| CS000014776 | Bardet-Biedl syndrome 1 protein | 0.33633198 | |
| CS000004507 | Cathepsin L | ctsl | 0.344555132 |
| CS000013316 | KIAA0368 | KIAA0368 | 0.353983994 |
| CS000020738 | Protein phosphatase, Mg2+/Mn2+-dependent 1H | PPM1H | 0.35982697 |
| CS000010357 | Potassium voltage-gated channel subfamily H member 6 | KCNH6 | 0.370923213 |
| CS000000947 | Pleckstrin homology-like domain family A member 3 | PHLDA3 | 0.371384191 |
| CS000000189 | Protein kinase AMP-activated non-catalytic subunit beta 2 | PRKAB2 | 0.376457859 |
| CS000021606 | Ependymin related 1 | EPDR1 | 0.384457752 |
| CS000013259 | Centromere protein H | CENPH | 0.384685483 |
| CS000004917 | Bone morphogenetic protein receptor type 2 | BMPR2 | 0.400771813 |
| CS000008544 | Growth factor receptor bound protein 7 | GRB7 | 0.443902422 |
| CS000001051 | Monooxygenase DBH-like 1 | MOXD1 | 0.459634006 |
| CS000003463 | Alcohol dehydrogenase 4 (class II), pi polypeptide | ADH4 | 0.494122016 |
| CS000017173 | Solute carrier family 2 member 11 | SLC2A11 | 0.501060861 |
| CS000011090 | Secreted phosphoprotein 1 | SPP1 | 0.517276571 |
| CS000021119 | Endogenous retrovirus group MER34 member 1 | 0.524982887 | |
| CS000014447 | PDZ-binding kinase | PBK | 0.542088418 |
| CS000011287 | Dual specificity protein phosphatase 10-like | 0.543863344 | |
| CS000009633 | Activated leukocyte cell adhesion molecule | ALCAM | 0.548683718 |
| CS000010233 | EFR3 homolog B | 0.554021781 | |
| CS000001795 | Transmembrane protein 71 | TMEM71 | 0.60589964 |
| CS000001243 | Myelin basic protein | MBP | 0.606334331 |
| CS000012858 | Suppressor of cytokine signaling 2 | SOCS2 | 0.635342108 |
| CS000001161 | Transmembrane protein 200C | tmem200c | 0.646446549 |
| CS000020994 | Transmembrane protein 151B-like | 0.64955796 | |
| CS000004537 | Charged multivesicular body protein 4C | CHMP4C | 0.649900032 |
| CS000008619 | ETS variant 4 | ETV4 | 0.668839089 |
| CS000014855 | Killer cell lectin-like receptor subfamily G, member 2 | 0.669227747 | |
| CS000018990 | Collagen type XXII alpha 1 chain | COL22A1 | 0.675489915 |
| CS000019220 | Keratin 8 | KRT8 | 0.683602204 |
| CS000019009 | Thrombospondin type 1 domain containing 7A | THSD7A | 0.718432909 |
| CS000005131 | Glutaredoxin | GLRX | 0.740909237 |
| CS000019856 | TNF receptor associated factor 2 | 0.756354667 | |
| CS000004598 | 0.765230508 | ||
| CS000006964 | Adaptor related protein complex 1 sigma 3 subunit | AP1S3 | 0.765814686 |
| CS000021260 | Potassium voltage-gated channel subfamily A member 4 | KCNA4 | 0.854709853 |
| CS000003440 | Apolipoprotein C1 | apoc1 | 0.878140809 |
| CS000019191 | Interaction protein for cytohesin exchange factors 1 | IPCEF1 | 0.879401672 |
| CS000009567 | Keratin 18 | KRT18 | 0.925644492 |
| CS000022727 | Fer-1-like family member 4 | FER1L4 | 0.964212443 |
| CS000020607 | DNA polymerase nu | POLN | 1.00608115 |
| CS000018642 | Hyaluronan-binding protein 2 | HABP2 | 1.034969644 |
| CS000014808 | Synaptonemal complex protein 1 | SYCP1 | 1.124476724 |
| CS000004949 | Myosin light chain 1 | MYL1 | 1.168968857 |
| CS000011884 | Ubiquinol-cytochrome c reductase complex assembly factor 2 | 1.298675033 | |
| CS000004501 | 1.320990056 | ||
| CS000004709 | Heparan sulfate–glucosamine 3-sulfotransferase 2 | HS3ST2 | 1.353228055 |
| CS000009646 | Adhesion G protein-coupled receptor G7 | ADGRG7 | 1.423863767 |
| CS000001877 | Glycoprotein nmb | GPNMB | 1.608451449 |
| CS000012011 | Coagulation factor III, tissue factor | F3 | 1.645631227 |
| CS000004554 | Complement C1r | C1R | 1.873883015 |
| CS000000330 | Matrix metallopeptidase 25 | MMP25 | 1.977548442 |
| CS000012602 | Neuritin 1 | NRN1 | 2.508897571 |
| CS000019631 | Perforin 1 | 2.667492969 | |
| CS000021046 | Complement C1r subcomponent | 2.710546811 | |
| CS000013720 | Vesicle-associated membrane protein 8-like | 3.126479237 | |
| CS000010724 | LIM homeobox 5 | LHX5 | 3.176148053 |
| CS000018878 | 4.264821788 | ||
| CS000012122 | Astacin-like metalloendopeptidase | 4.556056058 | |
The difference in expression in the last column is calculated as the log2 of the ratio of gene expression in turtles exposed to hypoxia divided by gene expression in turtles exposed to normoxia during embryonic development. Negative values indicate the gene was downregulated in the hypoxic group, while positive values indicate the gene was upregulated in the hypoxic group. The transcriptome was analyzed via RNA-Seq. Differences in gene expression were considered significant when results from DESeq2 and ANOVA were concordant
Table 3.
Genes that displayed significant oxygen concentration by age interactions in ventricles from juvenile snapping turtles exposed to normoxia (N21) or hypoxia (H10) during embryonic development and sampled at 7 months or 9 months of age
| locus_number | gene_name | gene_symbol |
|---|---|---|
| CS000013624 | von Willebrand factor A domain containing 5B1 | VWA5B1 |
| CS000017075 | Adhesion G protein-coupled receptor D2 | ADGRD2 |
| CS000002650 | Doublecortin domain containing 1 | |
| CS000020386 | ||
| CS000005701 | Extracellular leucine rich repeat and fibronectin type III domain containing 1 | ELFN1 |
| CS000007756 | Raf-1 proto-oncogene, serine/threonine kinase | RAF1 |
| CS000012404 | ||
| CS000011576 | Immunity related GTPase cinema | |
| CS000017702 | ||
| CS000017791 | Gag-pol precursor polyprotein | |
| CS000005252 | Myomesin 3 | MYOM3 |
| CS000013643 | Heat shock protein 30C L homeolog | |
| CS000007769 | ||
| CS000000238 | Tryptophan hydroxylase 1 | TPH1 |
| CS000022856 | ||
| CS000011558 | Transmembrane channel-like 5 | TMC5 |
| CS000020596 | Sortilin related VPS10 domain containing receptor 2 | SORCS2 |
| CS000004923 | CD28 molecule | CD28 |
| CS000008982 | Regulator of G-protein signaling 5 | RGS5 |
| CS000001877 | Glycoprotein nmb | GPNMB |
| CS000011960 | Crystallin alpha B | CRYAB |
| CS000000625 | HEN1 methyltransferase homolog 1 | HENMT1 |
| CS000011913 | Heat shock protein 30C L homeolog | |
| CS000021013 | Fibrous sheath interacting protein 1 | FSIP1 |
| CS000005377 | Galectin 1 | LGALS1 |
| CS000017153 | Guanylate-binding protein 2-like | |
| CS000000187 | Phosphoglycerate dehydrogenase | PHGDH |
| CS000011024 | Target of myb1-like 1 membrane trafficking protein | TOM1L1 |
| CS000016415 | Endogenous retrovirus group V member 2 | |
| CS000011191 | Deoxyribonuclease 1 like 3 | DNASE1L3 |
| CS000003395 | Ankyrin repeat and SOCS box containing 18 | ASB18 |
| CS000004493 | Spindle assembly abnormal protein 6 homolog | |
| CS000024997 | Toll like receptor 6 | TLR6 |
| CS000023735 | ||
| CS000001051 | Monooxygenase DBH like 1 | MOXD1 |
| CS000000229 | Potassium voltage-gated channel subfamily J member 11 | KCNJ11 |
| CS000001730 | Ferredoxin 1 | FDX1 |
| CS000005131 | Glutaredoxin | GLRX |
| CS000006114 | Chordin like 1 | CHRDL1 |
| CS000012086 | Actin, aortic smooth muscle-like | |
| CS000003405 | Fibronectin 1 | FN1 |
| CS000003059 | Carboxylesterase 2 | CES2 |
| CS000003128 | Cytochrome b-245 alpha chain | CYBA |
| CS000000901 | Transmembrane protein 159 L homeolog | tmem159.L |
| CS000023152 | Mindbomb E3 ubiquitin protein ligase 1 | MIB1 |
| CS000017081 | Prostaglandin-endoperoxide synthase 1 | PTGS1 |
| CS000017005 | Muskelin 1 | MKLN1 |
| CS000004866 | Myosin IB | MYO1B |
| CS000013316 | KIAA0368 | KIAA0368 |
| CS000001871 | Rap guanine nucleotide exchange factor 5 | RAPGEF5 |
| CS000015369 | Acyl-CoA-binding domain containing 6 | ACBD6 |
| CS000019402 | Heat shock protein family B (small) member 3 | HSPB3 |
| CS000004507 | Cathepsin L | ctsl |
| CS000009267 | RAB32, member RAS oncogene family | RAB32 |
| CS000003646 | Ubiquitin conjugating enzyme E2 B | UBE2B |
| CS000023259 | Crystallin zeta | CRYZ |
| CS000013749 | Pitrilysin metallopeptidase 1 | PITRM1 |
| CS000024623 | Myosin VC | MYO5C |
| CS000009274 | Glycoprotein integral membrane 1 | GINM1 |
| CS000008916 | Transmembrane protein 214 | TMEM214 |
| CS000002191 | Endothelin-converting enzyme 2 | ECE2 |
| CS000002902 | Gamma-aminobutyric acid type B receptor subunit 1 | GABBR1 |
| CS000011567 | Glycogen synthase 1 | GYS1 |
| CS000024960 | DExH-box helicase 9 | DHX9 |
| CS000023516 | Hypoxia inducible factor 1 alpha subunit | HIF1A |
| CS000009882 | Acyl-CoA oxidase 1 | ACOX1 |
| CS000017504 | Unc-5 netrin receptor A | UNC5A |
| CS000005022 | DnaJ heat shock protein family (Hsp40) member C11 | DNAJC11 |
| CS000003466 | tRNA methyltransferase 10A | TRMT10A |
| CS000001723 | ATM serine/threonine kinase | ATM |
| CS000007175 | Adhesion G protein-coupled receptor L3 | ADGRL3 |
| CS000018314 | General transcription factor IIIC subunit 2 | |
| CS000003458 | SWI/SNF-related, matrix-associated actin-dependent regulator of chromatin, subfamily a, containing DEAD/H box 1 | SMARCAD1 |
| CS000015974 | Coiled-coil domain containing 130 | CCDC130 |
| CS000009858 | Arginine demethylase and lysine hydroxylase | JMJD6 |
| CS000025151 | Jumonji and AT-rich interaction domain containing 2 | JARID2 |
| CS000014359 | Peroxisomal biogenesis factor 26 | PEX26 |
| CS000004897 | Transmembrane protein 237 | TMEM237 |
| CS000014907 | Zinc finger protein 219 | ZNF219 |
| CS000014046 | G protein-coupled receptor kinase 5-like | |
| CS000011309 | Zinc finger and SCAN domains 20 | |
| CS000003047 | WD repeat domain 88 | WDR88 |
| CS000003006 | Mucolipin 3 | MCOLN3 |
| CS000008630 | ||
| CS000007667 | FXYD domain containing ion transport regulator 3 | |
| CS000003008 | Mucolipin 2 | MCOLN2 |
| CS000019541 | Chromosome 21 orf 58 | |
| CS000009617 | Transmembrane protease, serine 7 | TMPRSS7 |
| CS000019987 | Plexin A3 | |
| CS000020555 | Granzyme H | GZMH |
| CS000009788 | Bone morphogenetic protein 10 | BMP10 |
| CS000011540 | von Willebrand factor A domain containing 3A | VWA3A |
| CS000021466 | ||
| CS000015152 | ||
| CS000008845 | Apolipoprotein F | APOF |
| CS000023912 | ||
| CS000020445 | UPF0061 protein xcc-b100,1894-like |
The transcriptome was analyzed via RNA-Seq. Differences in gene expression were considered significant when results from DESeq2 and ANOVA were concordant
Table 4.
Genes that were differentially expressed between ventricles from juvenile snapping turtles that had normal-sized or enlarged hearts relative to their body size
| Locus # | Gene name | Gene symbol | Log2 (enlarged/normal) |
|---|---|---|---|
| CS000003025 | DnaJ heat shock protein family (Hsp40) member A2 | DNAJA2 | − 4.00011659 |
| CS000005942 | Mucin 2, oligomeric mucus/gel-forming | MUC2 | − 4 |
| CS000020789 | − 4 | ||
| CS000020715 | − 3.970542981 | ||
| CS000000246 | − 3.412275459 | ||
| CS000000714 | Interleukin 22 | IL22 | − 2.460702344 |
| CS000008734 | Mast cell proteinase-3 | − 2.313632939 | |
| CS000006768 | Capping protein, Arp2/3 and myosin-I linker protein 3-like | − 2.266058389 | |
| CS000018994 | Capping protein regulator and myosin 1 linker 3 | CARMIL3 | − 2.256232917 |
| CS000008168 | Glucagon | GCG | − 1.725877497 |
| CS000002882 | Short chain dehydrogenase (predicted) | − 1.68846675 | |
| CS000020555 | Granzyme H | GZMH | − 1.641521247 |
| CS000011467 | T brachyury transcription factor | TBXT | − 1.62277543 |
| CS000009580 | Advillin | AVIL | − 1.59555768 |
| CS000017383 | G protein-coupled receptor 62 | GPR62 | − 1.591541521 |
| CS000018663 | Deleted in malignant brain tumors 1 protein-like | − 1.525993727 | |
| CS000008605 | Contactin associated protein 1 | CNTNAP1 | − 1.459617958 |
| CS000010544 | C-type lectin-domain family 2 member D | CLEC2D | − 1.349128576 |
| CS000014353 | Aldo–keto reductase family 1, member C3 (3-alpha hydroxysteroid dehydrogenase, type II) | − 1.341939485 | |
| CS000008622 | Sclerostin | sost | − 1.338528092 |
| CS000013408 | Solute carrier family 8 member A2 | SLC8A2 | − 1.333783678 |
| CS000012528 | Persephin | PSPN | − 1.322706586 |
| CS000009180 | CD69 molecule | CD69 | − 1.320171193 |
| CS000019803 | − 1.292382379 | ||
| CS000000790 | NFKB inhibitor like 1 | NFKBIL1 | − 1.268443921 |
| CS000020022 | Carcinoembryonic antigen related cell adhesion molecule 1 | CEACAM1 | − 1.249402634 |
| CS000009788 | Bone morphogenetic protein 10 | BMP10 | − 1.185425524 |
| CS000012770 | Nudix hydrolase 15 | NUDT15 | − 1.174821415 |
| CS000002010 | Nuclear receptor subfamily 1 group D member 2-like | NR1D2 | − 1.135755617 |
| CS000012951 | Zinc finger CW-type and PWWP domain containing 1 | ZCWPW1 | − 1.131146467 |
| CS000015104 | Rho GTPase activating protein 27 | ARHGAP27 | − 1.12138132 |
| CS000009000 | Cytochrome P450 family 8 subfamily B member 1 | CYP8B1 | − 1.119197734 |
| CS000023981 | Zinc finger protein 501-like | − 1.109988843 | |
| CS000019117 | − 1.093528795 | ||
| CS000004600 | − 1.076659475 | ||
| CS000020803 | − 1.076581749 | ||
| CS000024876 | MHC class II DLA DRB1 beta chain | − 0.99585363 | |
| CS000003266 | Synaptotagmin-15 | SYT15 | − 0.992965859 |
| CS000013911 | − 0.970276375 | ||
| CS000022474 | Dedicator of cytokinesis 2 | DOCK2 | − 0.970046644 |
| CS000011784 | C-type lectin-domain family 2, member e | − 0.947959012 | |
| CS000009177 | Zinc finger protein 2 | ZNF2 | − 0.9470744 |
| CS000017654 | Junctophilin 4 | JPH4 | − 0.9449115 |
| CS000017263 | USH1 protein network component harmonin | USH1C | − 0.941279454 |
| CS000012524 | Synovial sarcoma, X breakpoint 2 interacting protein S homeolog | ssx2ip.S | − 0.939268547 |
| CS000000565 | Ras and Rab interactor-like protein | RINL | − 0.892810687 |
| CS000023033 | Calcitonin receptor | CALCR | − 0.88702029 |
| CS000016033 | Ring finger protein 25 | rnf25 | − 0.882108694 |
| CS000021269 | Neural EGFL like 1 | NELL1 | − 0.868462024 |
| CS000012971 | Neuron derived neurotrophic factor | NDNF | − 0.866800964 |
| CS000020495 | Kinase non-catalytic C-lobe domain containing 1 | KNDC1 | − 0.852740249 |
| CS000002530 | Collagen type XX alpha 1 chain | COL20A1 | − 0.843443212 |
| CS000012304 | − 0.799063985 | ||
| CS000001767 | Septin 5 | SEPTIN5 | − 0.795109503 |
| CS000013081 | PR/SET domain 8 | PRDM8 | − 0.778512974 |
| CS000024963 | Zinc finger protein 862 | ZNF862 | − 0.776513766 |
| CS000002362 | Acid sensing ion channel subunit 1 | asic1 | − 0.77548223 |
| CS000006802 | Sortilin related VPS10 domain containing receptor 1 | SORCS1 | − 0.774579369 |
| CS000003991 | Nuclear receptor subfamily 0 group B member 2-like | NR0B2 | − 0.752752113 |
| CS000008630 | − 0.742661864 | ||
| CS000011782 | C-type lectin-domain family 2 member D | CLEC2D | − 0.738112094 |
| CS000020166 | Tweety family member 1 | TTYH1 | − 0.727823227 |
| CS000017666 | Spectrin beta, non-erythrocytic 4 | SPTBN4 | − 0.727759339 |
| CS000019541 | Chromosome 21 orf 58 | C21orf58 | − 0.693870417 |
| CS000014966 | Ficolin 3 | FCN3 | − 0.683027443 |
| CS000007237 | Collectin subfamily member 10 | COLEC10 | − 0.67828483 |
| CS000023359 | Ral guanine nucleotide dissociation stimulator like 3 | RGL3 | − 0.676871711 |
| CS000001261 | − 0.673565294 | ||
| CS000015636 | Ecto-NOX disulfide-thiol exchanger 1 | enox1 | − 0.667186029 |
| CS000018597 | Neurexin 2 | NRXN2 | − 0.658378249 |
| CS000004183 | Kelch-like 42 | − 0.645354432 | |
| CS000005642 | Topoisomerase (DNA) III alpha | TOP3A | − 0.637881286 |
| CS000012953 | Immunoglobulin superfamily containing leucine-rich repeat | ISLR | − 0.636348281 |
| CS000001835 | Actin-binding Rho activating protein | ABRA | − 0.622678244 |
| CS000006362 | Nicotinamide riboside kinase 2 | NMRK2 | − 0.57894428 |
| CS000000038 | KH and NYN domain containing | KHNYN | − 0.560880734 |
| CS000004606 | Aryl hydrocarbon receptor nuclear translocator like | ARNTL | − 0.550619038 |
| CS000008808 | Alcohol dehydrogenase, iron containing 1 | ADHFE1 | − 0.546993977 |
| CS000012473 | Progestin and adipoQ receptor family member 6 | PAQR6 | − 0.540783679 |
| CS000020112 | Ral guanine nucleotide dissociation stimulator-like 2 | RGL2 | − 0.528180794 |
| CS000024555 | Stimulator of chondrogenesis 1 | SCRG1 | − 0.525168151 |
| CS000003254 | Tubulin tyrosine ligase like 3 | TTLL3 | − 0.517188122 |
| CS000010967 | − 0.516398171 | ||
| CS000002912 | Tripartite motif containing 21 | TRIM21 | − 0.514703 |
| CS000016053 | Sosondowah ankyrin repeat-domain family member C | SOWAHC | − 0.50414698 |
| CS000007586 | Proline and arginine rich end leucine rich repeat protein | PRELP | − 0.495350825 |
| CS000019628 | Predicted gene 4070 | − 0.478962063 | |
| CS000000139 | Galactosidase beta 1 like | glb1l | − 0.476795916 |
| CS000009979 | Cysteine rich transmembrane BMP regulator 1 | CRIM1 | − 0.465661576 |
| CS000025399 | Collagen type IV alpha 6 chain | COL4A6 | − 0.464490703 |
| CS000014745 | Cadherin EGF LAG seven-pass G-type receptor 3 | celsr3 | − 0.458822636 |
| CS000002394 | Neurotrimin | NTM | − 0.456792451 |
| CS000024488 | Endogenous retrovirus group MER34 member 1 | ERVMER34-1 | − 0.456570624 |
| CS000002168 | fibroblast growth factor receptor 3 | FGFR3 | − 0.45517114 |
| CS000009429 | Endogenous retrovirus group PABLB member 1 Env polyprotein | ERVPABLB-1 | − 0.454624962 |
| CS000000163 | DNA polymerase kappa | POLK | − 0.449829124 |
| CS000000791 | TNF receptor-associated factor 2-like | − 0.446715719 | |
| CS000013923 | − 0.438881138 | ||
| CS000010076 | Tripartite motif containing 27 | TRIM27 | − 0.437359644 |
| CS000012780 | Potassium channel regulator | KCNRG | − 0.435061589 |
| CS000020545 | Nicotinamide N-methyltransferase-like | − 0.425412793 | |
| CS000018595 | Signal-induced proliferation-associated 1 | SIPA1 | − 0.420335966 |
| CS000017396 | RNA-binding motif protein 5 | RBM5 | − 0.420294548 |
| CS000015645 | Regulator of cell cycle | RGCC | − 0.410119835 |
| CS000008765 | TBC1 domain containing kinase | TBCK | − 0.409881882 |
| CS000010919 | Solute carrier family 25 member 10 | SLC25A10 | − 0.402643235 |
| CS000002886 | Collagen type XV alpha 1 chain | COL15A1 | − 0.399950238 |
| CS000013998 | Patatin like phospholipase domain containing 7 | PNPLA7 | − 0.393493799 |
| CS000009498 | Glypican 3 | GPC3 | − 0.383165019 |
| CS000025210 | Wnt family member 11 | WNT11 | − 0.382187878 |
| CS000013883 | BCL tumor suppressor 7B | BCL7B | − 0.378585114 |
| CS000023516 | Hypoxia inducible factor 1 alpha subunit | HIF1A | − 0.377701984 |
| CS000014058 | Collagen, type XVIII, alpha 1 | COL18A1 | − 0.360702793 |
| CS000017272 | RNA-binding motif protein 10 | RBM10 | − 0.359302205 |
| CS000001770 | Neuroepithelial cell transforming 1 | NET1 | − 0.352443733 |
| CS000004853 | Collagen type III alpha 1 chain | COL3A1 | − 0.328008574 |
| CS000024953 | − 0.321005944 | ||
| CS000005987 | Tyrosine kinase 2 | TYK2 | − 0.298269494 |
| CS000012361 | FUS RNA-binding protein | FUS | − 0.29508553 |
| CS000007770 | Nucleolar protein 8 | NOL8 | − 0.294633032 |
| CS000024095 | Syntrophin beta 1 | SNTB1 | − 0.294318957 |
| CS000003363 | Programmed cell death 11 | PDCD11 | − 0.264560467 |
| CS000018465 | Family with sequence similarity 234 member A | FAM234A | − 0.255178537 |
| CS000007341 | Catenin delta 1 | CTNND1 | − 0.251866178 |
| CS000012875 | LOC400927-CSNK1E readthrough | TPTEP2-CSNK1E | − 0.230967711 |
| CS000003886 | PDZ domain containing ring finger 3 | PDZRN3 | 0.22442223 |
| CS000020331 | Cyclin-dependent kinase 17 | CDK17 | 0.241724877 |
| CS000008574 | 2′,3′-Cyclic nucleotide 3′ phosphodiesterase | CNP | 0.266261699 |
| CS000015509 | Sodium voltage-gated channel alpha subunit 5 | SCN5A | 0.310625656 |
| CS000009739 | Tropomyosin 3 | TPM3 | 0.312184844 |
| CS000025418 | Peptidylprolyl isomerase A | PPIA | 0.314495662 |
| CS000023518 | MNAT1, CDK activating kinase assembly factor | MNAT1 | 0.323120508 |
| CS000013900 | N-Acetylglucosamine-1-phosphate transferase alpha and beta subunits | GNPTAB | 0.324699426 |
| CS000008711 | Synaptosome associated protein 29 | SNAP29 | 0.325626966 |
| CS000004194 | Mitochondrial ribosomal protein S18C | MRPS18C | 0.327277429 |
| CS000008823 | Nuclear receptor coactivator 2 | NCOA2 | 0.327760834 |
| CS000002566 | VAMP associated protein B and C | VAPB | 0.327878453 |
| CS000023702 | Prefoldin subunit 1 | PFDN1 | 0.332371862 |
| CS000008476 | Growth factor receptor bound protein 10 | GRB10 | 0.338931617 |
| CS000004780 | Amyloid beta precursor protein-binding family A member 1 | APBA1 | 0.340118016 |
| CS000006903 | Family with sequence similarity 183, member A | FAM183A | 0.340987831 |
| CS000001976 | HAUS augmin like complex subunit 8 | HAUS8 | 0.3445911 |
| CS000012782 | SPRY domain containing 7 | SPRYD7 | 0.353656911 |
| CS000011256 | Sushi domain containing 3 | SUSD3 | 0.362482561 |
| CS000013749 | Pitrilysin metallopeptidase 1 | PITRM1 | 0.38762199 |
| CS000007925 | Family with sequence similarity 118 member B | FAM118B | 0.392163014 |
| CS000020039 | Mitochondrial intermediate peptidase | MIPEP | 0.394441129 |
| CS000014649 | Hematological and neurological expressed 1 | HN1 | 0.40118652 |
| CS000003093 | Cadherin 13 | CDH13 | 0.40428373 |
| CS000008885 | Neural precursor cell expressed, developmentally down-regulated 9 | NEDD9 | 0.406086208 |
| CS000009999 | HAUS augmin like complex subunit 1 | HAUS1 | 0.407190489 |
| CS000012325 | Receptor interacting serine/threonine kinase 2 | RIPK2 | 0.407834454 |
| CS000003646 | Ubiquitin conjugating enzyme E2 B | UBE2B | 0.409403598 |
| CS000015494 | Limb development membrane protein 1 | LMBR1 | 0.413015468 |
| CS000014842 | LARGE xylosyl- and glucuronyltransferase 1 | LARGE1 | 0.418322361 |
| CS000009751 | Myosin light chain 7 | MYL7 | 0.419170988 |
| CS000003679 | Mitogen-activated protein kinase 9 | MAPK9 | 0.422947717 |
| CS000000944 | Troponin T2, cardiac type | TNNT2 | 0.431038749 |
| CS000002295 | Family with sequence similarity 83 member H | fam83h | 0.431750631 |
| CS000007019 | Aquaporin 9 | AQP9 | 0.436004498 |
| CS000016136 | Early endosome antigen 1 | EEA1 | 0.443580231 |
| CS000023302 | Cdc42 guanine nucleotide exchange factor 9 | ARHGEF9 | 0.459948169 |
| CS000021606 | Ependymin related 1 | EPDR1 | 0.477676177 |
| CS000011866 | Ras homolog family member C | RHOC | 0.481673372 |
| CS000019402 | Heat shock protein family B (small) member 3 | HSPB3 | 0.490224239 |
| CS000013608 | Transmembrane protein 51 | TMEM51 | 0.490548583 |
| CS000023885 | Formin homology 2 domain containing 3 | FHOD3 | 0.495382703 |
| CS000018274 | Cysteine and glycine rich protein 1 | CSRP1 | 0.498739165 |
| CS000003393 | ArfGAP with GTPase domain, ankyrin repeat and PH domain 1 | AGAP1 | 0.499342757 |
| CS000002632 | Cysteine and glycine rich protein 3 | CSRP3 | 0.506402578 |
| CS000023152 | Mindbomb E3 ubiquitin protein ligase 1 | MIB1 | 0.506464289 |
| CS000005359 | Synaptotagmin 11 | SYT11 | 0.507330807 |
| CS000000947 | Pleckstrin homology-like domain family A member 3 | PHLDA3 | 0.523937739 |
| CS000000229 | Potassium voltage-gated channel subfamily J member 11 | KCNJ11 | 0.524801955 |
| CS000020271 | Myosin, light chain 12A, regulatory, non-sarcomeric | MYL12A | 0.529612298 |
| CS000011198 | Adaptor protein, phosphotyrosine interacting with PH domain and leucine zipper 1 | APPL1 | 0.535485261 |
| CS000000757 | Testis development related protein | TDRP | 0.552047882 |
| CS000005687 | G protein subunit alpha 12 | GNA12 | 0.556060953 |
| CS000000925 | Nicotinamide riboside kinase 2-like | 0.559479152 | |
| CS000020993 | TYRO3 protein tyrosine kinase | TYRO3 | 0.560184602 |
| CS000009817 | Rho related BTB domain containing 2 | RHOBTB2 | 0.561224935 |
| CS000011090 | Secreted phosphoprotein 1 | SPP1 | 0.562276569 |
| CS000006432 | Glutathione peroxidase 4 | GPX4 | 0.570135795 |
| CS000000499 | Myopalladin | MYPN | 0.570884545 |
| CS000007378 | Heat shock protein family B (small) member 1 | HSPB1 | 0.57397187 |
| CS000012962 | Protease, serine 12 | PRSS12 | 0.583446299 |
| CS000005505 | SIVA1 apoptosis inducing factor | SIVA1 | 0.584199204 |
| CS000023280 | Sorbin and SH3 domain containing 2 | SORBS2 | 0.592192854 |
| CS000008152 | LY75-CD302 readthrough | LY75-CD302 | 0.601643015 |
| CS000006114 | Chordin like 1 | CHRDL1 | 0.606688517 |
| CS000005009 | Ring finger protein 207 | RNF207 | 0.606887706 |
| CS000004917 | Bone morphogenetic protein receptor type 2 | BMPR2 | 0.608134843 |
| CS000008531 | Digestive cysteine proteinase 2-like | 0.608312906 | |
| CS000000963 | Cardiac-enriched FHL2-interacting protein | CUNH10orf71 | 0.619320903 |
| CS000020738 | Protein phosphatase, Mg2+/Mn2+-dependent 1H | PPM1H | 0.625433587 |
| CS000001051 | Monooxygenase DBH like 1 | MOXD1 | 0.627515741 |
| CS000019311 | Protein kinase C alpha | PRKCA | 0.628980813 |
| CS000010890 | Family with sequence similarity 169 member A | FAM169A | 0.647101757 |
| CS000023075 | CD109 molecule | CD109 | 0.649459241 |
| CS000005076 | 0.653243213 | ||
| CS000014425 | B-Raf proto-oncogene, serine/threonine kinase | BRAF | 0.65486808 |
| CS000004507 | Cathepsin L | ctsl | 0.655047104 |
| CS000012086 | Actin, aortic smooth muscle-like | ACTA2 | 0.670113468 |
| CS000013316 | KIAA0368 | KIAA0368 | 0.692998191 |
| CS000018070 | Male germ cell associated kinase | MAK | 0.700509414 |
| CS000012890 | Sestrin 3 | SESN3 | 0.706989256 |
| CS000003989 | Pleckstrin homology domain interacting protein | PHIP | 0.710494062 |
| CS000017173 | Solute carrier family 2 member 11 | SLC2A11 | 0.732703259 |
| CS000020613 | Ribosomal protein S18-like | 0.73789984 | |
| CS000009633 | Activated leukocyte cell adhesion molecule | ALCAM | 0.742827537 |
| CS000011644 | DNA polymerase zeta catalytic subunit | REV3L | 0.770984303 |
| CS000004444 | RAB33A, member RAS oncogene family | RAB33A | 0.780890859 |
| CS000014388 | BICD cargo adaptor 1 | BICD1 | 0.789743481 |
| CS000019543 | 0.821651965 | ||
| CS000009594 | UDP glycosyltransferase 8-like | UGT8L | 0.823852981 |
| CS000008337 | Protein phosphatase, Mg2+/Mn2+-dependent 1L | PPM1L | 0.848557469 |
| CS000009656 | Collagen type VIII alpha 1 chain | COL8A1 | 0.897700653 |
| CS000006655 | G protein-coupled receptor kinase 3 | GRK3 | 0.898389538 |
| CS000012858 | Suppressor of cytokine signaling 2 | SOCS2 | 0.945191217 |
| CS000010981 | ATP-binding cassette subfamily A member 5 | ABCA5 | 0.957982052 |
| CS000001795 | Transmembrane protein 71 | TMEM71 | 0.991430672 |
| CS000023496 | AHNAK nucleoprotein 2 | AHNAK2 | 0.996386481 |
| CS000003395 | Ankyrin repeat and SOCS box containing 18 | ASB18 | 1.000007423 |
| CS000019856 | TNF receptor associated factor 2 | TRAF2 | 1.000486113 |
| CS000004132 | Low density lipoprotein receptor class A domain containing 4 | LDLRAD4 | 1.016079793 |
| CS000018434 | 1.023357895 | ||
| CS000021605 | Secreted frizzled related protein 4 | SFRP4 | 1.024078897 |
| CS000004537 | Charged multivesicular body protein 4C | CHMP4C | 1.033646338 |
| CS000009567 | Keratin 18 | KRT18 | 1.107725712 |
| CS000018802 | LanC like 3 | LANCL3 | 1.116482677 |
| CS000005377 | Galectin 1 | LGALS1 | 1.139460825 |
| CS000014226 | MOB kinase activator 1B | MOB1B | 1.171832671 |
| CS000018642 | Hyaluronan-binding protein 2 | HABP2 | 1.185512417 |
| CS000006855 | Transforming acidic coiled-coil-containing protein 2 | TACC2 | 1.237644425 |
| CS000005131 | Glutaredoxin | GLRX | 1.274526454 |
| CS000022717 | Fibrinogen C domain containing 1 | FIBCD1 | 1.354378958 |
| CS000024186 | Leucine rich repeat containing 3B | LRRC3B | 1.366458011 |
| CS000011960 | Crystallin alpha B | CRYAB | 1.397658976 |
| CS000013643 | Heat shock protein 30C L homeolog | 1.419468073 | |
| CS000018346 | Abnormal spindle microtubule assembly | ASPM | 1.420184199 |
| CS000014980 | Complement factor B | CFB | 1.459428513 |
| CS000011910 | Heat shock protein 30C L homeolog | 1.508403744 | |
| CS000008585 | Heat shock protein, alpha-crystallin-related, b11 | 1.521530969 | |
| CS000005252 | Myomesin 3 | MYOM3 | 1.56777953 |
| CS000012224 | TNF receptor associated factor 3 | TRAF3 | 1.605321051 |
| CS000021043 | Complement C1s | C1S | 1.630815717 |
| CS000013370 | Ectonucleoside triphosphate diphosphohydrolase 3 | entpd3 | 1.743604465 |
| CS000004501 | 1.793715013 | ||
| CS000007782 | Musculoskeletal, embryonic nuclear protein 1 | mustn1 | 1.852375511 |
| CS000022000 | Mast cell proteinase-1 | CPT1B | 1.895535655 |
| CS000016407 | Fc fragment of IgG-binding protein | FCGBP | 1.955167136 |
| CS000012089 | CD59 Molecule (CD59 Blood Group)-like | CD59 | 2.005971296 |
| CS000001877 | Glycoprotein nmb | GPNMB | 2.090003205 |
| CS000025123 | Mast cell proteinase-3 | 2.432617325 | |
| CS000000238 | Tryptophan hydroxylase 1 | TPH1 | 2.525652753 |
| CS000006963 | Secretogranin II | SCG2 | 3.207453439 |
The difference in expression in the last column is calculated as the log2 of the ratio of gene expression in enlarged hearts divided by gene expression in normal-sized hearts. Negative values indicate the gene was downregulated in enlarged hearts, while positive values indicate the gene was upregulated in enlarged hearts. The transcriptome was analyzed via RNA-Seq. Differences in gene expression were considered significant when results from DESeq2 and ANOVA were concordant
Hierarchical clustering of these genes by expression pattern showed separation of normal-sized from enlarged hearts (i.e., the two deepest branches in the dendrogram in Fig. 3A). There was also separation between younger and older turtles (the next deepest branches in the dendrogram). Finally, two distinct clusters contained the N21 and H10 groups from 7-month-old turtles (separation of red and blue branches in top half of the dendrogram). Overall, this pattern of clustering reflected clear expression differences between N21 and H10 groups.
Fig. 3.

Gene expression patterns in ventricles of 7-month-old and 9-month-old snapping turtles that had been incubated in normoxic or hypoxic conditions as embryos. Samples from the N21 cohort are shown with red circles and red lines, while the H10 cohort is shown with blue circles and blue lines. A Heatmap of RNA-Seq expression values for the 443 genes that were significantly affected by oxygen concentration during embryogenesis (Table 2), the oxygen concentration by age interaction (Table 3), and/or differed between ventricles from juvenile snapping turtles that had normal-sized or enlarged hearts relative to their body size (Table 4). Reverse transcription of total RNA and qPCR with rigorous standard curves were used to measure expression of 16 genes (B–Q) identified as differentially expressed in the RNA-Seq study. Significant differences between oxygen groups or oxygen by age interactions were confirmed for 14 genes (panels B through O), but not for 2 genes (panels P and Q). Expression levels are least squares means (± 1 SE) for each oxygen group at 7 and 9 months of age
Differentially expressed genes were enriched for several GO terms important for cardiac function and/or remodeling (Fig. 4). For GO Biological Processes, this included 8 differentially expressed genes that play a role in sarcomere organization, 33 genes that play a role in biological adhesion/cell adhesion, and 118 genes involved in signal transduction (Fig. 4; Table 5). For GO Cellular Components, 9 differentially expressed genes form collagen trimers, 11 genes are part of the Z-disc, 41 genes are found in the extracellular space, and 50 genes are part of the extracellular region (Fig. 4; Table 6). Several genes across different GO categories are candidates that might play a role in promoting cardiac anoxia tolerance in the H10 group.
Fig. 4.
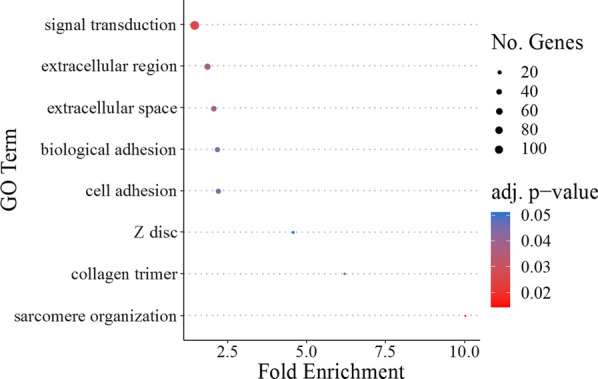
Gene Ontology terms significantly enriched among genes that were differentially expressed in ventricles from juvenile snapping turtles that had been incubated in normoxic or hypoxic conditions as embryos. Enrichment analysis was carried out on all 443 genes that were affected by oxygen concentration during embryogenesis (Table 2), the oxygen concentration by age interaction (Table 3), and/or those genes that differed between ventricles from turtles that had normal-sized vs. enlarged hearts relative to their body size (Table 4). The number of genes for each GO term is represented by the size of the circle, while the FDR adjusted p value is shown by the color of the circle
Table 5.
GO biological process terms and genes that were enriched among differentially expressed genes in ventricles from juvenile snapping turtles
| locus_number (in snapping turtle) | gene_name | gene_symbol |
|---|---|---|
| Sarcomere organization | ||
| CS000009788 | Bone morphogenetic protein 10 | BMP10 |
| CS000018274 | Cysteine and glycine rich protein 1 | CSRP1 |
| CS000002632 | Cysteine and glycine rich protein 3 | CSRP3 |
| CS000023885 | Formin homology 2 domain containing 3 | FHOD3 |
| CS000019220 | Keratin 8 | KRT8 |
| CS000005252 | Myomesin 3 | MYOM3 |
| CS000000499 | Myopalladin | MYPN |
| CS000000944 | Troponin T2, cardiac type | TNNT2 |
| Cell adhesion = biological adhesion | ||
| CS000007175 | Adhesion G protein-coupled receptor L3 | ADGRL3 |
| CS000009633 | Activated leukocyte cell adhesion molecule | ALCAM |
| CS000004780 | Amyloid beta precursor protein-binding family A member 1 | APBA1 |
| CS000009788 | Bone morphogenetic protein 10 | BMP10 |
| CS000003073 | Cadherin 11, type 2, OB-cadherin (osteoblast) | CDH11 |
| CS000003093 | Cadherin 13 | CDH13 |
| CS000014745 | Cadherin EGF LAG seven-pass G-type receptor 3 | celsr3 |
| CS000008605 | Contactin associated protein 1 | CNTNAP1 |
| CS000002886 | Collagen type XV alpha 1 chain | COL15A1 |
| CS000014058 | Collagen, type XVIII, alpha 1 | COL18A1 |
| CS000004853 | Collagen type III alpha 1 chain | COL3A1 |
| CS000025399 | Collagen type IV alpha 6 chain | COL4A6 |
| CS000009656 | Collagen type VIII alpha 1 chain | COL8A1 |
| CS000018274 | Cysteine and glycine rich protein 1 | CSRP1 |
| CS000007341 | Catenin delta 1 | CTNND1 |
| CS000021606 | Ependymin related 1 | EPDR1 |
| CS000003405 | Fibronectin 1 | FN1 |
| CS000001877 | Glycoprotein nmb | GPNMB |
| CS000018642 | Hyaluronan-binding protein 2 | HABP2 |
| CS000007378 | Heat shock protein family B (small) member 1 | HSPB1 |
| CS000012953 | Immunoglobulin superfamily containing leucine-rich repeat | ISLR |
| CS000008411 | Integrin subunit alpha 11 | ITGA11 |
| CS000009567 | Keratin 18 | KRT18 |
| CS000017005 | Muskelin 1 | MKLN1 |
| CS000020271 | Myosin, light chain 12A, regulatory, non-sarcomeric | MYL12A |
| CS000000499 | myopalladin | MYPN |
| CS000008885 | Neural precursor cell expressed, developmentally down-regulated 9 | NEDD9 |
| CS000018597 | Neurexin 2 | NRXN2 |
| CS000002394 | Neurotrimin | NTM |
| CS000019311 | Protein kinase C alpha | PRKCA |
| CS000011090 | Secreted phosphoprotein 1 | SPP1 |
| CS000020166 | Tweety family member 1 | TTYH1 |
| CS000020993 | TYRO3 protein tyrosine kinase | TYRO3 |
| Signal transduction | ||
| CS000017075 | Adhesion G protein-coupled receptor D2 | ADGRD2 |
| CS000009646 | Adhesion G protein-coupled receptor G7 | ADGRG7 |
| CS000007175 | Adhesion G protein-coupled receptor L3 | ADGRL3 |
| CS000003393 | ArfGAP with GTPase domain, ankyrin repeat and PH domain 1 | AGAP1 |
| CS000009633 | Activated leukocyte cell adhesion molecule | ALCAM |
| CS000011198 | Adaptor protein, phosphotyrosine interacting with PH domain and leucine zipper 1 | APPL1 |
| CS000002385 | Rho GTPase-activating protein 32 | ARHGAP32 |
| CS000021833 | Rho GTPase activating protein 45 | ARHGAP45 |
| CS000023302 | Cdc42 guanine nucleotide exchange factor 9 | ARHGEF9 |
| CS000003395 | Ankyrin repeat and SOCS box containing 18 | ASB18 |
| CS000001723 | ATM serine/threonine kinase | ATM |
| CS000013883 | BCL tumor suppressor 7B | BCL7B |
| CS000009788 | Bone morphogenetic protein 10 | BMP10 |
| CS000004917 | Bone morphogenetic protein receptor type 2 | BMPR2 |
| CS000014425 | B-Raf proto-oncogene, serine/threonine kinase | BRAF |
| CS000009112 | Calcium-binding protein 5 | CABP5 |
| CS000023033 | Calcitonin receptor | CALCR |
| CS000004923 | CD28 molecule | CD28 |
| CS000003093 | Cadherin 13 | CDH13 |
| CS000014745 | Cadherin EGF LAG seven-pass G-type receptor 3 | celsr3 |
| CS000006114 | chordin like 1 | CHRDL1 |
| CS000008605 | Contactin associated protein 1 | CNTNAP1 |
| CS000002886 | Collagen type XV alpha 1 chain | COL15A1 |
| CS000004853 | Collagen type III alpha 1 chain | COL3A1 |
| CS000025399 | Collagen type IV alpha 6 chain | COL4A6 |
| CS000009979 | Cysteine rich transmembrane BMP regulator 1 | CRIM1 |
| CS000011960 | Crystallin alpha B | CRYAB |
| CS000002632 | Cysteine and glycine rich protein 3 | CSRP3 |
| CS000007341 | Catenin delta 1 | CTNND1 |
| CS000003128 | Cytochrome b-245 alpha chain | CYBA |
| CS000005867 | Epidermal growth factor receptor pathway substrate 8 | EPS8 |
| CS000008545 | Erb-b2 receptor tyrosine kinase 2 | ERBB2 |
| CS000012011 | Coagulation factor III, tissue factor | F3 |
| CS000002168 | Fibroblast growth factor receptor 3 | FGFR3 |
| CS000003405 | Fibronectin 1 | FN1 |
| CS000002902 | Gamma-aminobutyric acid type B receptor subunit 1 | GABBR1 |
| CS000008168 | Glucagon | GCG |
| CS000005687 | G protein subunit alpha 12 | GNA12 |
| CS000013318 | G protein subunit gamma 10 | GNG10 |
| CS000001877 | Glycoprotein nmb | GPNMB |
| CS000017383 | G protein-coupled receptor 62 | GPR62 |
| CS000008476 | Growth factor receptor bound protein 10 | GRB10 |
| CS000008544 | Growth factor receptor bound protein 7 | GRB7 |
| CS000006655 | G protein-coupled receptor kinase 3 | GRK3 |
| CS000020555 | Granzyme H | GZMH |
| CS000023516 | Hypoxia inducible factor 1 alpha subunit | HIF1A |
| CS000007378 | Heat shock protein family B (small) member 1 | HSPB1 |
| CS000000714 | Interleukin 22 | IL22 |
| CS000008411 | Integrin subunit alpha 11 | ITGA11 |
| CS000005400 | Inositol-trisphosphate 3-kinase A | ITPKA |
| CS000009858 | Arginine demethylase and lysine hydroxylase | JMJD6 |
| CS000020495 | Kinase non-catalytic C-lobe domain containing 1 | KNDC1 |
| CS000009567 | Keratin 18 | KRT18 |
| CS000019220 | Keratin 8 | KRT8 |
| CS000015494 | Limb development membrane protein 1 | LMBR1 |
| CS000008774 | Mitogen-activated protein kinase kinase kinase 5 | MAP3K5 |
| CS000003679 | Mitogen-activated protein kinase 9 | MAPK9 |
| CS000001243 | Myelin basic protein | MBP |
| CS000023152 | Mindbomb E3 ubiquitin protein ligase 1 | MIB1 |
| CS000017005 | Muskelin 1 | MKLN1 |
| CS000014226 | MOB kinase activator 1B | MOB1B |
| CS000012971 | Neuron derived neurotrophic factor | NDNF |
| CS000008885 | Neural precursor cell expressed, developmentally down-regulated 9 | NEDD9 |
| CS000001770 | Neuroepithelial cell transforming 1 | NET1 |
| CS000000790 | NFKB inhibitor like 1 | NFKBIL1 |
| CS000018597 | Neurexin 2 | NRXN2 |
| CS000014447 | PDZ-binding kinase | PBK |
| CS000003989 | Pleckstrin homology domain interacting protein | PHIP |
| CS000000947 | Pleckstrin homology-like domain family A member 3 | PHLDA3 |
| CS000010015 | Proteolipid protein 1 | PLP1 |
| CS000000163 | DNA polymerase kappa | POLK |
| CS000025418 | Peptidylprolyl isomerase A | PPIA |
| CS000008337 | Protein phosphatase, Mg2+/Mn2+-dependent 1L | PPM1L |
| CS000000189 | Protein kinase AMP-activated non-catalytic subunit beta 2 | PRKAB2 |
| CS000019311 | Protein kinase C alpha | PRKCA |
| CS000012528 | Persephin | PSPN |
| CS000009267 | RAB32, member RAS oncogene family | RAB32 |
| CS000004444 | RAB33A, member RAS oncogene family | RAB33A |
| CS000007756 | Raf-1 proto-oncogene, serine/threonine kinase | RAF1 |
| CS000001871 | Rap guanine nucleotide exchange factor 5 | RAPGEF5 |
| CS000015645 | Regulator of cell cycle | RGCC |
| CS000020112 | Ral guanine nucleotide dissociation stimulator-like 2 | RGL2 |
| CS000023359 | Ral guanine nucleotide dissociation stimulator like 3 | RGL3 |
| CS000008982 | Regulator of G-protein signaling 5 | RGS5 |
| CS000009817 | Rho related BTB domain containing 2 | RHOBTB2 |
| CS000011866 | Ras homolog family member C | RHOC |
| CS000000565 | Ras and Rab interactor-like protein | RINL |
| CS000012325 | Receptor interacting serine/threonine kinase 2 | RIPK2 |
| CS000012890 | Sestrin 3 | SESN3 |
| CS000021605 | Secreted frizzled related protein 4 | SFRP4 |
| CS000018595 | Signal-induced proliferation-associated 1 | SIPA1 |
| CS000005505 | SIVA1 apoptosis inducing factor | SIVA1 |
| CS000012858 | Suppressor of cytokine signaling 2 | SOCS2 |
| CS000023280 | Sorbin and SH3 domain containing 2 | SORBS2 |
| CS000006802 | Sortilin related VPS10 domain containing receptor 1 | SORCS1 |
| CS000020596 | Sortilin related VPS10 domain containing receptor 2 | SORCS2 |
| CS000011090 | Secreted phosphoprotein 1 | SPP1 |
| CS000021122 | Sprouty related EVH1 domain containing 2 | SPRED2 |
| CS000003610 | Serine/threonine kinase 32A | STK32A |
| CS000024894 | Serine/threonine kinase 38 like | STK38L |
| CS000024997 | Toll like receptor 6 | TLR6 |
| CS000015148 | Tumor necrosis factor superfamily member 10 | TNFSF10 |
| CS000011024 | Target of myb1 like 1 membrane trafficking protein | TOM1L1 |
| CS000019856 | TNF receptor associated factor 2 | TRAF2 |
| CS000012224 | TNF receptor associated factor 3 | TRAF3 |
| CS000018042 | Tribbles pseudokinase 1 | TRIB1 |
| CS000002912 | Tripartite motif containing 21 | TRIM21 |
| CS000005987 | Tyrosine kinase 2 | TYK2 |
| CS000020993 | TYRO3 protein tyrosine kinase | TYRO3 |
| CS000017504 | unc-5 netrin receptor A | UNC5A |
| CS000002566 | VAMP associated protein B and C | VAPB |
| CS000025210 | Wnt family member 11 | WNT11 |
| CS000014907 | Zinc finger protein 219 | ZNF219 |
| CS000002650 | Doublecortin domain containing 1 | |
| CS000013923 | Uncharacterized | |
| CS000014046 | G protein-coupled receptor kinase 5-like | |
| CS000019987 | Plexin A3 | |
| CS000025011 | Retinoic acid receptor, alpha | |
Gene names and gene symbols are listed for each enriched GO term. Genes in the biological adhesion and cell adhesion lists were identical, because these are parent and child terms. GO terms were considered significant when FDR corrected p ≤ 0.05
Table 6.
GO Cellular Component terms and genes that were enriched among differentially expressed genes in ventricles from juvenile snapping turtles
| locus_number (in snapping turtle) | gene_name | gene_symbol |
|---|---|---|
| Collagen trimer | ||
| CS000004853 | Collagen type III alpha 1 chain | COL3A1 |
| CS000025399 | Collagen type IV alpha 6 chain | COL4A6 |
| CS000009656 | Collagen type VIII alpha 1 chain | COL8A1 |
| CS000002886 | Collagen type XV alpha 1 chain | COL15A1 |
| CS000014058 | Collagen, type XVIII, alpha 1 | COL18A1 |
| CS000002530 | Collagen type XX alpha 1 chain | COL20A1 |
| CS000018990 | Collagen type XXII alpha 1 chain | COL22A1 |
| CS000007237 | Collectin subfamily member 10 | COLEC10 |
| CS000014966 | Ficolin 3 | FCN3 |
| z-disc | ||
| CS000009788 | Bone morphogenetic protein 10 | BMP10 |
| CS000011960 | Crystallin alpha B | CRYAB |
| CS000018274 | Cysteine and glycine rich protein 1 | CSRP1 |
| CS000002632 | Cysteine and glycine rich protein 3 | CSRP3 |
| CS000023885 | Formin homology 2 domain containing 3 | FHOD3 |
| CS000007378 | Heat shock protein family B (small) member 1 | HSPB1 |
| CS000019220 | Keratin 8 | KRT8 |
| CS000005252 | Myomesin 3 | MYOM3 |
| CS000000499 | Myopalladin | MYPN |
| CS000015509 | Sodium voltage-gated channel alpha subunit 5 | SCN5A |
| CS000023280 | Sorbin and SH3 domain containing 2 | SORBS2 |
| Extracellular space | ||
| CS000008845 | Apolipoprotein F | APOF |
| CS000009788 | Bone morphogenetic protein 10 | BMP10 |
| CS000004917 | Bone morphogenetic protein receptor type 2 | BMPR2 |
| CS000004554 | Complement C1r | C1R |
| CS000021043 | Complement C1s | C1S |
| CS000023075 | CD109 molecule | CD109 |
| CS000003093 | Cadherin 13 | CDH13 |
| CS000003059 | Carboxylesterase 2 | CES2 |
| CS000010784 | Cholesteryl ester transfer protein | CETP |
| CS000014980 | Complement factor B | CFB |
| CS000008574 | 2′,3′-Cyclic nucleotide 3′ phosphodiesterase | CNP |
| CS000002886 | Collagen type XV alpha 1 chain | COL15A1 |
| CS000014058 | Collagen, type XVIII, alpha 1 | COL18A1 |
| CS000002530 | Collagen type XX alpha 1 chain | COL20A1 |
| CS000018990 | Collagen type XXII alpha 1 chain | COL22A1 |
| CS000004853 | Collagen type III alpha 1 chain | COL3A1 |
| CS000025399 | Collagen type IV alpha 6 chain | COL4A6 |
| CS000009656 | Collagen type VIII alpha 1 chain | COL8A1 |
| CS000007237 | Collectin subfamily member 10 | COLEC10 |
| CS000005701 | Extracellular leucine rich repeat and fibronectin type III domain containing 1 | ELFN1 |
| CS000012011 | Coagulation factor III, tissue factor | F3 |
| CS000003405 | Fibronectin 1 | FN1 |
| CS000008168 | Glucagon | GCG |
| CS000018642 | Hyaluronan-binding protein 2 | HABP2 |
| CS000007378 | Heat shock protein family B (small) member 1 | HSPB1 |
| CS000000714 | Interleukin 22 | IL22 |
| CS000005377 | Galectin 1 | LGALS1 |
| CS000024186 | Leucine rich repeat containing 3B | LRRC3B |
| CS000000330 | Matrix metallopeptidase 25 | MMP25 |
| CS000001051 | Monooxygenase DBH like 1 | MOXD1 |
| CS000025418 | Peptidylprolyl isomerase A | PPIA |
| CS000007586 | Proline and arginine rich end leucine rich repeat protein | PRELP |
| CS000012528 | Persephin | PSPN |
| CS000006963 | Secretogranin II | SCG2 |
| CS000024555 | Stimulator of chondrogenesis 1 | SCRG1 |
| CS000021605 | Secreted frizzled related protein 4 | SFRP4 |
| CS000008622 | Sclerostin | sost |
| CS000011090 | Secreted phosphoprotein 1 | SPP1 |
| CS000002388 | Suppression of tumorigenicity 14 | ST14 |
| CS000025210 | Wnt family member 11 | WNT11 |
| CS000012404 | Uncharacterized | |
| CS000021864 | PZP, alpha-2-macroglobulin like | |
| Extracellular region | ||
| CS000014235 | Anthrax toxin receptor 2 | ANTXR2 |
| CS000003440 | Apolipoprotein C1 | apoc1 |
| CS000021833 | Rho GTPase activating protein 45 | ARHGAP45 |
| CS000009788 | Bone morphogenetic protein 10 | BMP10 |
| CS000004554 | Complement C1r | C1R |
| CS000021043 | Complement C1s | C1S |
| CS000010941 | Coiled-coil domain containing 40 | CCDC40 |
| CS000023075 | CD109 molecule | CD109 |
| CS000003093 | Cadherin 13 | CDH13 |
| CS000010784 | Cholesteryl ester transfer protein | CETP |
| CS000014980 | Complement factor B | CFB |
| CS000006114 | Chordin like 1 | CHRDL1 |
| CS000002886 | Collagen type XV alpha 1 chain | COL15A1 |
| CS000014058 | Collagen, type XVIII, alpha 1 | COL18A1 |
| CS000002530 | Collagen type XX alpha 1 chain | COL20A1 |
| CS000018990 | Collagen type XXII alpha 1 chain | COL22A1 |
| CS000004853 | Collagen type III alpha 1 chain | COL3A1 |
| CS000025399 | Collagen type IV alpha 6 chain | COL4A6 |
| CS000009656 | Collagen type VIII alpha 1 chain | COL8A1 |
| CS000007237 | Collectin subfamily member 10 | COLEC10 |
| CS000009979 | Cysteine rich transmembrane BMP regulator 1 | CRIM1 |
| CS000011191 | Deoxyribonuclease 1 like 3 | DNASE1L3 |
| CS000021606 | Ependymin related 1 | EPDR1 |
| CS000013674 | Eva-1 homolog C | EVA1C |
| CS000014966 | Ficolin 3 | FCN3 |
| CS000002168 | Fibroblast growth factor receptor 3 | FGFR3 |
| CS000003405 | Fibronectin 1 | FN1 |
| CS000002902 | Gamma-aminobutyric acid type B receptor subunit 1 | GABBR1 |
| CS000008168 | Glucagon | GCG |
| CS000009498 | Glypican 3 | GPC3 |
| CS000018642 | Hyaluronan-binding protein 2 | HABP2 |
| CS000000714 | Interleukin 22 | IL22 |
| CS000012953 | Immunoglobulin superfamily containing leucine-rich repeat | ISLR |
| CS000005377 | Galectin 1 | LGALS1 |
| CS000012971 | Neuron derived neurotrophic factor | NDNF |
| CS000021269 | Neural EGFL like 1 | NELL1 |
| CS000012602 | Neuritin 1 | NRN1 |
| CS000002394 | Neurotrimin | NTM |
| CS000025418 | Peptidylprolyl isomerase A | PPIA |
| CS000007586 | Proline and arginine rich end leucine rich repeat protein | PRELP |
| CS000012962 | Protease, serine 12 | PRSS12 |
| CS000012528 | Persephin | PSPN |
| CS000013172 | Sperm flagellar 2 | SPEF2 |
| CS000011090 | Secreted phosphoprotein 1 | SPP1 |
| CS000019009 | Thrombospondin type 1 domain containing 7A | THSD7A |
| CS000015148 | Tumor necrosis factor superfamily member 10 | TNFSF10 |
| CS000011540 | von Willebrand factor A domain containing 3A | VWA3A |
| CS000013624 | von Willebrand factor A domain containing 5B1 | VWA5B1 |
| CS000025210 | Wnt family member 11 | WNT11 |
| CS000012404 | Uncharacterized | |
Gene names and gene symbols are listed for each enriched GO term. GO terms were considered significant when FDR corrected p ≤ 0.05
We selected genes for qPCR validation from the GO categories described above based on their established role in influencing cardiac function and anoxia tolerance, including genes associated with heart defects in humans or other species, genes involved in calcium signaling or mitochondrial function, and/or genes that regulate expression of other genes. Overall, differential expression was confirmed for 14 of 16 genes examined (Table 7; Fig. 3B–Q). Some genes, such as DDIT4L and WNT11, were expressed at consistently lower levels in the H10 group compared to the N21 group at both ages (Fig. 3B, C). Other genes, such as ITGA11, MIPEP, MNAT1, PPIA, TNNT2, and TPM3, were reliably higher in the H10 group compared to the N21 group (Figs. 3D–I). Several genes displayed treatment by age interactions. For COL8A1, NCOA2, and SCN5A there was no difference at 7 months of age, but expression was higher in the H10 group than the N21 group at 9 months of age (Fig. 3J–L). For HIF1A and PFKFB1, there was no difference at 7 months of age, but expression was lower in the H10 group than the N21 group at 9 months of age (Fig. 3M, N). Another pattern was observed for HTRA3, which differed between treatment groups at 7 months of age, but not at 9 months of age (Fig. 3O). In contrast, CALR and SNTB1 did not differ between N21 and H10 groups at either age (Fig. 3P, Q).
Table 7.
Results from a two-way ANCOVA for mRNA expression in ventricles from juvenile snapping turtles
| Gene | Oxygen treatment | Age | Oxygen treatment × age | Covariate |
|---|---|---|---|---|
| CALR | F1,20 = 0.27, p = 0.61 | F1,20 = 4.5, p = 0.05 | F1,20 = 0.18, p = 0.68 | F1,20 = 0.71, p = 0.41 |
| COL8A1 | F1,20 = 6.9, p = 0.02 | F1,20 = 15.5, p = 0.0008 | F1,20 = 3.6, p = 0.07 | F1,20 = 8.3, p = 0.009 |
| DDIT4L | F1,20 = 9.3, p = 0.006 | F1,20 = 0.21, p = 0.65 | F1,20 = 0.20, p = 0.66 | F1,20 = 14.4, p = 0.001 |
| HIF1A | F1,20 = 3.85, p = 0.06 | F1,20 = 0.04, p = 0.85 | F1,20 = 6.0, p = 0.02 | F1,20 = 0.96, p = 0.34 |
| HTRA3 | F1,19 = 5.2, p = 0.03 | F1,19 = 3.9, p = 0.06 | F1,19 = 6.2, p = 0.02 | F1,19 = 6.0, p = 0.02 |
| ITGA11 | F1,20 = 5.4, p = 0.03 | F1,20 = 4.4, p = 0.05 | F1,20 = 0.66, p = 0.43 | F1,20 = 0.95, p = 0.34 |
| MIPEP | F1,20 = 8.2, p = 0.01 | F1,20 = 0.14, p = 0.71 | F1,20 = 0.04, p = 0.85 | F1,20 = 8.9, p = 0.007 |
| MNAT1 | F1,20 = 9.2, p = 0.006 | F1,20 = 3.1, p = 0.09 | F1,20 = 0.48, p = 0.5 | F1,20 = 0.08, p = 0.78 |
| NCOA2 | F1,20 = 5.9, p = 0.02 | F1,20 = 5.1, p = 0.03 | F1,20 = 2.26, p = 0.15 | F1,20 = 7.9, p = 0.01 |
| PFKFB1 | F1,20 = 20.8, p = 0.0002 | F1,20 = 10.4, p = 0.004 | F1,20 = 15.4, p = 0.0008 | F1,20 = 2.2, p = 0.15 |
| PPIA | F1,20 = 5.3, p = 0.03 | F1,20 = 3.3, p = 0.08 | F1,20 = 0.24, p = 0.63 | F1,20 = 0.17, p = 0.69 |
| SCN5A | F1,17 = 4.6, p = 0.05 | F1,17 = 0.04, p = 0.85 | F1,17 = 7.3, p = 0.015 | F1,17 = 16.5, p = 0.0008 |
| SNTB1 | F1,20 = 0.05, p = 0.82 | F1,20 = 4.3, p = 0.05 | F1,20 = 0.79, p = 0.38 | F1,20 = 0.003, p = 0.96 |
| TNNT2 | F1,20 = 6.0, p = 0.02 | F1,20 = 0.01, p = 0.93 | F1,20 = 0.13, p = 0.72 | F1,20 = 0.12, p = 0.74 |
| TPM3 | F1,20 = 12.5, p = 0.002 | F1,20 = 1.6, p = 0.22 | F1,20 = 0.32, p = 0.58 | F1,20 = 1.8, p = 0.19 |
| WNT11 | F1,20 = 4.6, p = 0.04 | F1,20 = 3.4, p = 0.08 | F1,20 = 0.01, p = 0.92 | F1,20 = 1.3, p = 0.27 |
Oxygen treatment, age, and the oxygen treatment by age interaction were fixed effects in the model. The first principal component from a principal components analysis of CACNA2D1, CNP, and YTHDF3 expression was used as the covariate in the ANCOVA. Significant effects (p ≤ 0.05) are highlighted in bolditalics
Genome-wide correlation between DNA methylation and gene expression
DNA samples from ventricles of 9-month-old turtles were used for WGBS (n = 3 from N21 and n = 3 from H10). Given that DNA methylation landscapes have never been examined at a genome-wide scale in any reptile, basic patterns of DNA methylation were characterized before testing for differences between treatment groups. The draft snapping turtle genome contains approximately 142.4 million CpG dinucleotides. The distribution of CGIs in different genomic features was not random with respect to the proportion of the genome found in promoters, gene bodies, and intergenic regions: more CGIs were found in promoters (0 to − 1000 bp from the transcription start site) and in gene bodies than expected by chance, while fewer CGIs were found in intergenic regions (Table 8). For CpGs with sufficient read coverage (≥ 10 reads in 2/3 of replicates), levels of methylation were high (two thirds of CpGs across the genome were 75–100% methylated) and there were clear differences in methylation patterns among genomic features (Fig. 5). Intergenic regions (Fig. 5A) had a broader range of DNA methylation levels than did gene bodies (Fig. 5B). Intergenic regions had a higher proportion of CpGs with 0–75% methylation and a lower proportion of CpGs with 75–100% methylation than did gene bodies (Table 9). In other words, gene bodies were more heavily methylated than intergenic regions.
Table 8.
Summary of the observed and the expected number of CGIs in different genomic features
| Genome feature | Length of feature in genome | Proportion of genome | Observed CpG Islands | Expected CpG Islands |
|---|---|---|---|---|
| Intergenic region | 2,167,077,285 | 0.96 | 109,766 | 193,725 |
| Promoter | 22,812,000 | 0.01 | 4689 | 2039 |
| Gene body | 67,834,108 | 0.03 | 87,373 | 6064 |
| Total | 2,257,723,393 | 1.0 | 201,828 | 201,828 |
Expected numbers of CGIs in intergenic regions, promoters, and gene bodies were calculated based on the proportion of the snapping turtle genome found in each of these genomic features
Fig. 5.

CpG methylation and gene expression patterns in the ventricles of juvenile snapping turtles. Probability density function for CpG methylation level in various genome features (A–F). A Intergenic regions (n = 12,840,311), B gene bodies (n = 3,426,421), C promoters (n = 68,168), D first exons (n = 40,226), E remaining exons (242,295), and F introns (n = 3,1561,179). Violin plots showing CpG methylation levels for various gene features as a function of gene expression level (G–K). Genes were divided into expression deciles with the lowest expressed genes in the first decile and the highest expressed genes in the tenth decile as shown on the X axis. The width of the violin corresponds to the probability density function for the methylation level shown on the Y axis. The bar in the middle of each violin shows the interquartile range and the white dot shows the median methylation level for each expression decile. Spearman’s rank correlations (ρ) between DNA methylation and gene expression were highly significant for all gene features (***p < 0.001). G Gene bodies (n = 3,426,421), H promoters (n = 68,168), I first exons (n = 40,226), J remaining exons (242,295), and K introns (n = 3,1561,179)
Table 9.
Summary of the number of CpG sites by their genomic location and methylation level
| Genome feature | 0–25% Methylation | 25–50% Methylation | 50–75% Methylation | 75–100% Methylation | Total CpGs |
|---|---|---|---|---|---|
| Intergenic region | 589,261 (4.6%) | 1,149,789 (8.9%) | 3,112,308 (24.2%) | 7,988,953 (62.2%) | 12,840,311 |
| Gene body | 132,403 (3.9%) | 212,133 (6.2%) | 607,207 (17.7%) | 2,474,678 (72.2%) | 3,426,421 |
| Promoter | 13,500 (19.8%) | 5950 (8.7%) | 12,777 (18.7%) | 35,941 (52.7%) | 68,168 |
| First exon | 5000 (12.4%) | 2755 (6.8%) | 7914 (19.7%) | 24,557 (61.0%) | 40,226 |
| Remaining exons | 5649 (2.3%) | 10,047 (4.1%) | 35,845 (14.8%) | 190,754 (78.7%) | 242,295 |
| Introns | 122,441 (3.9%) | 199,976 (6.3%) | 566,193 (17.9%) | 2,267,569 (71.8%) | 3,156,179 |
Sites are binned into four levels of methylation: 0–25%, 25–50%, 50–75%, and 75–100%
There were also differences in CpG methylation patterns among gene features. Promoters (0 to − 1000 bp from the transcription start site or TSS) and first exons displayed a bimodal pattern of DNA methylation (Fig. 5C, D; Table 9), with a higher proportion of CpGs with 0–25% methylation (including unmethylated CpGs) and a lower proportion of CpGs with 75–100% methylation when compared to gene bodies, remaining exons, and introns (Fig. 5B, E, F; Table 9). That is, promoters and first exons displayed more variation in methylation levels and were less methylated on average than other exons and introns.
To test whether there was any relationship between CpG methylation and gene expression, genes expressed at a detectable level in turtle ventricles were divided into deciles based on expression levels with the first decile containing genes that displayed the lowest expression and the tenth decile containing genes that displayed the highest expression. There was a positive correlation between CpG methylation in gene bodies and expression levels (Fig. 5G). In contrast, CpG methylation in promoters and first exons was negatively correlated with gene expression (Fig. 5H, I). Remaining exons and introns displayed a positive correlation between CpG methylation and gene expression (Fig. 5J, K).
CpG methylation levels were plotted as a function of distance from TSSs to examine the methylation landscape of promoters at a finer spatial scale. Genes were divided into quintiles based on expression levels with the first quintile containing genes with the lowest expression and the fifth quintile containing genes with the highest expression. There was a clear negative correlation between methylation and gene expression levels (Fig. 6A). Genes in the first expression quintile exhibited slightly higher CpG methylation near the TSS vs. neighboring sites (i.e., a hill). In contrast, genes in the second through fifth expression quintiles exhibited progressively lower CpG methylation near the TSS (i.e., greater depth of the methylation valley with increasing expression). This valley spanned from roughly 1500 bp upstream to 1500 bp downstream of the TSS (Fig. 6A). A scatterplot of methylation levels for individual CpGs for genes in the fifth quintile showed a clear bimodal pattern centered on the TSS (i.e., most sites displaying 0% or 100% methylation) (Fig. 6B). This analysis demonstrated an inverse relationship between CpG methylation and gene expression: higher methylation at TSSs was associated with lower gene expression, while lower methylation at TSSs was associated with higher expression at a genome-wide scale.
Fig. 6.
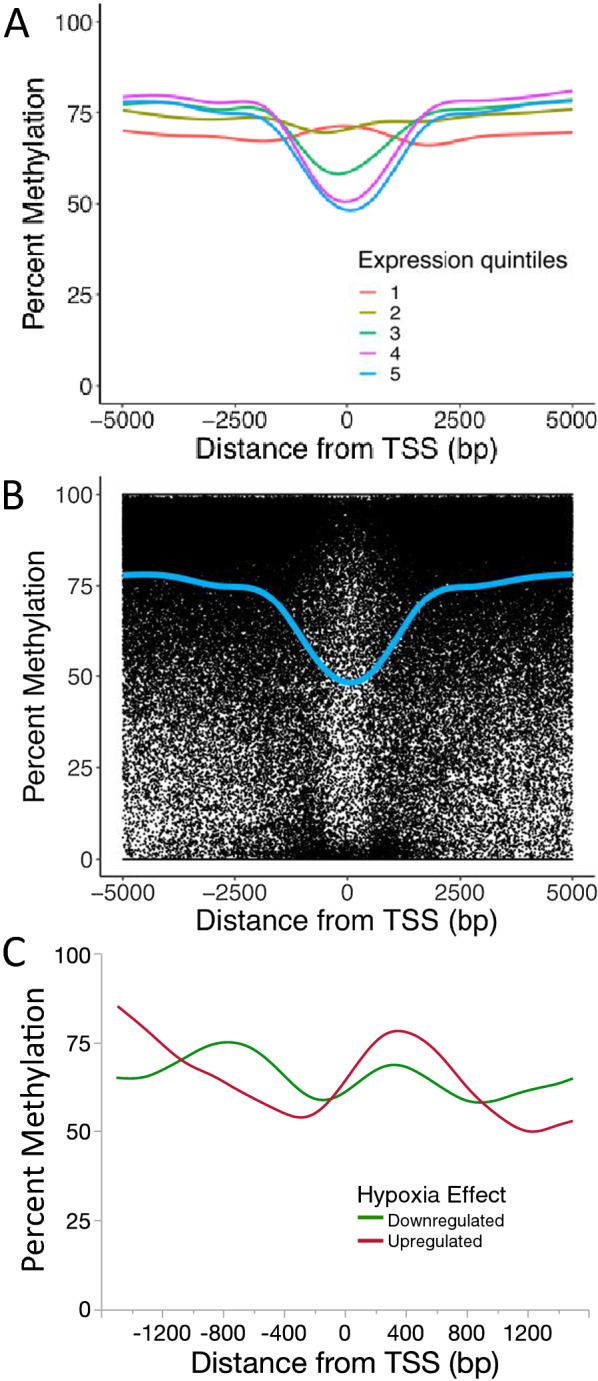
CpG methylation levels around TSSs as a function of gene expression level in ventricles of juvenile snapping turtles. A Genes were divided into expression quintiles with the lowest expressed genes in the first quintile and the highest expressed genes in the fifth quintile. Methylation level for each quintile was plotted as a function of the distance from the TSS. Lines were produced via LOESS curve fitting. B Scatter plot showing methylation level for each CpG as a function distance from the TSS for genes in the fifth quintile. The blue line is the same LOESS smoothed curve as shown in the previous panel. C CpG methylation level around TSSs for genes that were differentially expressed in ventricles of 9-month-old snapping turtles that had been incubated in normoxic (N21) or hypoxic (H10) conditions as embryos. Methylation levels are shown for genes that were up-regulated (red line) or down-regulated (green line) in hypoxic turtles compared to normoxic turtles
Embryonic hypoxia programs genome-wide patterns of CpG and CpG island methylation
Given that CpG methylation patterns were broadly correlated with gene expression in turtle hearts, fetal programming of DNA methylation could be driving hypoxia-induced differences in gene expression and physiology. The first step toward testing this hypothesis is to determine whether embryonic exposure to hypoxia caused differential DNA methylation. CpGs and CGIs were examined separately, because methylation patterns in mammals differ between isolated CpGs (heavily methylated) vs. CGIs (lightly methylated), as does the relationship of CpG and CGI methylation to gene expression.
Comparison of N21 and H10 groups revealed 74,016 differentially methylated CpGs out of 10,808,104 CpGs with sufficient coverage for analysis and difference > 25% and q < 0.01. Hypoxic conditions during embryogenesis induced hypermethylation of 38,428 CpGs and hypomethylation of 35,588 CpGs. Intergenic regions were not more or less likely to contain differentially methylated CpGs than expected by chance (Odds Ratio = 1.014, 95% CI = 0.999 to 1.029; Fisher’s Exact p = 0.066). However, differentially methylated CpGs were more likely to be found in promoters than expected by chance (Odds Ratio = 1.148, 95% CI = 1.057 to 1.245; Fisher’s Exact p = 0.001). In contrast, differentially methylated CpGs were less likely to be found in first exons (Odds Ratio = 0.707, 95% CI = 0.613 to 0.811; Fisher’s Exact p = 2e−07) or the remaining exons (Odds Ratio = 0.510, 95% CI = 0.481 to 0.541; Fisher’s Exact p = 2e−16).
Comparison of N21 and H10 groups revealed 6,666 differentially methylated CGIs (FDR < 0.05). Hypoxic conditions during embryogenesis induced hypermethylation of 3628 CGIs and hypomethylation of 3038 CGIs. Intergenic regions were more likely to contain differentially methylated CGIs than expected by chance (Odds Ratio = 1.136, 95% CI = 1.078 to 1.197; Fisher’s Exact p = 1.33e−6). In contrast, differentially methylated CGIs were less likely to be found in promoters than expected by chance (Odds Ratio = 0.738, 95% CI = 0.596 to 0.907; Fisher’s Exact p = 0.003). Although not statistically significant, a trend toward fewer differentially methylated CGIs was also observed in first exons (Odds Ratio = 0.815, 95% CI = 0.654 to 1.006; Fisher’s Exact p = 0.06) and the remaining exons (Odds Ratio = 0.847, 95% CI = 0.702 to 1.016; Fisher’s Exact p = 0.07).
Functional enrichment among differentially methylated genes
For GO analysis, differentially methylated genes (n = 1582) were defined as those containing ≥ 1 differentially methylated region (methylKit 200 bp sliding window with 50 bp steps) within their promoter (− 1000 bp from TSS) and/or gene body at a q < 0.001 (Additional file 1: Table S1). Differentially methylated genes were significantly enriched for numerous GO terms at a Bonferroni corrected p < 0.05 (Fig. 7). Eighteen terms were significant for GO Biological Process, including six GO terms that might be related to differences in the autonomic nervous system and bradycardia between N21 and H10 groups (Fig. 7; Additional file 2: Table S2). Among these, the highest level terms include “regulation of trans-synaptic signaling”, “regulation of nervous system development”, and “regulation of neuron differentiation” (Fig. 7; Additional file 2: Table S2). Thirty-one GO terms were significant for GO Cellular Component (Fig. 7; Additional file 2: Table S2). Several of these terms were also related to neuronal function, while other terms were related to cation channels that could play a role in positive ionotropic responses in the H10 group. Finally, GO Molecular Function contained 10 terms that complement GO Biological Process and Cellular Component terms (Fig. 7; Additional file 2: Table S2).
Fig. 7.

Gene Ontology terms significantly enriched among genes that were differentially methylated in ventricles from juvenile snapping turtles that had been incubated in normoxic or hypoxic conditions as embryos. Enrichment analysis was carried out on 1582 genes that were affected by oxygen concentration during embryogenesis. The number of genes for each GO term is represented by the size of the circle, while the FDR adjusted p value is shown by the color of the circle
Correlation between hypoxia-induced DNA methylation and gene expression patterns
Having demonstrated that embryonic exposure to hypoxic conditions programmed differential methylation of CpGs and CGIs in juvenile turtle hearts, it was possible to test for relationships to hypoxia-induced differences in gene expression. Genes containing at least one differentially methylated region (as defined in the previous paragraph) were more likely to be differentially expressed than expected by chance (Odds Ratio = 1.558, 95% CI = 1.178 to 2.059; Fisher’s Exact p = 0.002). Genes that were both differentially methylated and differentially expressed between the N21 and H10 groups are listed in Table 10. Given the negative correlation between CpG methylation in promoters and gene expression (Fig. 5H) and the clear methylation signal centered on TSSs (Fig. 6A), finer scale CpG methylation patterns were examined for genes that were differentially expressed between the H10 and N21 groups at 9 months of age. Genes that were up-regulated and down-regulated by hypoxic incubation exhibited spatially distinct methylation patterns, particularly in the − 200 to − 1000 bp region of promoters (Fig. 6C). Although differences were not as stark as observed at a genome-wide scale, there was higher methylation in this region for genes that were downregulated by hypoxic incubation and lower methylation for upregulated genes. Taken together, these findings suggest that hypoxia-induced differences in CpG methylation in promoters and/or gene bodies contribute to hypoxia-induced differences in gene expression.
Table 10.
Genes that were both differentially methylated and differentially expressed between ventricles from snapping turtles that were exposed to normoxia (N21) or hypoxia (H10) during embryonic development
| locus_number | gene_symbol | gene_name |
|---|---|---|
| CS000003610 | STK32A | Serine/threonine kinase 32A |
| CS000001243 | MBP | Myelin basic protein |
| CS000013998 | PNPLA7 | Patatin like phospholipase domain containing 7 |
| CS000014058 | COL18A1 | Collagen, type XVIII, alpha 1 |
| CS000013081 | PRDM8 | PR/SET domain 8 |
| CS000013911 | ||
| CS000014425 | BRAF | B-Raf proto-oncogene, serine/threonine kinase |
| CS000014649 | HN1 | Hematological and neurological expressed 1 |
| CS000008916 | TMEM214 | Transmembrane protein 214 |
| CS000003393 | AGAP1 | ArfGAP with GTPase domain, ankyrin repeat and PH domain 1 |
| CS000005022 | DNAJC11 | DnaJ heat shock protein family (Hsp40) member C11 |
| CS000004897 | TMEM237 | Transmembrane protein 237 |
| CS000002385 | ARHGAP32 | Rho GTPase-activating protein 32 |
| CS000002394 | NTM | Neurotrimin |
| CS000012858 | SOCS2 | Suppressor of cytokine signaling 2 |
| CS000008411 | ITGA11 | Integrin subunit alpha 11 |
| CS000008476 | GRB10 | Growth factor receptor bound protein 10 |
| CS000013316 | KIAA0368 | KIAA0368 |
| CS000012086 | Actin, aortic smooth muscle-like | |
| CS000012122 | Astacin-like metalloendopeptidase | |
| CS000001723 | ATM | ATM serine/threonine kinase |
| CS000008885 | NEDD9 | Neural precursor cell expressed, developmentally down-regulated 9 |
| CS000018434 | ||
| CS000006802 | SORCS1 | Sortilin related VPS10 domain containing receptor 1 |
| CS000018642 | HABP2 | Hyaluronan-binding protein 2 |
| CS000006855 | Transforming acidic coiled-coil-containing protein 2 | |
| CS000011540 | VWA3A | von Willebrand factor A domain containing 3A |
| CS000018526 | MOSMO | Modulator of smoothened protein |
| CS000011558 | TMC5 | Transmembrane channel like 5 |
| CS000025151 | JARID2 | Jumonji and AT-rich interaction domain containing 2 |
| CS000019009 | THSD7A | Thrombospondin type 1 domain containing 7A |
| CS000019311 | PRKCA | Protein kinase C alpha |
| CS000003093 | CDH13 | Cadherin 13 |
| CS000019541 | Chromosome 21 orf 58 | |
| CS000004780 | APBA1 | Amyloid beta precursor protein-binding family A member 1 |
| CS000002168 | FGFR3 | Fibroblast growth factor receptor 3 |
| CS000002632 | CSRP3 | Cysteine and glycine rich protein 3 |
| CS000002650 | Doublecortin domain containing 1 | |
| CS000021269 | NELL1 | Neural EGFL like 1 |
| CS000002886 | COL15A1 | Collagen type XV alpha 1 chain |
| CS000009633 | ALCAM | Activated leukocyte cell adhesion molecule |
| CS000009656 | COL8A1 | Collagen type VIII alpha 1 chain |
| CS000004132 | LDLRAD4 | Low density lipoprotein receptor class A domain containing 4 |
| CS000023075 | CD109 | CD109 molecule |
| CS000022474 | Dedicator of cytokinesis 2 | |
| CS000009979 | CRIM1 | Cysteine rich transmembrane BMP regulator 1 |
| CS000000757 | TDRP | Testis development related protein |
| CS000012971 | NDNF | Neuron derived neurotrophic factor |
| CS000003458 | SMARCAD1 | SWI/SNF-related, matrix-associated actin-dependent regulator of chromatin, subfamily a, containing DEAD/H box 1 |
| CS000003463 | ADH4 | Alcohol dehydrogenase 4 (class II), pi polypeptide |
| CS000003466 | TRMT10A | tRNA methyltransferase 10A |
| CS000004598 | ||
| CS000004600 | ||
| CS000008823 | NCOA2 | Nuclear receptor coactivator 2 |
| CS000023885 | FHOD3 | Formin homology 2 domain containing 3 |
| CS000024095 | SNTB1 | Syntrophin beta 1 |
| CS000024278 | RALYL | RALY RNA-binding protein-like |
| CS000024331 | CERS4 | Ceramide synthase 4 |
| CS000012404 |
Distal regulatory elements such as enhancers and silencers are another important factor driving gene expression patterns. Recent work in mammals has shown that orphan CGIs can act as enhancers. It is, therefore, possible that differential methylation of “CGI enhancers” could influence gene expression patterns in the snapping turtle. As a preliminary test of this hypothesis, we identified the closest gene to the 6666 differentially methylated CGIs described above. There were 4379 protein-coding genes near these sites. We then tested whether these genes were more or less likely to be differentially expressed between N21 and H10 groups. Genes closest to differentially methylated CGIs were less likely to be differentially expressed than expected by chance (Odds Ratio = 0.732, 95% CI = 0.578 to 0.927; Fisher’s Exact p = 0.005). Long-distance enhancer–promoter interactions that skip over the closest gene may explain this result (see discussion for in-depth consideration of this idea).
Putative cis-regulatory sequences for fetal programming of DNA methylation
HOMER2 was used to identify cis-regulatory elements that could be directing differential DNA methylation and/or differential gene expression between N21 and H10 groups. Proximal promoters (− 1000 bp to TSS) of the 443 differentially expressed genes were retrieved from the snapping turtle genome and analyzed for known and de novo sequence motifs. Known motifs for androgen response elements and glucocorticoid response elements were found in promoters at a higher frequency than expected by chance, but were not significant after FDR correction. Thirty-three (33) de novo sequence motifs were enriched in promoters (Additional file 3: Table S3). As expected for promoters, HOMER2 identified TATA boxes and downstream core elements (DCEs), which are recognized by TATA-binding protein and TFIID, respectively, at TSSs. The two highest scoring de novo motifs, which exceeded a stringent cutoff of 1e−10, were similar to sequences bound by transcription factors ZNF711 and RREB1. Several de novo sequence motifs are recognized by transcription factors (CEBPB, KLF10, MEIS1, RREB1, and RXRA) known to bind methylated DNA in mammals [29].
Given that CGIs can act as enhancers in other species, it is possible that differential methylation of CGIs could modulate their activity as enhancers in turtles. HOMER2 was, therefore, used to identify motifs within the 6,666 differentially methylated CGIs. A total of 42 known sequence motifs were enriched in differentially methylated CGIs with an FDR < 0.005 (Additional file 4: Table S4). Three transcription factors that bind to these motifs play a central role in mediating the effects of hypoxia on gene expression: i.e., HIF1A, ARNT (encodes Hif1-beta), and EPAS1 (encodes Hif2-alpha)-binding sites were all enriched in differentially methylated CGIs. Several transcription factors (CUX2, GABPA, GSC, PHOX2B, SMAD4, and ZEB2) that bind to enriched sequence motifs are associated with human syndromes that exhibit cardiovascular, mitochondrial, or autonomic nervous system defects (Additional file 4: Table S4). Several transcription factors (CRX, ZBTB33, SMAD4) are also known to bind methylated sites [29].
Discussion
The present study provides the first ever genome-wide analysis of DNA methylation patterns in a reptile and gives a detailed characterization of the methylation landscape across the snapping turtle genome. In addition, we show that developmental hypoxia is a potent environmental stimulus that alters snapping turtle DNA methylation patterns, which are associated with changes in gene expression and improved performance of the cardiovascular system during anoxia. Surprisingly, juvenile turtles from hypoxic incubations were able to maintain cardiac pumping capacity throughout 2 h of anoxia at 30 °C, which is a feat unsurpassed among vertebrates. To understand the molecular mechanisms underlying programmed differences in cardiac physiology, we carried out WGBS and RNA-Seq studies in ventricular tissue from the H10 and N21 cohorts. Developmental hypoxia programmed genome-wide methylation patterns at CpGs and CGIs. Furthermore, DNA methylation patterns were broadly correlated with gene expression at a genome-wide scale as well as for genes that were differentially expressed between normoxic and hypoxic turtles. Finally, we identified enriched DNA sequence motifs (i.e., putative TF-binding sites) in promoters of differentially expressed genes and in differentially methylated CGIs. By integrating this information, we develop a hypothetical model that links hypoxia during embryogenesis to persistent changes in DNA methylation and gene expression that are related to programmed differences in cardiomyocyte and cardiac physiology.
Effects of developmental hypoxia on the cardiovascular response to anoxia and reoxygenation
Similar to previous in situ [45] and in vivo [44] studies on turtles, acute anoxic exposure had negative chronotropic and inotropic effects in the N21 cohort. At the end of acute anoxia, systemic and pulmonary blood flow (, and ) in N21 turtles was significantly reduced by 51% and 44%, respectively, leading to an increase in the R–L shunt. The reduction in total blood flow () in the N21 cohort was achieved by a pronounced bradycardia, while stroke volume () remained unchanged, indicating a reduction in cardiac inotropy (contractility). These results align with previous work that demonstrates vagally mediated bradycardia in anoxic turtles at 21–25 °C [44, 46] as well as negative inotropy driven by intracellular acidosis, a reduction in calcium uptake, and energy depletion [20, 47]. Reduced cardiac activity during anoxia is characteristic of turtles and serves to lower ATP demand below the capacity for anaerobic ATP supply to restore energy balance [48]. Indeed, cardiac power output remained relatively stable during anoxia, indicating that ATP supply and demand were matched [48].
In contrast to the N21 cohort, H10 turtles maintained systemic and pulmonary blood flow (, and ,) throughout the anoxic period. Maintenance of total blood flow () was supported by a blunted bradycardia and an increase in stroke volumes ( and ), while ventricular pressure and cardiac power output stayed constant. Surprisingly, in contrast to previous in vivo and in situ studies of anoxia-tolerant turtles (Trachemys scripta and Chrysemys picta) [44, 49, 50], 2 h of anoxia in H10 snapping turtles led to an increase in total blood flow () and maintenance of cardiac pumping capacity. These findings are remarkable when considering the 30 °C body temperature of turtles in the current study compared to prior studies of animals held at 22 °C [44, 49, 50]. The only other vertebrate known to increase total blood flow () and maintain pumping capacity during anoxia is the crucian carp, Carassius carassius, a species that can survive anoxia for months while remaining active [51]. Nevertheless, the crucian carp study was performed at 8 °C, which would significantly reduce ATP demand. To our knowledge, cardiac performance of H10 turtles during 2 h of anoxia is unsurpassed among vertebrates.
Similar to other studies [47, 52, 53], anoxic N21 and H10 snapping turtle hearts recovered full functionality when normoxia was restored. This rare adaptation is noteworthy, because atrial reoxygenation is nearly instantaneous in turtles [54], which could theoretically expose the heart to oxidative damage through the overproduction of reactive oxygen species (ROS). Although ROS are key signalling molecules and an inevitable product of electron transport, they can also be harmful by causing lipid peroxidation, protein and DNA damage, and apoptosis [55]. In mammals, ROS production during reperfusion is a major cause of ischemia/reperfusion injury [56]. In contrast, turtles fully recover contractile function after several hours of anoxia without any conspicuous injury [47, 57, 58]. The lack of reoxygenation injury in turtle hearts has been attributed to the maintenance of an ATP/ADP pool and low succinate accumulation, which reduces the likelihood of superoxide production [59]. Interestingly, we recently found that ROS production after anoxia was significantly lower in H10 vs. N21 snapping turtle cardiomyocytes [20], which may help to explain why H10 turtles in the present study could maintain higher levels of cardiac performance during reoxygenation (Fig. 1).
Effects of developmental hypoxia on cardiovascular regulatory mechanisms
Drawing from previous literature, we can make some inferences about the physiological and molecular mechanisms underlying differences in cardiac performance between H10 and N21 turtles. The H10 group had a blunted anoxic bradycardia compared to the N21 cohort, suggesting differences exist in factors that regulate heart rate, including local control mechanisms and/or intrinsic pacemaker properties. Acute anoxic bradycardia in warm turtles is mostly vagally mediated, but intrinsic pacemaker rate is also reduced by chronotropic extracellular factors such as acidosis, hyperkalemia, hypercalcemia, or adrenaline levels [46, 60]. Thus, developmental hypoxia could reduce the anoxia sensitivity of any of these pathways, leading to blunted anoxic bradycardia. Interestingly, H10 embryos are tachycardic when measured in normoxia and compared with N21 embryos. This is due to a blunted cholinergic tone, but the heart rate response to hypoxia was similar between groups [61]. We recently showed intracellular pH in anoxic snapping turtle cardiomyocytes is similar between N21 and H10 cohorts, but it is possible that extracellular pH, K+, Ca2+, or adrenaline levels differ, which could affect intrinsic pacemaker rate [60].
Enrichment analysis of differentially methylated genes in the current study revealed groups of genes that are functionally related to intrinsic pacemaker mechanisms, including GO terms “potassium channel complex,” “cation channel complex,” “transmembrane transporter complex,” and “ion channel complex.” We confirmed differential expression of one candidate from this category: sodium voltage-gated channel alpha subunit 5 (SCN5A) was up-regulated in hearts of 9-month-old turtles exposed to hypoxia as embryos. SCN5A mediates voltage-dependent sodium ion permeability of excitable membranes and inactivation of this channel is regulated by intracellular calcium. Knockout of SCN5A in mice results in embryonic lethality, with major defects in ventricular morphology [62]. More significantly, heterozygotes with one good copy of SCN5A survive, but display defects in atrioventricular and intramyocardial conduction, increased ventricular refractoriness, and tachycardia. Thus, elevated SCN5A expression could have the opposite effect and contribute to the higher heart rate of turtles from hypoxic incubations when exposed to acute anoxia.
Likewise, differentially methylated genes were enriched for genes that could alter autonomic control of heart rate, including GO Biological Process terms for “regulation of trans-synaptic signaling,” “regulation of nervous system development,” and “regulation of neuron differentiation,” and GO Cellular Component terms such as “synapse,” “glutamatergic synapse,” and “postsynaptic membrane.” In line with these observations, analysis of differentially methylated CGIs (i.e., potential enhancers) revealed significant enrichment of binding sites for Paired-Like Homeobox 2B (PHOX2B). This gene is intriguing, because it plays a key role in the formation of autonomic reflex pathways, including those controlling baroreflexes [63]. Mutation of PHOX2B in humans causes congenital central hypoventilation syndrome, which has cardiac arrhythmia as one of its incompletely penetrant symptoms [64]. Previous work has shown that hypoxic incubation alters α-adrenergic regulation of heart rate, β-adrenergic regulation of blood pressure, and influences expression of α- and β-adrenoreceptors in snapping turtle embryos [12]. Those findings point to hypoxic programming of the autonomic nervous system and/or tissue responsiveness to sympathoadrenal regulation. Further work is needed to identify mechanisms underlying the contribution of parasympathetic and sympathetic branches to the blunted bradycardic response in H10 turtles.
In addition to differences in the heart rate response to anoxia between experimental groups, anoxia led to an increase in cardiac inotropy in the H10 cohort, while this parameter was decreased in the N21 cohort. These results reflect the finding that N21 cardiomyocyte contractility remains depressed throughout 20 min of anoxia, while H10 contractility rebounds to pre-anoxic levels [20]. Improved anoxia tolerance of H10 cardiomyocytes was supported by enhanced myofilament calcium sensitivity and a superior ability to suppress ROS production [20]. Therefore, the increase in stroke volume observed in anoxic H10 turtles might be partly driven by intrinsic regulation of calcium and ROS. In support of this idea, we confirmed differential expression of peptidylprolyl isomerase A (PPIA) between N21 and H10 turtles. Secretion of this protein occurs in response to oxidative stress and plays a role in mediating Angiotensin II effects on cardiomyocyte hypertrophy by potentiating ROS production [65].
Enrichment analysis of differentially expressed genes in the current study identified other genes that might contribute more directly to positive inotropy in vivo and enhanced cardiomyocyte contractility in vitro: relevant GO Biological Process terms included “sarcomere organization” and “signal transduction,” as well as GO Cellular Component terms “z-disc” and “collagen trimer.” We confirmed differential expression of two candidate genes in this category: troponin T2, cardiac type (TNNT2) and tropomyosin 3 (TPM3) were both elevated in hearts of turtles exposed to hypoxia as embryos. Together, these proteins regulate calcium-dependent contraction of myofilaments. Increased TNNT2 and TPM3 expression could, therefore, cause differences in calcium sensitivity of cardiomyocytes in vitro [20] and contribute to the physiological differences observed in vivo in the present study.
Developmental hypoxia programs genome-wide DNA methylation and gene expression patterns
While examples of individual candidate genes discussed above are interesting, our study provides the first ever genome-wide analysis of DNA methylation and gene expression patterns in a reptile. WGBS allowed us to characterize the methylation landscape across the snapping turtle genome in unprecedented detail. Promoters and first exons displayed a bimodal pattern of CpG methylation, while other genome features displayed a unimodal distribution. CpGs were more highly methylated in genes than intergenic regions, which displayed a broader range of methylation levels. We also observed genome-wide correlations between CpG methylation and gene expression in the snapping turtle that are consistent with correlations observed in mammals, anuran amphibians, and fish [66]. In particular, methylation levels in promoters and first exons were negatively correlated with mRNA expression, whereas methylation in the remaining exons and introns was positively correlated with mRNA expression. Finer scale spatial analysis of CpG methylation across proximal promoters and the 5′ end of genes revealed a clear signature: higher methylation at TSSs was associated with lower expression, while lower methylation at TSSs was associated with higher expression (Fig. 5). These findings indicate DNA methylation near promoters plays a conserved role in repression of gene expression in turtles. The discovery of a positive correlation between methylation in gene bodies and gene expression in turtles is also observed in other vertebrate lineages [66]. It has been suggested that this positive correlation is a secondary effect of the greater accessibility of more highly transcribed genes to DNA methylating enzymes [67]. Together, these observations are significant, because DNA methylation is absent (or minimal) and plays no role in regulating gene expression in some model organisms [68, 69].
We also found that exposure to hypoxic conditions during embryogenesis programmed DNA methylation patterns and that methylation of CpGs vs. CGIs varied among genomic features. Intergenic regions, where enhancers and silencers are located, were enriched for differentially methylated CGIs but not for individual CpGs. If orphan CGIs in turtles act as enhancers, as suggested by recent studies in mammals [34–36], differential methylation of these sites might play an outsized role in driving differences in gene expression patterns between N21 and H10 turtles. In contrast to intergenic regions, promoters were less likely to contain differentially methylated CGIs but were enriched for differentially methylated CpGs. These findings are consistent with the observation that CGIs in promoters are usually unmethylated in mammals [37]. Finally, we found that exons displayed less differential methylation than expected by chance for both CpGs and CGIs. Overall, we detected significant relationships between hypoxia-induced DNA methylation, gene expression patterns, and cardiovascular physiology later in life, though links for individual gene are not linear and will require substantial experimental work to elucidate.
Nonetheless, we were able to gain insight into potential regulatory mechanisms through the identification of enriched sequence motifs (i.e., putative TF-binding sites) in promoters of differentially expressed genes. For instance, glucocorticoid response elements were enriched in proximal promoters of genes that were differentially expressed between ventricles of snapping turtles from hypoxic vs. normoxic incubations. Work in mammals shows that glucocorticoids play a role in maturation of the cardiovascular system during late gestation, including effects on peripheral resistance, blood pressure, and heart rate that protect against acute hypoxia in embryos [70]. Reciprocal interactions between hypoxia and glucocorticoids have also been observed: fetal hypoxia programs differential methylation and expression of the glucocorticoid receptor gene in rat hearts [71]. Although we did not detect differential methylation or expression of the glucocorticoid receptor gene in the snapping turtle, a potential link between hypoxia-induced differential gene expression and signaling via glucocorticoid response elements deserves further study. Perhaps there are programmed differences in the function of the hypothalamic–pituitary–adrenal axis between N21 and H10 turtles, as observed in adult rats exposed to intermittent hypoxia during the postnatal period [72].
Another proximal cis-regulatory element might play a major role in driving differential gene expression between hearts of N21 and H10 turtles. Promoters were enriched for sequence motifs recognized by Ras Responsive Element-Binding Protein 1 (RREB1). Mutations in RREB1 in humans cause Noonan-spectrum disorders, which are recapitulated in Rreb1 hemizygous mice [73]. Mice with one functional copy of Rreb1 exhibit cardiac hypertrophy and sensitization of cardiomyocytes to MAPK signaling. Interestingly, “signal transduction” was an over-represented GO term among differentially expressed genes, which included MAP3K5 and MAPK9, in turtle hearts. Anastasiadi et al. [66] also found enrichment of RREB1-binding sites in genes (gene body ± 4 kb) that display tissue-specific differential methylation. The observation that RREB1 is a methyl-CpG-binding TF suggests it may play a broader role in regulating differential gene expression in a DNA methylation-dependent manner [29].
We also identified sequence motifs that were significantly enriched within differentially methylated CGIs. We hypothesize these putative TF-binding sites are involved in the initial programming of differential DNA methylation of specific CGIs during embryogenesis as well as causing differential expression of target genes and differences in cardiovascular physiology later in life. Future studies using promoter capture HiC or HiCap could be used to test whether differentially methylated CGIs physically interact with promoters of differentially expressed genes [74, 75], as predicted by our model. However, it is not a straightforward task to link putative enhancers to their target promoters, because enhancers can act at distances of tens to hundreds of thousands of bases via DNA looping and skip over other promoters [74–76]. Those studies report that only a portion of enhancers (47% to 65%) physically interact with the nearest active TSS. Thus, the closest gene may not always be the target for putative “CGI enhancers” in the snapping turtle. This could explain why genes closest to differentially methylated CGIs were less likely rather than more likely to be differentially expressed in the snapping turtle. Another potential explanation is that the current version of the snapping genome is a scaffold level assembly. A fragmented genome could hamper our ability to physically associate differentially methylated CGIs with their closest targets.
Examination of transcription factors that bind enriched motifs in differentially methylated CGIs lends credence to our hypothesis. All three hypoxia inducible transcription factors (HIF1A, ARNT, and EPAS1) are in the list of enriched motifs and are candidates for programming differential DNA methylation in turtle hearts (Additional file 4: Table S4). Hypoxia can cause global changes in DNA methylation by regulating expression of DNA methyltransferases and ten–eleven translocation (TET) methylcytosine dioxygenases [77–79]. Yet, the hypoxia-induced methylation patterns observed here are specific rather than global and suggest targeting to cis-regulatory elements of genes that are differentially expressed between turtles from hypoxic vs. normoxic incubations. In fact, recent work shows that DNA methylation directly interferes with HIF binding and that cell-type specific methylation patterns determine responsiveness of HIF target genes to acute hypoxia [79]. We suggest an analogous mechanism could underlie programmed differences in DNA methylation and gene expression patterns between N21 and H10 turtles. Activation and binding of HIFs and TFs such as RREB1 and SMADs to specific sites would drive differential methylation of CpGs and CGIs in embryonic hearts. These programmed patterns would then cause differential gene expression and differences in cardiovascular phenotype later in life. Differentially methylated CGIs in turtle ventricles were enriched in binding sites for transcription factors associated with cardiovascular, mitochondrial, or autonomic defects in mammals (e.g., CUX2, GABPA, GSC, PHOX2B, SMAD4, and ZEB2).
SMAD4-binding sites were enriched within differentially methylated CGIs in turtle ventricles. Given that SMAD4 binds methylated sites [29], the intersection of DNA methylation and TGF-β signaling in the turtle heart is particularly intriguing. Indeed, embryonic hypoxia programmed differential expression of BMP10 and BMPR2 in turtle hearts. BMP10 is a key signaling molecule in the developing and mature heart in mammals [80, 81]. BMP10 is a member of the TGF-β protein family and binds to BMPR2 and ALK1 to trigger phosphorylation of SMAD2/3 or SMAD1/5/8, which form complexes with SMAD4. SMAD complexes then translocate to the nucleus to regulate expression of target genes. Signaling via SMAD4 in cardiomyocytes plays a crucial role in regulating sarcomere function, ion-channel gene expression, cardiomyocyte survival, and cardiac function in adult mice [82]. Gain of function mutations in SMAD4 in humans cause Myhre Syndrome with cardiomyopathy [83]. Mutations of BMPR2 in humans and mice also cause cardiovascular phenotypes that are associated with pulmonary arterial hypertension [84, 85]. Hautefort et al. [86] have recently shown that rats heterozygous for a BMPR2 exon deletion display changes in right ventricular cardiomyocyte morphology and physiology, including smaller diameter, decreased calcium sensitivity, and decreased contractility. Thus, hypoxia-induced changes in TGF-β signaling via the BMP10/BMPR2/SMAD4 axis could direct differential DNA methylation during embryogenesis and influence subsequent cardiac physiology in N21 and H10 turtles. In fact, TGF-β-dependent activation and binding of SMADs has been shown to displace the ZNF217/CoREST/DNMT3A complex and cause demethylation of the p15ink4b promoter and induce expression of the p15ink4b gene [87]. There is also potential for crosstalk between TGF-β signaling and MAP kinase signaling, because SMADs and RREB1 (discussed above) have been shown to directly interact to regulate epithelial to mesenchymal transitions and induce fibrosis in myofibroblasts [88].
Conclusion
Overall, our study shows chronic hypoxia during embryogenesis significantly improves cardiac anoxia tolerance in juvenile snapping turtles and that these effects are associated with changes in DNA methylation and gene expression patterns. Our findings also point to specific genes and signaling pathways that may underlie extreme hypoxia/anoxia tolerance in the snapping turtle. Based on these findings, we propose a model in which hypoxia during embryogenesis activates hypoxia inducible factors (HIF1A, ARNT, and EPAS1) and other key TFs (e.g., RREB1 and SMAD4), which interact with specific-binding sites to direct (or inhibit) methylation of nearby CpGs and CGIs (Fig. 8). Hypoxia-induced DNA methylation patterns would then be passed down through cell divisions and maintained in later life (i.e., they are programmed). Differential methylation of CpGs and CGIs would modulate promoter/enhancer/silencer activity, chromatin structure, and influence gene expression by affecting binding of the same transcription factors (e.g., HIFs, RREB1, and SMAD4) later in life. This, in turn, would drive differences in cardiomyocyte and cardiac physiology. It is important to point out that these findings are correlative and that further research will be required to test the hypothesized mechanisms. There are limitations in the approaches that can be used in turtles. Genetic approaches such as gene knockouts and transgenics are not yet feasible with turtles. However, potential experimental approaches include primary cell culture of cardiomyocytes. An in vitro system would be amenable to pharmacological manipulations of the signaling pathways identified here. Mechanisms could also be studied by transient transfection of expression vectors with candidate genes from this study and/or knockdown of genes with siRNA or lentiviral vectors carrying shRNA.
Fig. 8.

Hypothetical model for developmental programming of DNA methylation and gene patterns by hypoxic incubation. Exposure to low oxygen during embryogenesis activates HIFs and other transcription factors (TFs), which bind to specific sites in the genome of developing cardiomyocytes. These factors recruit DNMTs and TET in a locus specific manner to methylate and demethylate adjacent CpGs, respectively. DNA methylation patterns in CpGs and CGIs are inherited mitotically and influence gene expression patterns later in life
The physiological significance of these findings also awaits further research. On one hand, increasing cardiac output during acute anoxia might be beneficial for breath-hold dives when snapping turtles are foraging. During overwintering periods, this increased capacity, combined with the low ambient water temperature, could allow the animals to sustain activity if needed. However, this strategy could become risky for longer periods of anoxia if ATP turnover is elevated and glycogen reserves become limited. In this regard, it would be interesting to measure levels of lactate production in anoxic H10 turtles to assess ATP turnover rate.
Methods
Turtle collection, incubation, and husbandry
Common snapping turtle (Chelydra serpentina) eggs were collected from the wild in Minnesota, USA, and transported to the University of North Texas, TX, USA, for incubation. Permission to collect the eggs was granted to DA Crossley by the Minnesota Department of Natural Resources (permit no. 21232). On arrival two eggs from individual clutches were staged to establish embryonic age. Eggs were embedded to their midpoint in vermiculite, inside plastic boxes (2.5-L Ziploc® containers, SC Johnson, Racine, WI, USA) that were placed inside large (75.7 L) sealable plastic bags (Ziploc®). All incubation conditions were carried out in a walk-in environmental control room (model IR-912L5; Percival Scientific, Perry, IA, USA). The vermiculate was mixed in a 1:1 ratio with water, as previously described [89]. Incubation lasted no more than 55 days and all eggs were maintained at 30 °C, a female-determining temperature [61].
At approximately 20% of development (9–12 days after laying; determined by embryonic staging), eggs were randomly assigned to either normoxic/atmospheric oxygen (21% O2; designated as N21) or hypoxic (10% O2; designated as H10) cohorts for the remainder of embryonic development. To achieve the desired oxygen level, parallel gas inflow and outflow tubes were attached to the large Ziploc® bags and O2 gas mixtures were set at a flow rate of 2–3 L min−1 using rotameters (Sho-Rate Brooks Instruments Division, Hatfield, PA, USA) downstream of either compressed N2/air mixture or air alone. The gas mixtures passed through an H2O bubbler to ensure 80–95% relative humidity and their compositions were monitored continuously with an oxygen analyser (S-3AI; AEI Technologies, Pittsburgh, PA, USA).
Upon hatching, all turtles were housed in common, normoxic (21% O2) conditions at 26 °C, in separate normoxic and hypoxic groups. Turtles were fed ad libitum, with dry turtle food (Mazuri, PMI Nutrition International, Brentwood, MO, USA) 2–4 times weekly and kept in a daily 12:12 light–dark cycle until experimentation (up to 1.5 years).
In situ turtle cardiac anoxia tolerance
Size- and clutch-matched turtles from each developmental cohort were studied 1.5 years after hatching (N = 6 and 5, for N21 and H10, respectively). Turtle body and heart masses are provided in Table 1. Prior to experimentation, turtles were anaesthetized in a sealed box containing cotton gauze saturated in isoflurane (Isoflo®, Abbott Laboratories, North Chicago, IL, USA). Once pedal and eye reflexes were absent, turtles were removed from the box, placed ventral-side up and intubated with flexible Tygon® tubing that was inserted into the trachea via the glottis. A ventilator (model 683, Harvard Apparatus, Holliston, MA, USA) and vaporizer (FluTec vaporizer, FluTec, Ohmeda, OH, USA) provided mechanical ventilation with 3% isofluorane, at a rate of 3–4 breaths min−1 and tidal volume of 20 mL kg−1. A gas-mixer (GF-3mp, Cameron Instrument Company, Port Aransas, TX, USA) was connected to the ventilator and controlled the composition of gases.
A square cut (4 cm2) was made in the plastron directly over the heart to expose the major cardiac outflow vessels and pericardium. Major arteries were isolated from surrounding tissue by blunt dissection for placement of the blood-flow probes (Transonic Systems, Ithica, NY, USA). One probe (3- or 4-mm diameter) was used to measure blood flow in the right aorta, both subclavian arteries, and the right carotid collectively. Separate probes were used to measure blood flow in the left aortic, left carotid artery (both 1–2 mm), and the left pulmonary artery (1.5–2.5 mm). Each flow probe was calibrated at 30 °C, with an infusion syringe pump (PHD 2000, Harvard Apparatus, USA). The flow probes were connected to two T206 blood-flow meters (Transonic Systems Ithica, NY, USA). To measure ventricular pressure, a small hole was made in the apex of the heart using a 22-gauge needle and a pressure catheter (size 1.4 F, model SPR-671, Millar Instruments, Houston, TX, USA) was inserted into the lumen of the heart. The catheter was connected to an amplifier (MPVS-300, Millar Instruments) which was calibrated daily against a static column of water, using a two-point calibration (0 and 1 kPa). The outputs from the flowmeters and pressure amplifier were connected to a PowerLab® 8/35 data-recording system (ADInstruments, Colorado Springs, CO, USA) and recorded on a computer, with LabChart Pro® software (v8.2, ADInstruments), and data were recorded at 100 Hz.
After the flow probes and catheters were placed, isofluorane was reduced to 1–1.5%, ventilation was raised to 10–11 breaths min−1, and cardiovascular variables were left to stabilize for at least 30 min before the experimental protocol commenced. The experiment was designed to measure cardiac function during three distinct periods: 10 min of normoxia (21% O2, 3% CO2, and 76% N2), 120 min of anoxia (3% CO2 and 97% N2), and 30 min of reoxygenation (21% O2, 3% CO2, and 76% N2). The ventilated gas mixture was regularly checked with oxygen and carbon-dioxide analyzers (model S-3A/I and CD-3A, respectively, Ametek, Berwyn, PA, USA). All studies were carried out according to an approved animal-care protocol of the University of North Texas Institutional Animal Care and Use Committee (no. 1403-04).
Mean blood-flow (Q̇) values were calculated from the average of 5-min data periods throughout the experimental protocol. Total systemic blood flow (Q̇Sys) was calculated as the sum of flow from the right and left aortas, subclavian arteries, and carotid arteries, whereas total pulmonary blood flow (Q̇Pul) was calculated as 2× the flow of the left pulmonary artery, assuming that flows through the left and right pulmonary arteries are identical. Total cardiac output (Q̇Tot) was calculated as the sum of Q̇Sys and Q̇Pul. Total, systemic, and pulmonary stroke volumes (, , and , respectively) were calculated using the following equation:
| 1 |
where Q̇Tot, Q̇Sys, and Q̇Pul, were used to find , , and , respectively.
Net and fractional shunts were calculated using Eqs. 2 and 3, respectively, to assess the distribution of blood flow between the pulmonary and systemic circulations:
| 2 |
| 3 |
Mean ventricular pressure () was calculated using the following equation:
| 4 |
where are systolic and diastolic pressure, respectively.
Finally, cardiac power output (PO) was calculated using the following equation:
| 5 |
where .
Transcriptome analysis of hearts exposed to developmental hypoxia
RNA-Sequencing (RNA-Seq) was carried out to measure steady state differences in cardiac gene expression between juvenile turtles exposed to normoxic or hypoxic conditions during embryogenesis. Normoxic and hypoxic groups included 7-month-old (n = 5) and 9-month-old turtles (n = 3), for a fully factorial design (total n = 16). The hypoxic group included equal numbers of turtles with normal-sized (n = 4) and enlarged hearts (n = 4) relative to their body size.
Hearts were dissected from turtles and weighed. Atria and ventricles were separated, placed in microfuge tubes, snap frozen in liquid nitrogen, and stored at − 80 °C. Total RNA was isolated from ventricles by grinding frozen tissue with a mortar and pestle on dry ice. Frozen, pulverized tissue was transferred to a tube containing Trizol and homogenized for another 30 s using a BioGen PRO200 homogenizer with a 5 mm generator probe. Remaining steps were carried out according to the manufacturer’s protocol. The only modification was 2 additional extractions with 500 µL of chloroform to remove phenol traces from the aqueous phase prior to RNA precipitation. RNA quality was high with RINs ranging from 8.4 to 9.1 and no indication of genomic DNA contamination when assessed on agarose gels or via qPCR (no amplification).
Total RNA was used as input for the NEB PolyA nondirectional library preparation kit. Barcoded cDNA libraries with 250–300 bp insert sizes were sequenced on Illumina HiSeq system (150 bp, paired end reads) by Novogene. One set of 6 samples was sequenced to a depth of 29 to 33 million raw reads (forward + reverse), while a second set of 10 samples was sequenced to a depth of 65 to 150 million raw reads (forward + reverse) (Additional file 5: Table S5). The first 11 bp of reads were cropped and low-quality bases trimmed (sliding window of 4 bp and average Q score ≥ 15) with a minimum read length of 30 bp using Trimmomatic [90]. Reads were mapped to the snapping turtle genome [91] using HISAT2 with default parameters [92]. featureCounts [93] was used to extract read counts from BAM files for subsequent gene expression analyses.
DESeq2 was used to screen for differences in gene expression [94]. Oxygen concentration, age, and the oxygen concentration by age interaction were independent factors in a general linear model with a genewise P < 0.01. The distribution of FPKMs were manually examined to identify differences driven by outliers. Two-way ANOVAs were then carried out on FPKMs for each gene identified by DESeq2 to ensure differences were significant using two different statistical models. DESeq2 uses a hierarchical model with likelihood ratio tests and shrinks estimates of dispersion by assuming genes with similar expression values display similar variance. In contrast, ANOVA employs ordinary least squares with F tests that use empirically derived variance estimates for each gene. Genes were excluded from the final list of differentially expressed genes when an outlier drove a significant effect or when DESeq2 and two-way ANOVA results were not concordant (i.e., differences were not robust to the statistical model). Gene expression was also compared between normal-sized hearts (n = 12) vs. enlarged hearts (n = 4) with an FDR adjusted p value < 0.1. The final set of differentially expressed genes included those affected by oxygen concentration, the oxygen concentration by age interaction, and the genes that differed between normal-sized (both N21 and H10) vs. enlarged hearts (H10). Genes that only changed with age were not analyzed any further, because the long-term effect of hypoxia was the primary focus of this study.
Validation of differential gene expression in hearts exposed to developmental hypoxia
qPCR was used to measure gene expression in a larger set of samples from the same experiment that produced animals for the RNA-Seq study (i.e., 13 normoxic hearts and 12 hypoxic hearts; 20 normal-sized hearts and 5 enlarged hearts). Total RNA was extracted as described above. Reverse transcription and absolute qPCR with rigorous standard curves were carried out as previously described [61, 95]. Expression of CACNA2D1, CNP, and YTHDF3 were not affected by any independent variables so these genes were used as controls. The first component from a principal components analysis of these genes was used as a covariate for analysis of the remaining genes. This covariate serves as a control for variation in the quality of input RNA and the efficiency of reverse transcription reactions (i.e., such as a housekeeping gene).
Methylome analysis of hearts exposed to developmental hypoxia
Turtles exposed to normoxic (n = 3) or hypoxic conditions (n = 3) during embryogenesis were used for WGBS. DNA was extracted from frozen, pulverized ventricles of the same 9-month-old turtles used for the RNA-Seq study. DNA was extracted using the DNeasy Blood and Tissue kit from Qiagen. Agarose gel electrophoresis of DNA revealed high molecular weight DNA (> 60 kb) with no RNA contamination. Six μg of DNA was shipped to Novogene for WGBS. Libraries were prepared with 200–400 bp insert sizes. Bisulfite (BS) conversion was carried out with the EZ DNA Methylation Gold Kit from ZymoResearch. Libraries were sequenced on a NovaSeq 6000 instrument. QC analysis of raw reads showed BS conversion rate was greater than 99.9% for all libraries and coverage ranged from 32.9× to 37.6× (Additional file 6: Table S6).
Trimmomatic was used to remove TruSeq3 PE adapters, trim 3 bp from the 5′ and 3′ ends, and trim low-quality bases (sliding window of 4 bp and average Q score ≥ 15) with a minimum read length of 36 bp [90]. Reads were mapped to the snapping turtle genome using the Bismark bisulfite read mapper [96]. Mapping statistics for each library are summarized in Additional file 7: Table S7. Average mapping efficiency was 79.2%, which is excellent for WGBS data [97]. As expected, methylated cytosines were primarily found in the context of CpG dinucleotides (75%). Few methylated cytosines were found in the context of CHG (0.2%) or CHH (0.2%) trinucleotides, where H is any base except G. Approximately 3.4% of methylated cytosines were in an unknown context.
methylKit was used to call methylated CpGs and determine whether methylation levels were significantly different between N21 and H10 groups [98]. A minimum coverage of 10 in two of three replicates was required for statistical comparison. Differences between N21 and H10 groups were called significant for individual CpGs if the difference in methylation was > 25% and q < 0.01 (q is the FDR adjusted p value).
We used the newcpgreport tool (https://www.bioinformatics.nl/cgi-bin/emboss/newcpgreport) to call CGIs in the snapping turtle genome using default parameters: Obs/Exp > 0.6, %C + %G > 50, and length > 200 bp. We identified 201,828 CGIs in the snapping turtle genome which is less than the 307,193 CGIs in the human genome with the same parameters [37]. When corrected for genome size, however, the frequency of CGIs is similar at 89,383 CGIs/Gb in the snapping turtle and 93,089 CGIs/Gb in humans. Overall methylation of CGIs was calculated as the sum of methylated CpGs divided by the total number of CpGs within an island, which is essentially the average % methylation across the island. Comparisons between N21 and H10 groups were made using the Fisher Exact test and q < 0.05.
Statistical analyses
Data were analyzed for statistical significance by a mixed-effects, generalized linear model (GLM), using Šidák post-hoc corrections for pairwise comparisons, with SPSS 25 (IBM, Armonk, NY, USA). For the GLMs, developmental oxygen (normoxia or hypoxia), acute oxygen treatment (normoxia, anoxia, or reoxygenation), and time were the independent variables and cardiovascular variables were the dependent variables. Significance was accepted when p ≤ 0.05. All data are reported as means ± standard error (SEM). GOATOOLS [99] was used to test for functional enrichment of gene ontology (GO) terms among differentially expressed genes from the RNA-Seq study and differentially methylated genes from the WGBS study. Genes identified in those experiments were compared to a species-specific list of GO terms generated by Das et al. [91].
Supplementary Information
Additional file 1: Table S1. Genes that were differentially methylated between ventricles from 9-month-old snapping turtles that were exposed to normoxia (N21) or hypoxia (H10) during embryonic development. Genes were classified as differentially methylated when they contained ≥ 1 differentially methylated region within their promoter and/or gene body at a q < 0.001.
Additional file 2: Table S2. Gene Ontology categories and terms that were significantly enriched among 1582 genes that were differentially methylated in ventricles from 9-month-old snapping turtles exposed to normoxia (N21) or hypoxia (H10) during embryonic development. GO terms were considered significant at a Bonferroni corrected p ≤ 0.05.
Additional file 3: Table S3. Results of HOMER2 de novo motif enrichment analysis of promoters from 443 genes that were affected by oxygen concentration during embryogenesis (Table 2), the oxygen concentration by age interaction (Table 3), and/or those genes that differed between ventricles from turtles that had normal-sized vs. enlarged hearts relative to their body size (Table 4).
Additional file 4: Table S4. Results of HOMER2 motif enrichment analysis of 6666 CpG islands that were differentially methylated in ventricles from 9-month-old snapping turtles exposed to normoxia (N21) or hypoxia (H10) during embryonic development. The 6666 CpG islands were compared to 1,065,536 background sequences from the snapping turtle genome.
Additional file 5: Table S5. Summary of RNA-Seq data from ventricles of juvenile snapping turtles exposed to normoxia (N21) or hypoxia (H10) during embryonic development and sampled at 7 months or 9 months of age.
Additional file 6: Table S6. Summary of WGBS data from ventricles of juvenile snapping turtles exposed to normoxia (N21) or hypoxia (H10) during embryonic development and sampled at 9 months of age.
Additional file 7: Table S7. Summary of mapping statistics for WGBS libraries from ventricles of juvenile snapping turtles exposed to normoxia (N21) or hypoxia (H10) during embryonic development and sampled at 9 months of age.
Acknowledgements
We thank Archana Dhasarathy, Sergei Nechaev, and Motoki Takaku for providing helpful feedback on the manuscript. We also wish to thank the Minnesota Department of Natural Resources for providing special permits for collection of snapping turtle eggs.
Authors’ contributions
GLJG, TR and DAC conceived the studies, designed and supervised the experiments, supervised and/or carried out data analyses. IR, GLJG, and TR wrote the manuscript. All authors read, edited and approved the final manuscript. IR carried out, analyzed, and made figures for the physiological studies. TR extracted DNA and RNA for bisulfite sequencing and RNA-Seq studies. JB, DD, SKS, and SM carried out the bioinformatics analyses and JB made figures for the bisulfite sequencing and RNA-Seq studies.
Funding
This study was funded by a New Investigator Grant awarded to G.L.J.G. by the Biotechnology and Biological Sciences Research Council (BBSRC grant no. BB/N005740/1), and Company of Biologists travelling fellowship awarded to I.M.R. This work was also supported by the National Science Foundation of the United States (grant numbers IOS-1755187 to DACII and IOS-1755282 to TR). This work was also supported by the Pilot Postdoctoral Program at the University of North Dakota.
Availability of data and materials
The datasets during and/or analysed during the current study available from the corresponding author on reasonable request.
Declarations
Competing interests
The authors declare they have no competing interests.
Footnotes
Publisher's Note
Springer Nature remains neutral with regard to jurisdictional claims in published maps and institutional affiliations.
Contributor Information
Ilan Ruhr, Email: ilan.ruhr@manchester.ac.uk.
Jacob Bierstedt, Email: jacob.bierstedt@und.edu.
Turk Rhen, Email: turk.rhen@und.edu.
Debojyoti Das, Email: debojyotidas007@gmail.com.
Sunil Kumar Singh, Email: sunil.singh@und.edu.
Soleille Miller, Email: soleille.miller@und.edu.
Dane A. Crossley, II, Email: dane.crossley@unt.edu.
Gina L. J. Galli, Email: gina.galli@manchester.ac.uk
References
- 1.West-Eberhard M. Developmental plasticity and evolution. Oxford: Oxford University Press; 2003. [Google Scholar]
- 2.Bateson P, Gluckman P, Hanson M. The biology of developmental plasticity and the predictive adaptive response hypothesis. J Physiol. 2014;592:2357–2368. doi: 10.1113/jphysiol.2014.271460. [DOI] [PMC free article] [PubMed] [Google Scholar]
- 3.Vickers MH. Early life nutrition, epigenetics and programming of later life disease. Nutrients. 2014;6:2165–2178. doi: 10.3390/nu6062165. [DOI] [PMC free article] [PubMed] [Google Scholar]
- 4.Langley-Evans SC. Developmental programming of health and disease. Proc Nutr Soc. 2006;65:97–105. doi: 10.1079/PNS2005478. [DOI] [PMC free article] [PubMed] [Google Scholar]
- 5.Wu RSS. Chapter 3 Effects of hypoxia on fish reproduction and development. In: Richards JG, Farrell AP, Brauner CJ, editors. Fish physiology. Cambridge: Academic Press; 2009. pp. 79–141. [Google Scholar]
- 6.Nechaeva MV. Physiological responses to acute changes in temperature and oxygenation in bird and reptile embryos. Respir Physiol Neurobiol. 2011;178:108–117. doi: 10.1016/j.resp.2011.04.003. [DOI] [PubMed] [Google Scholar]
- 7.Packard GC, Tracy CR, Roth JJ. The physiological ecology of reptilian eggs and embryos. And the evolution of viviparity within the class reptilia. Biol Rev. 1977;52:71–105. doi: 10.1111/j.1469-185X.1977.tb01346.x. [DOI] [PubMed] [Google Scholar]
- 8.Ackerman RA, Lott DB. Thermal, hydric, and respiratory climate of nests. In: Deeming DC, editor. Reptilian incubation: environment, evolution, and behaviour. Nottingham: Nottingham University Press; 2004. pp. 15–43. [Google Scholar]
- 9.Booth DT. The effect of hypoxia on oxygen consumption of embryonic estuarine crocodiles (Crocodylus porosus) J Herpetol. 2000;34:478–481. doi: 10.2307/1565377. [DOI] [Google Scholar]
- 10.Ackerman R, Lott D. Thermal, hydric, and respiratory climate of nests. In: Deeming DC, editor. Reptilian incubation: environment, evolution and behaviour. Nottingham: Nottingham University Press; 2004. pp. 15–43. [Google Scholar]
- 11.Eme J, Rhen T, Crossley D., II Adjustments in cholinergic, adrenergic and purinergic control of cardiovascular function in snapping turtle embryos (Chelydra serpentina) incubated in chronic hypoxia. J Comp Physiol B. 2014;184:891–902. doi: 10.1007/s00360-014-0848-6. [DOI] [PubMed] [Google Scholar]
- 12.Eme J, Rhen T, Tate KB, Gruchalla K, Kohl ZF, Slay CE, Crossley DA. Plasticity of cardiovascular function in snapping turtle embryos (Chelydra serpentina): chronic hypoxia alters autonomic regulation and gene expression. Am J Physiol Regul Integr Comp Physiol. 2013;304(11):R966–R979. doi: 10.1152/ajpregu.00595.2012. [DOI] [PubMed] [Google Scholar]
- 13.Tate KB, Kohl ZF, Eme J, Rhen T, CrossleyIi DA. Critical windows of cardiovascular susceptibility to developmental hypoxia in common snapping turtle (Chelydra serpentina) embryos. Physiol Biochem Zool. 2015;88:103–115. doi: 10.1086/677683. [DOI] [PubMed] [Google Scholar]
- 14.Wearing OH, Conner J, Nelson D, Crossley J, Crossley DA., II Embryonic hypoxia programmes postprandial cardiovascular function in adult common snapping turtles (Chelydra serpentina) J Exp Biol. 2017;220:2589–2597. doi: 10.1242/jeb.160549. [DOI] [PubMed] [Google Scholar]
- 15.Wearing OH, Eme J, Rhen T, Crossley DA., 2nd Phenotypic plasticity in the common snapping turtle (Chelydra serpentina): long-term physiological effects of chronic hypoxia during embryonic development. Am J Physiol Regul Integr Comp Physiol. 2016;310:R176–R184. doi: 10.1152/ajpregu.00293.2015. [DOI] [PubMed] [Google Scholar]
- 16.Crossley DA, 2nd, Altimiras J. Cardiovascular development in embryos of the American alligator Alligator mississippiensis: effects of chronic and acute hypoxia. J Exp Biol. 2005;208:31–39. doi: 10.1242/jeb.01355. [DOI] [PubMed] [Google Scholar]
- 17.Eme J, Altimiras J, Hicks JW, Crossley Ii DA. Hypoxic alligator embryos: chronic hypoxia, catecholamine levels and autonomic responses of in ovo alligators. Comp Biochem Physiol A Mol Integr Physiol. 2011;160:412–420. doi: 10.1016/j.cbpa.2011.07.010. [DOI] [PubMed] [Google Scholar]
- 18.Smith B, Crossley JL, Elsey RM, Hicks JW, Crossley DA., 2nd Embryonic developmental oxygen preconditions cardiovascular functional response to acute hypoxic exposure and maximal β-adrenergic stimulation of anesthetized juvenile American alligators (Alligator mississippiensis) J Exp Biol. 2019;222:jeb205419. doi: 10.1242/jeb.205419. [DOI] [PubMed] [Google Scholar]
- 19.Tate KB, Rhen T, Eme J, Kohl ZF, Crossley J, Elsey RM, Crossley DA., 2nd Periods of cardiovascular susceptibility to hypoxia in embryonic American alligators (Alligator mississippiensis) Am J Physiol Regul Integr Comp Physiol. 2016;310:R1267–R1278. doi: 10.1152/ajpregu.00320.2015. [DOI] [PMC free article] [PubMed] [Google Scholar]
- 20.Ruhr IM, McCourty H, Bajjig A, Crossley DA, 2nd, Shiels HA, Galli GLJ. Developmental plasticity of cardiac anoxia-tolerance in juvenile common snapping turtles (Chelydra serpentina) Proc Biol Sci. 2019;286:20191072–20191072. doi: 10.1098/rspb.2019.1072. [DOI] [PMC free article] [PubMed] [Google Scholar]
- 21.Jackson DC. Living without oxygen: lessons from the freshwater turtle. Comp Biochem Physiol A Mol Integr Physiol. 2000;125:299–315. doi: 10.1016/S1095-6433(00)00160-4. [DOI] [PubMed] [Google Scholar]
- 22.Jackson DC, Ultsch GR. Physiology of hibernation under the ice by turtles and frogs. J Exp Zool A Ecol Genet Physiol. 2010;313:311–327. doi: 10.1002/jez.603. [DOI] [PubMed] [Google Scholar]
- 23.Bickler PE, Buck LT. Hypoxia tolerance in reptiles, amphibians, and fishes: life with variable oxygen availability. Annu Rev Physiol. 2007;69:145–170. doi: 10.1146/annurev.physiol.69.031905.162529. [DOI] [PubMed] [Google Scholar]
- 24.Stecyk JAW, Galli GL, Shiels HA, Farrell AP. Cardiac survival in anoxia-tolerant vertebrates: an electrophysiological perspective. Comp Biochem Physiol C Toxicol Pharmacol. 2008;148:339. doi: 10.1016/j.cbpc.2008.05.016. [DOI] [PubMed] [Google Scholar]
- 25.Chen T, Dent SY. Chromatin modifiers and remodellers: regulators of cellular differentiation. Nat Rev Genet. 2014;15:93–106. doi: 10.1038/nrg3607. [DOI] [PMC free article] [PubMed] [Google Scholar]
- 26.Canovas S, Ross PJ. Epigenetics in preimplantation mammalian development. Theriogenology. 2016;86:69–79. doi: 10.1016/j.theriogenology.2016.04.020. [DOI] [PMC free article] [PubMed] [Google Scholar]
- 27.Jambhekar A, Dhall A, Shi Y. Roles and regulation of histone methylation in animal development. Nat Rev Mol Cell Biol. 2019;20:625–641. doi: 10.1038/s41580-019-0151-1. [DOI] [PMC free article] [PubMed] [Google Scholar]
- 28.Voigt P, Tee WW, Reinberg D. A double take on bivalent promoters. Genes Dev. 2013;27:1318–1338. doi: 10.1101/gad.219626.113. [DOI] [PMC free article] [PubMed] [Google Scholar]
- 29.Zhu H, Wang G, Qian J. Transcription factors as readers and effectors of DNA methylation. Nat Rev Genet. 2016;17:551–565. doi: 10.1038/nrg.2016.83. [DOI] [PMC free article] [PubMed] [Google Scholar]
- 30.Héberlé E, Bardet AF. Sensitivity of transcription factors to DNA methylation. Essays Biochem. 2019;63:727–741. doi: 10.1042/EBC20190033. [DOI] [PMC free article] [PubMed] [Google Scholar]
- 31.Cedar H, Bergman Y. Linking DNA methylation and histone modification: patterns and paradigms. Nat Rev Genet. 2009;10:295–304. doi: 10.1038/nrg2540. [DOI] [PubMed] [Google Scholar]
- 32.Handy DE, Castro R, Loscalzo J. Epigenetic modifications: basic mechanisms and role in cardiovascular disease. Circulation. 2011;123:2145–2156. doi: 10.1161/CIRCULATIONAHA.110.956839. [DOI] [PMC free article] [PubMed] [Google Scholar]
- 33.Feil R, Fraga MF. Epigenetics and the environment: emerging patterns and implications. Nat Rev Genet. 2012;13:97–109. doi: 10.1038/nrg3142. [DOI] [PubMed] [Google Scholar]
- 34.Bell JSK, Vertino PM. Orphan CpG islands define a novel class of highly active enhancers. Epigenetics. 2017;12:449–464. doi: 10.1080/15592294.2017.1297910. [DOI] [PMC free article] [PubMed] [Google Scholar]
- 35.Doni Jayavelu N, Jajodia A, Mishra A, Hawkins RD. Candidate silencer elements for the human and mouse genomes. Nat Commun. 2020;11:1061. doi: 10.1038/s41467-020-14853-5. [DOI] [PMC free article] [PubMed] [Google Scholar]
- 36.Steinhaus R, Gonzalez T, Seelow D, Robinson PN. Pervasive and CpG-dependent promoter-like characteristics of transcribed enhancers. Nucleic Acids Res. 2020;48:5306–5317. doi: 10.1093/nar/gkaa223. [DOI] [PMC free article] [PubMed] [Google Scholar]
- 37.Illingworth RS, Bird AP. CpG islands—‘a rough guide’. FEBS Lett. 2009;583:1713–1720. doi: 10.1016/j.febslet.2009.04.012. [DOI] [PubMed] [Google Scholar]
- 38.Chen X, Zhang L, Wang C. Prenatal hypoxia-induced epigenomic and transcriptomic reprogramming in rat fetal and adult offspring hearts. Sci Data. 2019;6:238. doi: 10.1038/s41597-019-0253-9. [DOI] [PMC free article] [PubMed] [Google Scholar]
- 39.Huang L, Chen X, Dasgupta C, Chen W, Song R, Wang C, Zhang L. Foetal hypoxia impacts methylome and transcriptome in developmental programming of heart disease. Cardiovasc Res. 2018;115:1306–1319. doi: 10.1093/cvr/cvy277. [DOI] [PMC free article] [PubMed] [Google Scholar]
- 40.Radhakrishnan S, Literman R, Mizoguchi B, Valenzuela N. MeDIP-seq and nCpG analyses illuminate sexually dimorphic methylation of gonadal development genes with high historic methylation in turtle hatchlings with temperature-dependent sex determination. Epigenet Chromatin. 2017;10:28. doi: 10.1186/s13072-017-0136-2. [DOI] [PMC free article] [PubMed] [Google Scholar]
- 41.Elango N, Yi SV. DNA methylation and structural and functional bimodality of vertebrate promoters. Mol Biol Evol. 2008;25:1602–1608. doi: 10.1093/molbev/msn110. [DOI] [PubMed] [Google Scholar]
- 42.Xu J, Liu S, Yin P, Bulun S, Dai Y. MeDEStrand: an improved method to infer genome-wide absolute methylation levels from DNA enrichment data. BMC Bioinform. 2018;19:540. doi: 10.1186/s12859-018-2574-7. [DOI] [PMC free article] [PubMed] [Google Scholar]
- 43.Wang T, Krosniunas EH, Hicks JW. The role of cardiac shunts in the regulation of arterial blood gases. Am Zool. 1997;37:12–22. doi: 10.1093/icb/37.1.12. [DOI] [Google Scholar]
- 44.Hicks JW, Wang T. Cardiovascular regulation during anoxia in the turtle: an in-vivo study. Physiol Zool. 1998;71:1–14. doi: 10.1086/515892. [DOI] [PubMed] [Google Scholar]
- 45.Farrell AP, Franklin CE, Arthur PG, Thorarensen H, Cousins KL. Mechanical performance of an in-situ perfused heart from the turtle, Chrysemys Scripta, during normoxia and anoxia at 5°C and 15°C. J Exp Biol. 1994;191:207–229. doi: 10.1242/jeb.191.1.207. [DOI] [PubMed] [Google Scholar]
- 46.Hicks JM, Farrell AP. The cardiovascular responses of the red-eared slider (Trachemys scripta) acclimated to either 22 or 5°C. II. Effects of anoxia on adrenergic and cholinergic control. J Exp Biol. 2000;203:3775–3784. doi: 10.1242/jeb.203.24.3775. [DOI] [PubMed] [Google Scholar]
- 47.Stecyk JAW, Bock C, Overgaard J, Wang T, Farrell AP, Portner H-O. Correlation of cardiac performance with cellular energetic components in the oxygen-deprived turtle heart. Am J Physiol Regul Integr Comp Physiol. 2009;297:R756–R768. doi: 10.1152/ajpregu.00102.2009. [DOI] [PubMed] [Google Scholar]
- 48.Farrell AP, Stecyk JA. The heart as a working model to explore themes and strategies for anoxic survival in ectothermic vertebrates. Comp Biochem Physiol A Mol Integr Physiol. 2007;147:300–312. doi: 10.1016/j.cbpa.2007.01.021. [DOI] [PubMed] [Google Scholar]
- 49.Hicks JM, Farrell AP. The cardiovascular responses of the red-eared slider (Trachemys scripta) acclimated to either 22 or 5°C. I. Effects of anoxic exposure on in-vivo cardiac performance. J Exp Biol. 2000;203:3765–3774. doi: 10.1242/jeb.203.24.3765. [DOI] [PubMed] [Google Scholar]
- 50.Stecyk JAW, Overgaard J, Farrell AP, Wang T. α-Adrenergic regulation of systemic peripheral resistance and blood flow distribution in the turtle, Trachemys scripta, during anoxic submergence at 5°C and 21°C. J Exp Biol. 2004;207:269–283. doi: 10.1242/jeb.00744. [DOI] [PubMed] [Google Scholar]
- 51.Stecyk JA, Stensløkken KO, Farrell AP, Nilsson GE. Maintained cardiac pumping in anoxic crucian carp. Science. 2004;306:77. doi: 10.1126/science.1100763. [DOI] [PubMed] [Google Scholar]
- 52.Bundgard A, James AM, Joyce W, Murphy MP, Fago A. Suppression of reactive oxygen species generation in heart mitochondria from anoxic turtles: the role of complex I S-nitrosation. J Exp Biol. 2018;221:jeb174391. doi: 10.1242/jeb.174391. [DOI] [PMC free article] [PubMed] [Google Scholar]
- 53.Wasser JS, Inman KC, Arendt EA, Lawler RG, Jackson DC. 31P-NMR measurements of pHi and high-energy phosphates in isolated turtle hearts during anoxia and acidosis. Am J Physiol Regul Integr Comp Physiol. 1990;259:R521–R530. doi: 10.1152/ajpregu.1990.259.3.R521. [DOI] [PubMed] [Google Scholar]
- 54.Ultsch GR, Jackson DC. Long-term submergence at 3°C of the turtle, Chrysemys picta bellii, in normoxic and severely hypoxic water: I. Survival, gas exchange and acid-base status. J Exp Biol. 1982;96:11–28. doi: 10.1242/jeb.96.1.11. [DOI] [PubMed] [Google Scholar]
- 55.Zorov DB, Juhaszova M, Sollott SJ. Mitochondrial reactive oxygen species (ROS) and ROS-induced ROS release. Physiol Rev. 2014;94:909–950. doi: 10.1152/physrev.00026.2013. [DOI] [PMC free article] [PubMed] [Google Scholar]
- 56.Chouchani ET, Pell VR, James AM, Work LM, Saeb-Parsy K, Frezza C, Krieg T, Murphy MP. A unifying mechanism for mitochondrial superoxide production during ischemia–reperfusion injury. Cell Metab. 2016;23:254–263. doi: 10.1016/j.cmet.2015.12.009. [DOI] [PubMed] [Google Scholar]
- 57.Wasser JS, Guthrie SS, Chari M. In vitro tolerance to anoxia and ischemia in isolated hearts from hypoxia sensitive and hypoxia tolerant turtles. Comp Biochem Physiol A Physiol. 1997;118:1359–1370. doi: 10.1016/S0300-9629(97)00248-X. [DOI] [PubMed] [Google Scholar]
- 58.Wasser JS, Inman KC, Arendt EA, Lawler RG, Jackson DC. 31P-NMR measurements of pHi and high-energy phosphates in isolated turtle hearts during anoxia and acidosis. AJP Regul Integr Comp Physiol. 1990;259:R521–R530. doi: 10.1152/ajpregu.1990.259.3.R521. [DOI] [PubMed] [Google Scholar]
- 59.Bundgaard A, James AM, Gruszczyk AV, Martin J, Murphy MP, Fago A. Metabolic adaptations during extreme anoxia in the turtle heart and their implications for ischemia–reperfusion injury. Sci Rep. 2019;9:2850. doi: 10.1038/s41598-019-39836-5. [DOI] [PMC free article] [PubMed] [Google Scholar]
- 60.Stecyk JAW, Farrell AP. Effects of extracellular changes on spontaneous heart rate of normoxia- and anoxia-acclimated turtles (Trachemys scripta) J Exp Biol. 2007;210:421–431. doi: 10.1242/jeb.02653. [DOI] [PubMed] [Google Scholar]
- 61.Eme J, Rhen T, Tate KB, Gruchalla K, Kohl ZF, Slay CE, Crossley DA., II Plasticity of cardiovascular function in snapping turtle embryos (Chelydra serpentina): chronic hypoxia alters autonomic regulation and gene expression. Am J Physiol Regul Integr Comp Physiol. 2013;304:R966–R979. doi: 10.1152/ajpregu.00595.2012. [DOI] [PubMed] [Google Scholar]
- 62.Papadatos GA, Wallerstein PM, Head CE, Ratcliff R, Brady PA, Benndorf K, Saumarez RC, Trezise AE, Huang CL, Vandenberg JI, Colledge WH, Grace AA. Slowed conduction and ventricular tachycardia after targeted disruption of the cardiac sodium channel gene Scn5a. Proc Natl Acad Sci USA. 2002;99:6210–6215. doi: 10.1073/pnas.082121299. [DOI] [PMC free article] [PubMed] [Google Scholar]
- 63.Dauger S, Pattyn A, Lofaso F, Gaultier C, Goridis C, Gallego J, Brunet JF. Phox2b controls the development of peripheral chemoreceptors and afferent visceral pathways. Development. 2003;130:6635–6642. doi: 10.1242/dev.00866. [DOI] [PubMed] [Google Scholar]
- 64.Laifman E, Keens TG, Bar-Cohen Y, Perez IA. Life-threatening cardiac arrhythmias in congenital central hypoventilation syndrome. Eur J Pediatr. 2020;179:821–825. doi: 10.1007/s00431-019-03568-5. [DOI] [PubMed] [Google Scholar]
- 65.Satoh K, Nigro P, Zeidan A, Soe NN, Jaffre F, Oikawa M, O'Dell MR, Cui Z, Menon P, Lu Y, Mohan A, Yan C, Blaxall BC, Berk BC. Cyclophilin A promotes cardiac hypertrophy in apolipoprotein E-deficient mice. Arterioscler Thromb Vasc Biol. 2011;31:1116–1123. doi: 10.1161/ATVBAHA.110.214601. [DOI] [PMC free article] [PubMed] [Google Scholar]
- 66.Anastasiadi D, Esteve-Codina A, Piferrer F. Consistent inverse correlation between DNA methylation of the first intron and gene expression across tissues and species. Epigenet Chromatin. 2018;11:37. doi: 10.1186/s13072-018-0205-1. [DOI] [PMC free article] [PubMed] [Google Scholar]
- 67.Jjingo D, Conley AB, Yi SV, Lunyak VV, Jordan IK. On the presence and role of human gene-body DNA methylation. Oncotarget. 2012;3:462–474. doi: 10.18632/oncotarget.497. [DOI] [PMC free article] [PubMed] [Google Scholar]
- 68.Feng S, Cokus SJ, Zhang X, Chen P-Y, Bostick M, Goll MG, Hetzel J, Jain J, Strauss SH, Halpern ME, Ukomadu C, Sadler KC, Pradhan S, Pellegrini M, Jacobsen SE. Conservation and divergence of methylation patterning in plants and animals. Proc Natl Acad Sci. 2010;107:8689–8694. doi: 10.1073/pnas.1002720107. [DOI] [PMC free article] [PubMed] [Google Scholar]
- 69.Zemach A, McDaniel IE, Silva P, Zilberman D. Genome-wide evolutionary analysis of eukaryotic DNA methylation. Science. 2010;328:916–919. doi: 10.1126/science.1186366. [DOI] [PubMed] [Google Scholar]
- 70.Jellyman JK, Fletcher AJW, Fowden AL, Giussani DA. Glucocorticoid maturation of fetal cardiovascular function. Trends Mol Med. 2020;26:170–184. doi: 10.1016/j.molmed.2019.09.005. [DOI] [PubMed] [Google Scholar]
- 71.Song R, Hu XQ, Zhang L. Glucocorticoids and programming of the microenvironment in heart. J Endocrinol. 2019;242:T121–t133. doi: 10.1530/JOE-18-0672. [DOI] [PMC free article] [PubMed] [Google Scholar]
- 72.Chintamaneni K, Bruder ED, Raff H. Programming of the hypothalamic-pituitary-adrenal axis by neonatal intermittent hypoxia: effects on adult male ACTH and corticosterone responses are stress specific. Endocrinology. 2014;155:1763–1770. doi: 10.1210/en.2013-1736. [DOI] [PubMed] [Google Scholar]
- 73.Kent OA, Saha M, Coyaud E, Burston HE, Law N, Dadson K, Chen S, Laurent EM, St-Germain J, Sun RX, Matsumoto Y, Cowen J, Montgomery-Song A, Brown KR, Ishak C, Rose J, De Carvalho DD, He HH, Raught B, Billia F, Kannu P, Rottapel R. Haploinsufficiency of RREB1 causes a Noonan-like RASopathy via epigenetic reprogramming of RAS-MAPK pathway genes. Nat Commun. 2020;11:4673. doi: 10.1038/s41467-020-18483-9. [DOI] [PMC free article] [PubMed] [Google Scholar]
- 74.Mifsud B, Tavares-Cadete F, Young AN, Sugar R, Schoenfelder S, Ferreira L, Wingett SW, Andrews S, Grey W, Ewels PA, Herman B, Happe S, Higgs A, LeProust E, Follows GA, Fraser P, Luscombe NM, Osborne CS. Mapping long-range promoter contacts in human cells with high-resolution capture Hi-C. Nat Genet. 2015;47:598–606. doi: 10.1038/ng.3286. [DOI] [PubMed] [Google Scholar]
- 75.Sahlén P, Abdullayev I, Ramsköld D, Matskova L, Rilakovic N, Lötstedt B, Albert TJ, Lundeberg J, Sandberg R. Genome-wide mapping of promoter-anchored interactions with close to single-enhancer resolution. Genome Biol. 2015;16:156. doi: 10.1186/s13059-015-0727-9. [DOI] [PMC free article] [PubMed] [Google Scholar]
- 76.Sanyal A, Lajoie BR, Jain G, Dekker J. The long-range interaction landscape of gene promoters. Nature. 2012;489:109–113. doi: 10.1038/nature11279. [DOI] [PMC free article] [PubMed] [Google Scholar]
- 77.Watson CJ, Collier P, Tea I, Neary R, Watson JA, Robinson C, Phelan D, Ledwidge MT, McDonald KM, McCann A, Sharaf O, Baugh JA. Hypoxia-induced epigenetic modifications are associated with cardiac tissue fibrosis and the development of a myofibroblast-like phenotype. Hum Mol Genet. 2014;23:2176–2188. doi: 10.1093/hmg/ddt614. [DOI] [PubMed] [Google Scholar]
- 78.Choudhry H, Harris AL. Advances in hypoxia-inducible factor biology. Cell Metab. 2018;27:281–298. doi: 10.1016/j.cmet.2017.10.005. [DOI] [PubMed] [Google Scholar]
- 79.D'Anna F, Van Dyck L, Xiong J, Zhao H, Berrens RV, Qian J, Bieniasz-Krzywiec P, Chandra V, Schoonjans L, Matthews J, De Smedt J, Minnoye L, Amorim R, Khorasanizadeh S, Yu Q, Zhao L, De Borre M, Savvides SN, Simon MC, Carmeliet P, Reik W, Rastinejad F, Mazzone M, Thienpont B, Lambrechts D. DNA methylation repels binding of hypoxia-inducible transcription factors to maintain tumor immunotolerance. Genome Biol. 2020;21:182. doi: 10.1186/s13059-020-02087-z. [DOI] [PMC free article] [PubMed] [Google Scholar]
- 80.Chen H, Shi S, Acosta L, Li W, Lu J, Bao S, Chen Z, Yang Z, Schneider MD, Chien KR, Conway SJ, Yoder MC, Haneline LS, Franco D, Shou W. BMP10 is essential for maintaining cardiac growth during murine cardiogenesis. Development. 2004;131:2219–2231. doi: 10.1242/dev.01094. [DOI] [PMC free article] [PubMed] [Google Scholar]
- 81.Sun L, Yu J, Qi S, Hao Y, Liu Y, Li Z. Bone morphogenetic protein-10 induces cardiomyocyte proliferation and improves cardiac function after myocardial infarction. J Cell Biochem. 2014;115:1868–1876. doi: 10.1002/jcb.24856. [DOI] [PubMed] [Google Scholar]
- 82.Umbarkar P, Singh AP, Gupte M, Verma VK, Galindo CL, Guo Y, Zhang Q, McNamara JW, Force T, Lal H. Cardiomyocyte SMAD4-dependent TGF-β signaling is essential to maintain adult heart homeostasis. JACC Basic Transl Sci. 2019;4:41–53. doi: 10.1016/j.jacbts.2018.10.003. [DOI] [PMC free article] [PubMed] [Google Scholar]
- 83.Lin AE, Michot C, Cormier-Daire V, L'Ecuyer TJ, Matherne GP, Barnes BH, Humberson JB, Edmondson AC, Zackai E, O'Connor MJ, Kaplan JD, Ebeid MR, Krier J, Krieg E, Ghoshhajra B, Lindsay ME. Gain-of-function mutations in SMAD4 cause a distinctive repertoire of cardiovascular phenotypes in patients with Myhre syndrome. Am J Med Genet A. 2016;170:2617–2631. doi: 10.1002/ajmg.a.37739. [DOI] [PubMed] [Google Scholar]
- 84.Roberts KE, McElroy JJ, Wong WP, Yen E, Widlitz A, Barst RJ, Knowles JA, Morse JH. BMPR2 mutations in pulmonary arterial hypertension with congenital heart disease. Eur Respir J. 2004;24:371–374. doi: 10.1183/09031936.04.00018604. [DOI] [PubMed] [Google Scholar]
- 85.Song Y, Jones JE, Beppu H, Keaney JF, Jr, Loscalzo J, Zhang YY. Increased susceptibility to pulmonary hypertension in heterozygous BMPR2-mutant mice. Circulation. 2005;112:553–562. doi: 10.1161/CIRCULATIONAHA.104.492488. [DOI] [PMC free article] [PubMed] [Google Scholar]
- 86.Hautefort A, Mendes-Ferreira P, Sabourin J, Manaud G, Bertero T, Rucker-Martin C, Riou M, Adão R, Manoury B, Lambert M, Boet A, Lecerf F, Domergue V, Brás-Silva C, Gomez AM, Montani D, Girerd B, Humbert M, Antigny F, Perros F. Bmpr2 mutant rats develop pulmonary and cardiac characteristics of pulmonary arterial hypertension. Circulation. 2019;139:932–948. doi: 10.1161/CIRCULATIONAHA.118.033744. [DOI] [PubMed] [Google Scholar]
- 87.Thillainadesan G, Chitilian JM, Isovic M, Ablack JN, Mymryk JS, Tini M, Torchia J. TGF-β-dependent active demethylation and expression of the p15ink4b tumor suppressor are impaired by the ZNF217/CoREST complex. Mol Cell. 2012;46:636–649. doi: 10.1016/j.molcel.2012.03.027. [DOI] [PubMed] [Google Scholar]
- 88.Su J, Morgani SM, David CJ, Wang Q, Er EE, Huang YH, Basnet H, Zou Y, Shu W, Soni RK, Hendrickson RC, Hadjantonakis AK, Massagué J. TGF-β orchestrates fibrogenic and developmental EMTs via the RAS effector RREB1. Nature. 2020;577:566–571. doi: 10.1038/s41586-019-1897-5. [DOI] [PMC free article] [PubMed] [Google Scholar]
- 89.Crossley DA, II, Altimiras J. Cardiovascular development in embryos of the American alligator, Alligator mississippiensis: effects of chronic and acute hypoxia. J Exp Biol. 2005;208:31–39. doi: 10.1242/jeb.01355. [DOI] [PubMed] [Google Scholar]
- 90.Bolger AM, Lohse M, Usadel B. Trimmomatic: a flexible trimmer for Illumina sequence data. Bioinformatics. 2014;30:2114–2120. doi: 10.1093/bioinformatics/btu170. [DOI] [PMC free article] [PubMed] [Google Scholar]
- 91.Das D, Singh SK, Bierstedt J, Erickson A, Galli GLJ, Crossley DA, II, Rhen T. Draft genome of the common snapping turtle, Chelydra serpentina, a model for phenotypic plasticity in reptiles. G3. 2020;10:4299–4314. doi: 10.1534/g3.120.401440. [DOI] [PMC free article] [PubMed] [Google Scholar]
- 92.Kim D, Paggi JM, Park C, Bennett C, Salzberg SL. Graph-based genome alignment and genotyping with HISAT2 and HISAT-genotype. Nat Biotechnol. 2019;37:907–915. doi: 10.1038/s41587-019-0201-4. [DOI] [PMC free article] [PubMed] [Google Scholar]
- 93.Liao Y, Smyth GK, Shi W. featureCounts: an efficient general purpose program for assigning sequence reads to genomic features. Bioinformatics. 2014;30:923–930. doi: 10.1093/bioinformatics/btt656. [DOI] [PubMed] [Google Scholar]
- 94.Love MI, Huber W, Anders S. Moderated estimation of fold change and dispersion for RNA-seq data with DESeq2. Genome Biol. 2014;15:550. doi: 10.1186/s13059-014-0550-8. [DOI] [PMC free article] [PubMed] [Google Scholar]
- 95.Rhen T, Metzger K, Schroeder A, Woodward R. Expression of putative sex-determining genes during the thermosensitive period of gonad development in the snapping turtle, Chelydra serpentina. Sex Dev. 2007;1:255–270. doi: 10.1159/000104775. [DOI] [PubMed] [Google Scholar]
- 96.Krueger F, Andrews SR. Bismark: a flexible aligner and methylation caller for Bisulfite-Seq applications. Bioinformatics. 2011;27:1571–1572. doi: 10.1093/bioinformatics/btr167. [DOI] [PMC free article] [PubMed] [Google Scholar]
- 97.Tran H, Porter J, Sun MA, Xie H, Zhang L. Objective and comprehensive evaluation of bisulfite short read mapping tools. Adv Bioinform. 2014;2014:472045. doi: 10.1155/2014/472045. [DOI] [PMC free article] [PubMed] [Google Scholar]
- 98.Akalin A, Kormaksson M, Li S, Garrett-Bakelman FE, Figueroa ME, Melnick A, Mason CE. methylKit: a comprehensive R package for the analysis of genome-wide DNA methylation profiles. Genome Biol. 2012;13:R87. doi: 10.1186/gb-2012-13-10-r87. [DOI] [PMC free article] [PubMed] [Google Scholar]
- 99.Klopfenstein DV, Zhang L, Pedersen BS, Ramirez F, Warwick Vesztrocy A, Naldi A, Mungall CJ, Yunes JM, Botvinnik O, Weigel M, Dampier W, Dessimoz C, Flick P, Tang H. GOATOOLS: a python library for gene ontology analyses. Sci Rep. 2018;8:10872. doi: 10.1038/s41598-018-28948-z. [DOI] [PMC free article] [PubMed] [Google Scholar]
Associated Data
This section collects any data citations, data availability statements, or supplementary materials included in this article.
Supplementary Materials
Additional file 1: Table S1. Genes that were differentially methylated between ventricles from 9-month-old snapping turtles that were exposed to normoxia (N21) or hypoxia (H10) during embryonic development. Genes were classified as differentially methylated when they contained ≥ 1 differentially methylated region within their promoter and/or gene body at a q < 0.001.
Additional file 2: Table S2. Gene Ontology categories and terms that were significantly enriched among 1582 genes that were differentially methylated in ventricles from 9-month-old snapping turtles exposed to normoxia (N21) or hypoxia (H10) during embryonic development. GO terms were considered significant at a Bonferroni corrected p ≤ 0.05.
Additional file 3: Table S3. Results of HOMER2 de novo motif enrichment analysis of promoters from 443 genes that were affected by oxygen concentration during embryogenesis (Table 2), the oxygen concentration by age interaction (Table 3), and/or those genes that differed between ventricles from turtles that had normal-sized vs. enlarged hearts relative to their body size (Table 4).
Additional file 4: Table S4. Results of HOMER2 motif enrichment analysis of 6666 CpG islands that were differentially methylated in ventricles from 9-month-old snapping turtles exposed to normoxia (N21) or hypoxia (H10) during embryonic development. The 6666 CpG islands were compared to 1,065,536 background sequences from the snapping turtle genome.
Additional file 5: Table S5. Summary of RNA-Seq data from ventricles of juvenile snapping turtles exposed to normoxia (N21) or hypoxia (H10) during embryonic development and sampled at 7 months or 9 months of age.
Additional file 6: Table S6. Summary of WGBS data from ventricles of juvenile snapping turtles exposed to normoxia (N21) or hypoxia (H10) during embryonic development and sampled at 9 months of age.
Additional file 7: Table S7. Summary of mapping statistics for WGBS libraries from ventricles of juvenile snapping turtles exposed to normoxia (N21) or hypoxia (H10) during embryonic development and sampled at 9 months of age.
Data Availability Statement
The datasets during and/or analysed during the current study available from the corresponding author on reasonable request.