

Abstract
Aim
This study aims to analyse the epidemiological and clinical features of the patients admitted to the hospital with the prediagnosis of coronavirus disease 19 (COVID‐19) in Turkey.
Materials and methods
In this retrospective study, epidemiological and clinical features, laboratory markers, radiological features, therapeutic approaches, and survival conditions of the patients with the prediagnosis of COVID‐19 from March 11th to June 30th, 2020 have been analysed and reported. The data of the cases were divided into four groups and then compared with each other: first group includes confirmed cases with positive reverse transcriptase polymerase chain reaction (RT‐PCR) and chest computed tomography (CT) imaging results considered as COVID‐19 lung involvement, second group includes the clinically diagnosed cases with negative RT‐PCR and positive CT imaging abnormalities, third group includes mild and asymptomatic cases with positive RT‐PCR and negative CT findings, fourth group includes suspected cases with negative RT‐PCR and negative CT findings. Post‐hoc analysis was performed to evaluate the differences among the groups.
Results
In total, 3334 patients with the prediagnosis of COVID‐19 admitted to the emergency department. Based on the post hoc analyses, significant differences were found among the four groups in terms of their test results of leukocytes, haemoglobin, platelet, neutrophils, urea and C‐reactive protein (CRP) (P < .001). Furthermore, the factors of age groups, hospitalisation, intensive care unit follow‐up and mortality rate of the four groups showed a significant difference among the groups (P = .001).
Conclusion
The mean leukocytes, neutrophils and platelet counts of patients with positive RT‐PCR were found to be lower than the ones with negative RT‐PCR. The mean serum levels of CRP were found to be higher in patients with lung involvement compared with other patient groups.
Keywords: clinical features, computed tomography, COVID‐19, epidemiological characteristics, laboratory markers, reverse transcriptase polymerase chain reaction
What is already known about this topic?
In cases with confirmed COVID‐19 individuals over 65 years and hospitalisation rates were higher than the other groups.
What is added by this report?
No deaths were found in cases with confirmed COVID‐19. The chest CT imaging results of only 23% of the patients with positive RT‐PCR test results showed COVID‐19 pneumonia findings. Most patients with COVID‐19 had normal leukocyte and lymphocyte counts in blood cell count. The mean serum levels of CRP value of the cases with lung involvement were higher.
1. INTRODUCTION
World Health Organization (WHO) reported pneumonia cases of unknown etiology in Hubei State, Wuhan city of China on December 31st, 2019. Fever, shortness of breath and radiological findings of bilateral lung pneumonic infiltration were detected in these cases. 1 On January 7, 2020, Chinese scientists isolated severe acute respiratory syndrome coronavirus 2 (SARS‐CoV‐2) virus from the patients and disease was called as a coronavirus disease ‐ 2019 (COVID‐19) infection by WHO in February 2020. 2 , 3 On January 10th 2020, COVID‐19 Science Committee of the Ministry of Health of the Republic of Turkey was established in Turkey. The committee prepared up‐to‐date diagnosis and treatment guidelines based on the available scientific evidence and ensured that the patient diagnosis and treatment management are performed through following these guidelines in all hospitals in Turkey. The first COVID‐19 case was recorded on March 11th 2020 considerably later than the COVID‐19 outbreaks in neighbouring countries such as European countries and Iran. 4 WHO declared COVID‐19 as a pandemic on March 11, 2020. 5
The confirmed number of cases has been continuously rising daily worldwide. The pandemic that originated from Asia spread to Europe first, and then USA and Africa continents; the highest number of cases has been so far reported in USA, Brazil, Russia, India and United Kingdom. 6 As the outbreak has been rapidly spreading all around the world, as of May 9, 2021, the number of confirmed COVID‐19 cases worldwide stands at 157.289.118 and the total number of deaths is 3.277.272, while the number of cases and deaths in Turkey was reported as 5.016.141 and 42.746, respectively. 7 Identifying the epidemiological characteristics of this disease will guide appropriate decisions and thus help fighting the pandemic.
This study aims to present the details of epidemiological and clinical features, laboratory markers, radiological features, therapeutic approaches and survival conditions of patients with the prediagnosis of COVID‐19 retrospectively in Samsun Gazi State Hospital that is one of the pandemic hospitals authorised to apply diagnosis and treatment protocols of COVID‐19 in Turkey.
2. MATERIALS AND METHODS
2.1. Study design and participants
The study presents a retrospective evaluation of the patients admitted to the Emergency Department of Samsun Gazi State Hospital with the prediagnosis of COVID‐19 between March 11, 2020 that is the date of the first reported case in Turkey and June 30, 2020.
The patient data on age, symptoms, vital findings, comorbid diseases, smoking and preapplication 14‐day clinical history of the patients were obtained in the triage area of the emergency department and the patients considered as a potential or confirmed COVID‐19 case were directed to the isolation area in the service. A potential case is defined as a case that shows at least one of the symptoms and findings of fever or acute respiratory tract disease (coughing and shortness of breath) by the fact that his/her clinical presentation cannot be categorised as any other disease by the history of going abroad or contacting the relatives that went abroad in the 14 days before the beginning of symptoms or as a case that were in close contact with a confirmed COVID‐19 patient. Moreover, the confirmed cases are defined who were found to have SARS‐CoV‐2 in nasopharyngeal swab samples obtained from potential cases. Laboratory tests and lung imaging scans of the patients who were taken to the isolation area were carried out, and nasopharyngeal swab samples were obtained from the people who were in close contact with a confirmed COVID‐19 patient to perform SARS‐CoV‐2 reverse transcriptase polymerase chain reaction (RT‐PCR) test. Furthermore, complete blood count, electrolytes, glucose, urea, creatinine, aspartate aminotransferase (AST), alanine aminotransferase (ALT), C‐reactive protein (CRP), d‐dimer, troponin tests were performed on each case. Unenhanced chest computed tomography (CT) imaging was applied for lung imaging and the acquired CT findings were categorised under two main groups. The findings considered as COVID‐19 pneumonia in the foreground are occurrences of peripheral, bilateral, ground glass opacity, multifocal round ground glass opacity (they can be accompanied by other findings of organised pneumonia such as paving stone appearance, consolidation, reverse‐halo) (CT +). The findings not considered as COVID‐19 pneumonia in the foreground are the chest CT findings regarded as atelectasis, lobar consolidation, and parenchymal band formation (CT –). 4
In the study, the patients are categorised in four main groups. 8 The first group as confirmed cases are those admitted to the hospital with fever and acute respiratory tract symptoms, tested positive RT‐PCR, and with chest CT imaging results considered as COVID‐19 lung involvement (CT +). The second group as the clinically diagnosed cases are those admitted to the hospital with fever and acute respiratory tract symptoms, tested negative RT‐PCR, but with chest CT imaging results considered positive in terms of COVID‐19 lung involvement (CT +). The third group as the mildly symptomatic or completely asymptomatic cases, are those tested positive RT‐PCR, but the chest CT imaging yielded negative results (CT –). The fourth group as the suspected cases, are patients admitted to the hospital with fever and acute respiratory tract symptoms, tested negative RT‐PCR and showed no COVID‐19 lung involvement in chest CT imaging (CT –).
2.2. Data collection
Epidemiological, demographic, clinical, laboratory, treatment data of the patients admitted to the isolation area were obtained from the electronic database of the hospital retrospectively.
2.3. Ethical approval
Ethics committee approval was obtained with the Ethics Committee Decision dated 30 June 2020 and No. 10 of Health Sciences University Samsun Education and Training Hospital Ethics Committee.
2.4. Data analysis
Descriptive statistics are presented with mean and standard deviation values for continuous data; they are presented with numbers and percentages for categorical data. The compatibility of continuous data with a normal distribution was evaluated by Kolmogorov‐Smirnov test. Mann‐Whitney U, Kruskal‐Wallis H and chi‐square tests were used in the statistical analysis. Post‐hoc analysis was conducted for the differences arising from Kruskal‐Wallis H test and Bonferroni correction was made in the evaluation. For statistical significance, p values in the confidence interval of 95% and below 0.05 were considered significant. The program IBM SPSS (Statistical Package for the Social Sciences, Chicago, IL, USA), version 21.0 was used for the statistical analysis.
3. RESULTS
3334 patients were admitted to the emergency department in total, with the prediagnosis of COVID‐19. 55.5% of the patients are male. Age mean of the patients is 45.46 ± 19.7; the median age is 42(6‐106). While 34.7% of the patients belong to the age group 31‐50 years, 19.8% is above 65 years of age. Of the total cases, 12.7% had hypertension, 7.5% had diabetes, 7.1% had chronic obstructive pulmonary disease (COPD). 28.1% of the patients were smokers. The demographic features and the comorbid diseases of the cases are given in Table 1.
TABLE 1.
Characteristics of patients with the prediagnosis of COVID‐19
| Characteristics | n | % |
|---|---|---|
| Gender | ||
| Male | 1850 | 55.5 |
| Female | 1484 | 44.5 |
| Age groups | ||
| <18 | 62 | 1.9 |
| 19‐30 | 917 | 27.5 |
| 31‐50 | 1158 | 34.7 |
| 51‐64 | 538 | 16.1 |
| 65< | 659 | 19.8 |
| Comorbidity | ||
| Hypertension | 424 | 12.7 |
| Diabetes mellitus | 250 | 7.5 |
| Cardiovascular disease | 111 | 3.3 |
| Chronic respiratory disease | 236 | 7.1 |
| Chronic kidney disease | 26 | 0.8 |
| Malignancy | 22 | 0.7 |
| Cerebrovascular disease | 7 | 0.2 |
| Pregnancy | 5 | 0.1 |
| Other diseases* | 56 | 1.7 |
| Smokers | 936 | 28.1 |
Other diseases: Chronic rheumatic diseases, epilepsy, thyroid diseases, liver diseases.
The most frequent symptoms reported by patients were coughing (22.8%), shortness of breath (22.6%), muscle and joint pains (11.1%), fever (6.2%) and fatigue (6.2%). The less frequent symptoms were, in order of frequency, the complaints of sore throat, chest pain, nausea‐vomiting‐diarrhoea, headache‐dizziness. While 22.1% of the patients were hospitalised, 2.2% were monitored in the intensive care unit (ICU). Of the total cases, 0.4% (n = 12) resulted in exitus. The mortality rate was found 0.8% (n = 7) in cases considered having COVID‐19. 2.4% of the patients were referred to other health centres for various reasons (Table 2). 9.8% of all cases were tested positive in RT‐PCR test. 16.4% of the cases showed COVID‐19 pneumonia findings in CT imaging results. 13.7% of the cases whose CT imaging results showed COVID‐19 pneumonia were tested positive in RT‐PCR. No pathology was found in CT results of 53.5% of the cases (Table 3).
TABLE 2.
Clinical features of patients with the pre‐diagnosis of COVID‐19
| Clinical features | n | % |
|---|---|---|
| RT‐PCR* | ||
| Positive | 326 | 9.8 |
| Negative | 3008 | 90.2 |
| Chest CT** Scans | ||
| Positive | 546 | 16.4 |
| No Lung Abnormality | 1784 | 53.5 |
| Other*** | 495 | 14.9 |
| Not taken CT | 509 | 15.2 |
| Hospitalized | ||
| Yes | 737 | 22.1 |
| No | 2597 | 77.9 |
| Intensive care unit | ||
| Yes | 75 | 2.2 |
| No | 3259 | 97.8 |
| Transfer of patient | ||
| Yes | 79 | 2.4 |
| No | 3255 | 97.6 |
| Survey | ||
| Death | 12 | 0.4 |
| Recovery | 3322 | 99.6 |
| Signs and Symptoms | ||
| Asymptomatic | 1130 | 33.9 |
| Cough | 759 | 22.8 |
| Shortness of breath | 754 | 22.6 |
| Myalgia | 371 | 11.1 |
| Fatigue | 206 | 6.2 |
| Fever | 207 | 6.2 |
| Sore throat | 158 | 4.7 |
| Chest distress | 142 | 4.3 |
| Other Symptoms | 83 | 2.5 |
| Diarrhea/Nausea/ Vomiting | 70 | 2.1 |
| Headache/Dizziness | 70 | 2.1 |
| Treatment | ||
| Hydroxychloroquine sulfate | 580 | 17.4 |
| Azithromycin | 340 | 10.2 |
| Oseltamivir | 127 | 3.8 |
| Favipiravir | 54 | 1.6 |
| Fluoroquinolone | 36 | 1.1 |
| Enoxaparin sodium | 137 | 4.1 |
RT‐PCR: Reverse transcriptase polymerase chain reaction
CT: Computed tomography
Other: atelectasis, lobar consolidation, and parenchymal band formation.
TABLE 3.
Chest CT and RT‐PCR rates
| Variables | RT‐PCR** | Total n (%) | |
|---|---|---|---|
|
Negative n (%) |
Positive n (%) |
||
| Chest CT* | |||
| Positive n (%) | 471 (15.7) | 75 (23.0) | 546 (16.4) |
|
Others n (%) |
2537 (84.3) | 251 (77.0) | 2788 (83.6) |
| Total n (%) | 3008 (100.0) | 326 (100.0) | 3334 (100.0) |
CT: Computed tomography
RT‐PCR: Reverse transcriptase polymerase chain reaction.
Age groups, laboratory studies, hospitalisation, ICU monitoring and exitus condition of the cases were compared in the four groups: first group represents the confirmed cases (RT‐PCR+ CT +); second group consists of the clinically diagnosed cases (RT‐PCR– CT +); third group represents the mild or asymptomatic cases (RT‐PCR+ CT –); fourth group consists of the suspected cases (RT‐PCR– CT –). While a significant difference was found among leukocytes (P < .001), haemoglobin (P < .001), platelets (P < .001), neutrophils (P < .001), urea (P < .001), ALT (P = .007) and CRP (P < .001) values in the laboratory results between the groups based on the post‐hoc analyses; no significant difference was found among lymphocytes, Na, K, Cl, serum creatinine, AST, D‐dimer and troponin values. We found in the post‐hoc analyses that the difference between leukocytes and neutrophils values is because of the difference between groups 1‐4 (P < .001), 1‐2 (P < .001), 3‐4 (P < .001), 3‐2 (P < .001); whereas the difference between CRP values is because of the groups 3‐2 (P = .001), 4‐2 (P < .001). Although no statistical difference was found in lymphocyte values among the groups (P = .017), mean lymphocyte value was found to be lower in group 1 than in other groups. Comparison of the laboratory test results among the groups is given in Table 4. A significant difference was found for each parameter among the groups in the comparison of age groups, hospitalisation, ICU monitoring and exitus condition for four groups (P = .001). 35.6% of positive patients in RT‐PCR test (groups 1‐3) are in the age group of 19‐30 years. The rate of admission to service of patients who had positive RT‐PCR test results are 52.2%. This rate is significantly higher than patients who had negative RT‐PCR test results (groups 2‐4) (Table 5).
TABLE 4.
Comparison of laboratory findings between groups
| Laboratory markers |
CT+RT‐PCR+ |
CT+RT‐PCR– | CT– RT‐PCR+ | CT– RT‐PCR– | P value | ||||||||
|---|---|---|---|---|---|---|---|---|---|---|---|---|---|
| Mean | Max | Min | Mean | Max | Min | Mean | Max | Min | Mean | Max | Min | ||
| Leucocytes (×109/L; normal range 4.5‐10.5) | 7.16 | 22.80 | 2.50 | 9.81 | 29.60 | 2.60 | 7.46 | 16.30 | 2.80 | 9.79 | 152.50 | 1.50 | <.001 |
| Haemoglobin (g/dl; normal range 12‐17.4) | 13.55 | 17.10 | 8.50 | 13.17 | 18.10 | 3.64 | 13.86 | 17.80 | 4.22 | 13.79 | 223.00 | 4.80 | <.001 |
| Platelets (×109/L; normal range 142‐424) | 231.46 | 556.00 | 81.00 | 359.05 | 373.00 | 66.00 | 233.11 | 399.00 | 3.85 | 826.02 | 367.00 | 1.40 | <.001 |
| Lymphocytes (×109/L; normal range 0.6‐3.4) | 1.80 | 3.70 | 0.30 | 2.14 | 16.80 | 0.20 | 2.09 | 8.30 | 0.40 | 2.20 | 29.10 | 0.20 | .017 |
| Neutrophils (×109/L; normal range 2‐6.9) | 4.65 | 19.10 | 1.40 | 7.21 | 93.00 | 1.00 | 5.41 | 68.40 | 1.30 | 6.91 | 138.00 | 0.50 | <.001 |
|
Na+ (mmol; 136‐146) |
140.87 | 338.00 | 128.00 | 137.14 | 234.00 | 115.00 | 137.40 | 144.00 | 129.00 | 137.25 | 139.00 | 3.58 | .907 |
|
K+ (mmol; 3.5‐5.1) |
4.18 | 7.01 | 3.10 | 5.25 | 4.90 | 2.67 | 4.02 | 5.55 | 3.22 | 4.32 | 5.50 | 2.89 | .038 |
|
Cl‐ (mmol; 101‐109) |
103.60 | 109.00 | 96.00 | 102.19 | 122.20 | 93.99 | 103.17 | 110.50 | 97.90 | 102.94 | 136.20 | 98.00 | .047 |
| Glucose (mg/dL; normal range 74‐106) | 116.74 | 259.00 | 85.00 | 132.51 | 753.00 | 35.00 | 116.83 | 301.00 | 73.00 | 127.04 | 924.00 | 67.00 | .044 |
| Serum creatinine (mg/dL; normal range 0.67‐1.17) | 0.89 | 1.82 | 0.53 | 1.61 | 3.90 | 0.24 | 0.81 | 1.77 | 0.40 | 1.36 | 1.80 | 0.10 | .015 |
| Urea (mg/dL; normal range 17‐43) | 17.90 | 29.14 | 9.48 | 21.94 | 132.39 | 3.23 | 16.75 | 32.71 | 8.90 | 19.77 | 174.00 | 0.68 | <.001 |
| Aspartate aminotransferase (U/L; 5‐50) | 30.34 | 121.00 | 8.00 | 30.73 | 1203.00 | 3.61 | 30.01 | 253.00 | 11.00 | 35.06 | 8034.00 | 4.70 | .067 |
| Alanine aminotransferase (U/L; 5‐50) | 26.53 | 145.00 | 7.00 | 24.70 | 788.00 | 3.00 | 29.46 | 235.00 | 7.00 | 27.12 | 2990.00 | 2.00 | .007 |
|
C‐reactive protein (mg/L; 0‐5) |
29.54 | 219.21 | 0.37 | 40.70 | 395.10 | 0.11 | 15.42 | 100.59 | 0.34 | 31.39 | 403.22 | 0.07 | <.001 |
| D‐Dimer (normal range; 0‐0.55) | 13.48 | 278.00 | 0.05 | 18.36 | 450.00 | 0.01 | 8.39 | 287.00 | 0.05 | 19.44 | 1420.00 | 0.01 | .047 |
| Troponin (ng/ml; normal range 0‐0.16) | 0.12 | 0.66 | 0.10 | 0.21 | 13.85 | 0.10 | 0.10 | 0.13 | 0.10 | 0.16 | 25.00 | 0.10 | .360 |
The bold values indicate significant P values. P < .008, Bonferroni correction.
TABLE 5.
Comparison of age, hospitalization and survival between groups
| Variables | CT+RT‐PCR+ | CT+RT‐PCR– | CT– RT‐PCR+ | CT– RT‐PCR– | Total | P value |
|---|---|---|---|---|---|---|
| (n = 75) | (n = 471) | (n = 251) | (n = 2537) | (n = 3334) | ||
| n (%) | n (%) | n (%) | n (%) | n (%) | ||
| Age groups | ||||||
| <18 | 1 (1.3) | 3 (0.6) | 4 (1.6) | 54 (2.1) | 62 (1.9) | <.001 |
| 19‐30 | 3 (4.0) | 50 (10.6) | 113 (45.0) | 751 (29.6) | 917 (27.5) | |
| 31‐50 | 27 (36.0) | 138 (29.3) | 80 (31.9) | 913 (36.0) | 1158 (34.7) | |
| 51‐64 | 15 (20.0) | 113 (24.0) | 28 (11.2) | 382 (15.1) | 538 (16.1) | |
| 65< | 29 (38.7) | 167 (35.5) | 26 (10.4) | 437 (17.2) | 659 (19.8) | |
| Hospitalized | ||||||
| No | 20 (26.7) | 233 (49.5) | 136 (54.0) | 2207 (87.0) | 2596 (77.9) | <.001 |
| Yes | 55 (73.3) | 238 (50.5) | 115 (46.0) | 331 (13.0) | 738 (22.1) | |
| Intensive care unit | ||||||
| No | 71 (94.7) | 442 (93.8) | 247 (98.4) | 2499 (98.5) | 3259 (97.8) | <.001 |
| Yes | 4 (5.3) | 29 (6.2) | 4 (1.6) | 38 (1.5) | 75 (2.2) | |
| Death | ||||||
| No | 75 (100.0) | 466 (98.9) | 249 (99.2) | 2528 (99.8) | 3322 (99.6) | <.001 |
| Yes | 0 (0.0) | 5 (1.1) | 2 (0.8) | 5 (0.2) | 12 (0.4) |
We found that the doctors started treatment for 19.4% of (n = 646) the patients in total. In our analysis of the medications administered to the patients, we found that hydroxychloroquine sulphate (89.8%, n = 580) is the most preferred medication (Table 2).
In our monthly basis analysis of RT‐PCR and CT imaging results showing COVID‐19 pneumonia findings, we found that 54.3% (n = 177) of all RT‐PCR‐positive cases admitted to the hospital are in June. The rate is 1.2% (n = 4) in March (Figure 1).
FIGURE 1.
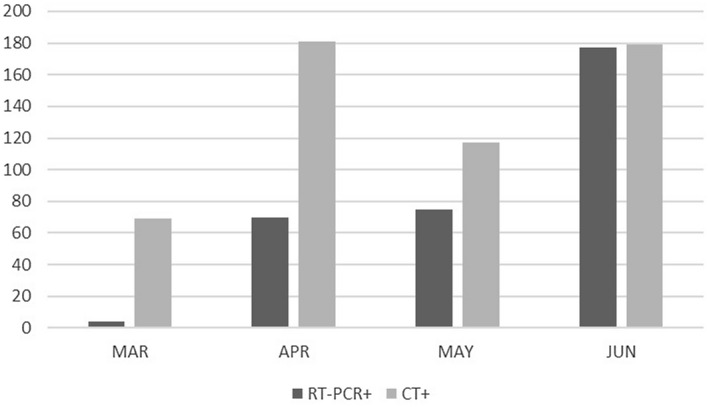
CT and RT‐PCR positivity by months (n = 3334)
4. DISCUSSION
Three types of coronavirus infections broke out worldwide in the last twenty years. They are Severe Acute Respiratory Syndrome (SARS) in 2002, Middle East Respiratory Syndrome (MERS) in 2012 and COVID‐19 pandemic in 2019. 9 This study involves retrospective examination of the patients admitted to the hospital with the prediagnosis of COVID‐19 in the period of approximately four months starting on March 11, 2020. WHO classified COVID‐19 pandemic as international public health emergency on January 30 and declared it as a pandemic on March 11 as 113 countries reported COVID‐19 outbreaks after China where it first appeared. 5 The first activity on COVID‐19 started on January 10 in Turkey, and the first COVID‐19 case was reported on March 11 significantly later than the neighbouring European countries and Iran. 4 In our study, only 1.2% of positive RT‐PCR test results are registered in March. The rate increased to 54.3% in June. The removal of the inter‐province travel bans and the beginning of normalisation process on June 1, 2020 are thought to affect the rate increase.
3334 patients were examined in the study in total in which 55.5% of the cases is male. In the meta‐analysis by Wang et al on 1994 patients, the rate of males is 60%. 10 Other studies in literature report that MERS‐CoV and SARS‐CoV infected males more than females. 11 , 12 The less susceptibility to infection among women could be attributed to the X chromosome and sex hormones, which have been reported to play a role in innate and adaptive immunity. 13
We found in our study that the most common symptoms reported by patients are coughing (22.8%), shortness of breath (22.6%), muscle‐joint pain (11.1%), fever (6.2%) and fatigue (6.2%). The fewer common symptoms are found to be the complaints of nausea, vomiting, diarrhoea, headache, dizziness and chest pain. In a meta‐analysis that comprises 38 studies carried out in China, the most frequent symptoms are fever (80.4%), coughing (63.1%), fatigue (46%) and muscle pain (33%). 14 The study by Wang et al indicates that the most frequent clinical symptoms are fever, coughing, fatigue, myalgia and shortness of breath. In addition to common respiratory syndromes, some patients were reported to have headache or dizziness (12.1%), diarrhoea (4.8%), and nausea and vomiting (3.9%) symptoms. 10 In a retrospective study of 393 patients in New York state of USA, the most common symptoms were reported to be coughing, fever, shortness of breath, muscle pain, nausea, vomiting and diarrhoea by prevalence. 15 While the common respiratory symptoms are found to be similar in cases in different geographic locations, the non‐respiratory syndromes also stand out in COVID‐19 infections.
9.8% of the total cases in the study tested positive in RT‐PCR tests. Chest CT imaging is applied on 84.8% of the patients admitted to hospital. 13.7% of the cases in which the CT imaging results showed COVID‐19 pneumonia findings also tested positive in RT‐PCR tests. The chest CT imaging results of 23% of the patients who tested positive in RT‐PCR test showed COVID‐19 pneumonia findings. As of July 1 2020, the number of total tests was reported to be 3.433.963, and total number of cases was reported to be 201.098 in Turkey. The positive rate of the tests performed until that date is 5.8%. 16 The positive rate of the tests in the hospital (9.8%) where we run our study is above the average of the country‐wide results in Turkey. The difference between the rates is thought to arise from the fact that the screening tests performed by the contact tracing teams on asymptomatic cases or contacts are also included in the country‐wide results. RT‐PCR and chest CT are the main diagnostic methods for COVID‐19. Chest CT is recommended as an alternative and reliable method in the diagnosis of COVID‐19 patients in China. 17 In the study by Fang et al, the sensitivity of chest CT (98%) is reported to be higher than that of RT‐PCR (71%) (P < .001). The study favours the use of chest CT imaging for patients with clinical and epidemiological features corresponding to the COVID‐19 infection, particularly when they are tested negative RT‐PCR. The current practical issues with RT‐PCR testing such as vendor‐related instrument variability, immature nucleic acid assays, low sensitivity to low viral load and incorrect/unreliable clinic sampling are among the reasons for low precision of viral nucleic acid determination. 18 Chung et al reported that chest CT imaging results can be negative for COVID‐19 viral pneumonia in the first admission to hospital (three of 21 patients, 86% sensitivity). 19 Xie et al reported that five of 167 patients (3%) can be tested negative in RT‐PCR testing for COVID‐19 on first admission to hospital in spite of the chest CT imaging shows findings specific to a COVID‐19 pneumonia. 20 A meta‐analysis comprising nine studies that were conducted until April 2020 in the databases of Medline, Embase, Scopus and Web of Science inferred that neither of the two diagnostic modalities is reliable alone, and final diagnosis must be made on the basis of both CT scanning and RT‐PCR. 21 Another study conducted in China does not favour the routine use of CT imaging because of its poor specificity in spite of high sensitivity. Other disadvantages are reported to be unnecessary exposure of patients to radiation and the rise in the risk of nosocomial infection because of the potential contamination during imaging. 22 Actual sensitivity ratio between CT and PCR is investigated in other objective studies in a meta‐analysis comprising 37 studies on 9610 patients; no significant difference was found between the two methodologies (75% and 78%, respectively). 23
Laboratory findings were examined by separating the patients into four groups: first group (RT‐PCR +, CT +), second group (RT‐PCR–, CT +), third group (RT‐PCR+, CT–) and fourth group (RT‐PCR–, CT–). Most patients had normal leukocyte and lymphocyte counts in blood test examinations. The mean values of leukocyte and lymphocyte counts are 7.16 (×109/L; min‐max: 2.5‐22.8) and 1.8 (×109/L; min‐max: 0.3‐3.7) in the first group, respectively. A significant difference was found in leukocytes, neutrophils and platelet values between the first and third group and the second and fourth groups (P < .001). The mean leukocytes, neutrophils and platelet values in RT‐PCR +patients are found to be lower than those with RT‐PCR. There was not any statistically significant difference in the mean of lymphocyte values among the groups. In this study, the mean value of CRP was found to be significantly higher in the second group compared with third and fourth groups (P < .001). The CRP value of the cases with lung involvement was higher. However, the mean value was found to be lower in the first group compared with other groups. In the meta‐analysis by Zhu et al, 3062 patients were examined, and normal leukocyte values (69.7%), lymphopenia (56.5%), increased CRP levels (73.6%) and ESR (65.6%) were found in most patients. 14 90% of 393 patients reported in USA had lymphopenia, 27% of them had thrombocytopenia and most of them had high liver function values and inflammatory markers. 15 Zhang et al found that CRP values in patients with negative imaging findings were significantly higher than those with normal imaging findings (P < .05). 24 This finding indicates that the symptom of pneumonia can be associated with a serious illness; therefore, such patients are in a tendency to have more serious clinical features. Although there was an increase in AST, ALT and creatinine levels in some confirmed COVID‐19 cases, no significant difference was found in mean values of the groups. Critical organ functions such as liver and kidney functions in COVID‐19 patients must be closely monitored and evaluated.
23.4% of all cases had a comorbid disease. The most frequent comorbid diseases are hypertension (12.7%), diabetes (7.5%), COPD (7.1%), cardiovascular disease (3.3%), chronic renal failure (0.8%) and malignancy (0.7%). The comorbidity rate is 10.89% in a study that examines 2968 patients that were admitted to the hospital with the diagnosis of COVID‐19 in Iran. Diabetes (3.81%), chronic pulmonary disease (2.02%), hypertension (1.99%), cardiovascular disease (1.25%), chronic renal failure (0.60%) and malignancy (0.57%) were reported to be the most frequent comorbid diseases. 25 While the rate of underlying diseases is 31.9% in a meta‐analysis that studies 135 infected patients in China, the most frequent medical histories were hypertension, diabetes, cardiovascular disease and malignancy. 26 A meta‐analysis by Yang et al on 1576 infected patients reported that the most common comorbidities are hypertension, diabetes, cardiovascular disease and respiratory disease. This study evaluated the comorbid diseases of patients that have acute or mild COVID‐19 infection and found that the underlying diseases pose a risk of acute infection. 27
22.1% of the patients admitted to the hospital are treated by admission to the service. The rate is 52.2% in RT‐PCR +patients. 2.2% of all cases were monitored in the ICU. 12 patients (0.4%) in total died. The case fatality rate is found in 0.8% diagnosed with COVID‐19. In Turkey, the case fatality rate was reported until July 1, 2020 is 2.5%. The case fatality rate around the world is 4.9% as reported until July 1, 2020. 16 The case fatality was reported to be 2% worldwide on May 9, 2021. 7 The meta‐analysis by Wang et al investigated 10 studies in the literature and reported the mortality rate to be 5%. 10 Another meta‐analysis studying 3062 patients found that the case fatality rate is 5.5%. 14 In a study on 2968 patients in a single centre in Iran, the case fatality rate is reported to be 1.85%. 25 The reason for the low case fatality rate in this study can be attributed to inclusion of the asymptomatic/mild cases treated and monitored at home in addition to the hospitalised patients.
Despite the important statistical learnings from our study, our study has limitations originating from the scale of the pandemic. This study includes the early stages of COVID‐19 from March to June 2020. COVID‐19 patient management, therapeutic strategies constantly change since the beginning of the pandemic. Therefore, new studies that include up‐to‐date information are needed.
5. CONCLUSION
The case fatality rate caused by COVID‐19 is found to be lower in Samsun province than the rates in Turkey and around the world. The mean of leukocytes, neutrophils and platelet count values in RT‐PCR +patients are found to be lower than those of RT‐PCR – patients. The mean serum levels of CRP value in patients with lung involvement are found to be higher than those of other patient groups included in the study.
COVID‐19 infection continues to spread across the whole world as the number of cases and mortality rates increase daily. Changes in seasonal conditions, social and economic life have a significant influence on the process, and further studies should be conducted on a broader context including a larger number of cases in the future.
CONFLICTS OF INTEREST
We declare that there is no conflict of interests. All authors have read and approved the submission.
AUTHORS’ CONTRIBUTIONS
Simsek Yurt, N: protocol/project development, data collection, data analysis, writing/editing, management. Ocak, M: data collection, data analysis, manuscript reviewing. Yurt, YC: protocol/project development, data collection, manuscript reviewing.
Simsek Yurt N, Ocak M, Yurt YC. Epidemiological and clinical characteristics of 3334 cases with prediagnosis coronavirus disease ‐ 2019 (COVID‐19) in Turkey. Int J Clin Pract. 2021;75:e14496. 10.1111/ijcp.14496
REFERENCES
- 1. Zhu N, Zhang D, Wang W, et al. A novel coronavirus from patients with pneumonia in China, 2019. N Engl J Med. 2020;382(8):727‐733. [DOI] [PMC free article] [PubMed] [Google Scholar]
- 2. Xu X, Chen P, Wang J, et al. Evolution of the novel coronavirus from the ongoing Wuhan outbreak and modeling of its spike protein for risk of human transmission. Sci China Life Sci. 2020;63(3):457‐460. [DOI] [PMC free article] [PubMed] [Google Scholar]
- 3. World Health Organization . Director ‐ General's remarks at the media briefing on 2019 nCoV on 11 February 2020. [Internet]. 2020 [cited 10.10.2020]; 2020. Available from: https://www.who.int/dg/speeches/detail/who‐director‐general‐s‐remarks‐at‐the‐media‐briefing‐on‐2019‐ncov‐on‐11‐february‐2020
- 4. Ministry of Health of the Republic of Turkey . COVID‐19 (SARS‐CoV‐2 infection) general information [Internet]. cited 30 Oct 2020.; 2020. Available from: https://covid19.saglik.gov.tr/Eklenti/39060/0/covid‐19rehberigenelbilgilerepidemiyolojivetanipdf.pdf [Google Scholar]
- 5. World Health Organization . Director ‐ General's opening remarks at the media briefing on COVID‐19 –11 March 2020 [Internet]. [cited 10 Oct 2020]; 2020. Available from: https://www.who.int/dg/speeches/detail/who‐director‐general‐s‐opening‐remarks‐at‐the‐media‐briefing‐on‐covid‐19‐11‐march‐2020
- 6. Kayihan P. Epidemiological Characteristics of COVID‐19 2020 (in Turkish). Available from: https://www.ttb.org.tr/kollar/userfiles/files/bto_covid_19_kitap.pdf#page=14
- 7. World Health Organization . Coronavirus disease (COVID‐19) situation report, 9 May 2021. [Internet]. [cited 10 May 2021]; 2020. Available from: https://covid19.who.int/
- 8. Tian S, Hu N, Lou J, et al. Characteristics of COVID‐19 infection in Beijing. J Infect. 2020;80(4):401‐406. [DOI] [PMC free article] [PubMed] [Google Scholar]
- 9. Munster VJ, Koopmans M, van Doremalen N , van Riel D , de Wit E . A novel coronavirus emerging in China—key questions for impact assessment. New Eng J Med. 2020;382(8):692‐694. [DOI] [PubMed] [Google Scholar]
- 10. Li L‐Q, Huang T, Wang Y‐Q, et al. COVID‐19 patients' clinical characteristics, discharge rate, and fatality rate of meta‐analysis. J Med Virol. 2020;92(6):577‐583. [DOI] [PMC free article] [PubMed] [Google Scholar]
- 11. Channappanavar R, Fett C, Mack M, Ten Eyck PP, Meyerholz DK, Perlman S. Sex‐based differences in susceptibility to severe acute respiratory syndrome coronavirus infection. J Immunol. 2017;198(10):4046‐4053. [DOI] [PMC free article] [PubMed] [Google Scholar]
- 12. Badawi A, Ryoo SG. Prevalence of comorbidities in the Middle East respiratory syndrome coronavirus (MERS‐CoV): a systematic review and meta‐analysis. Int J Infect Dis. 2016;49:129‐133. [DOI] [PMC free article] [PubMed] [Google Scholar]
- 13. Jaillon S, Berthenet K, Garlanda C. Sexual dimorphism in innate immunity. Clin Rev Allergy Immunol. 2019;56(3):308‐321. [DOI] [PubMed] [Google Scholar]
- 14. Zhu J, Ji P, Pang J, et al. Clinical characteristics of 3062 COVID‐19 patients: a meta‐analysis. J Med Virol. 2020;92:1902‐1914. [DOI] [PMC free article] [PubMed] [Google Scholar]
- 15. Goyal P, Choi JJ, Pinheiro LC, et al. Clinical characteristics of Covid‐19 in New York City. N Engl J Med. 2020;382(24):2372‐2374. [DOI] [PMC free article] [PubMed] [Google Scholar]
- 16. World Health Organization . Coronavirus disease (COVID‐19) situation report – 163, 1 July 2020 [Internet]. [cited 10 Oct 2020]; 2020. Available from: https://www.who.int/docs/default‐source/coronaviruse/situation‐reports/20200701‐covid‐19‐sitrep‐163.pdf?sfvrsn=c202f05b_2
- 17. Ai T, Yang Z, Hou H, et al. Correlation of chest CT and RT‐PCR testing for coronavirus disease 2019 (COVID‐19) in China: a report of 1014 cases. Radiol. 2020;296(2):E32‐E40. [DOI] [PMC free article] [PubMed] [Google Scholar]
- 18. Fang Y, Zhang H, Xie J, et al. Sensitivity of chest CT for COVID‐19: comparison to RT‐PCR. Radiol. 2020;296(2):E115‐E117. [DOI] [PMC free article] [PubMed] [Google Scholar]
- 19. Chung M, Bernheim A, Mei X, et al. CT imaging features of 2019 novel coronavirus (2019‐nCoV). Radiol. 2020;295(1):202‐207. [DOI] [PMC free article] [PubMed] [Google Scholar]
- 20. Xie X, Zhong Z, Zhao W, Zheng C, Wang F, Liu J. Chest CT for typical 2019‐nCoV pneumonia: relationship to negative RT‐PCR testing. Radiol. 2020;200343. [DOI] [PMC free article] [PubMed] [Google Scholar]
- 21. Hossein H, Ali KM, Hosseini M, Sarveazad A, Safari S, Yousefifard M. Value of chest computed tomography scan in diagnosis of COVID‐19; a systematic review and meta‐analysis. Clin Transl Imaging. 2020;8(6):469‐481. [DOI] [PMC free article] [PubMed] [Google Scholar]
- 22. Huang EP‐C, Sung C‐W, Chen C‐H, Fan C‐Y, Lai P‐C, Huang Y‐T. Can computed tomography be a primary tool for COVID‐19 detection? Evidence appraisal through meta‐analysis. Crit Care. 2020;24:1‐3. [DOI] [PMC free article] [PubMed] [Google Scholar]
- 23. Waller JV, Allen IE, Lin KK, Diaz MJ, Henry TS, Hope MD. The limited sensitivity of chest computed tomography relative to reverse transcription polymerase chain reaction for severe acute respiratory syndrome coronavirus‐2 infection: a systematic review on COVID‐19 diagnostics. Invest Radiol. 2020;55(12):754‐761. [DOI] [PMC free article] [PubMed] [Google Scholar]
- 24. Zhang X, Cai H, Hu J, et al. Epidemiological, clinical characteristics of cases of SARS‐CoV‐2 infection with abnormal imaging findings. Int J Infect Dis. 2020;94:81‐87. [DOI] [PMC free article] [PubMed] [Google Scholar]
- 25. Nikpouraghdam M, Jalali Farahani A, Alishiri G, et al. Epidemiological characteristics of coronavirus disease 2019 (COVID‐19) patients in IRAN: a single center study. J Clin Virol. 2020;127:104378. [DOI] [PMC free article] [PubMed] [Google Scholar]
- 26. Wan S, Xiang Y, Fang W, et al. Clinical features and treatment of COVID‐19 patients in northeast Chongqing. J Med Virol. 2020;92(7):797‐806. [DOI] [PMC free article] [PubMed] [Google Scholar]
- 27. Yang J, Zheng Y, Gou X, et al. Prevalence of comorbidities and its effects in patients infected with SARS‐CoV‐2: a systematic review and meta‐analysis. Int J Infect Dis. 2020;94:91‐95. [DOI] [PMC free article] [PubMed] [Google Scholar]