Abstract
This article is mainly concerned with COVID‐19 diagnosis from X‐ray images. The number of cases infected with COVID‐19 is increasing daily, and there is a limitation in the number of test kits needed in hospitals. Therefore, there is an imperative need to implement an efficient automatic diagnosis system to alleviate COVID‐19 spreading among people. This article presents a discussion of the utilization of convolutional neural network (CNN) models with different learning strategies for automatic COVID‐19 diagnosis. First, we consider the CNN‐based transfer learning approach for automatic diagnosis of COVID‐19 from X‐ray images with different training and testing ratios. Different pre‐trained deep learning models in addition to a transfer learning model are considered and compared for the task of COVID‐19 detection from X‐ray images. Confusion matrices of these studied models are presented and analyzed. Considering the performance results obtained, ResNet models (ResNet18, ResNet50, and ResNet101) provide the highest classification accuracy on the two considered datasets with different training and testing ratios, namely 80/20, 70/30, 60/40, and 50/50. The accuracies obtained using the first dataset with 70/30 training and testing ratio are 97.67%, 98.81%, and 100% for ResNet18, ResNet50, and ResNet101, respectively. For the second dataset, the reported accuracies are 99%, 99.12%, and 99.29% for ResNet18, ResNet50, and ResNet101, respectively. The second approach is the training of a proposed CNN model from scratch. The results confirm that training of the CNN from scratch can lead to the identification of the signs of COVID‐19 disease.
Keywords: chest X‐ray radiographs, Coronavirus, deep learning, pre‐trained convolutional neural network
An artificial intelligence (AI) system using different learning strategies of classification is developed in this paper for biomedical images.
It effectively classifes COVID‐19 and normal cases from chest X‐ray images.
This system has potential to be applied for generalized high‐impact applications in biomedical image processing.
1. INTRODUCTION
In recent days, the Coronavirus infection has spread worldwide. It was announced as a pandemic by the World Health Organization (WHO, 2020). The standard COVID‐19 diagnosis test, namely the polymerase chain reaction (PCR), is restricted. Particularly, the PCR test needs significant time (in the range of days) to diagnose COVID‐19. Furthermore, PCR accuracy concerns have been raised by several countries (W. Wang, Xu, et al., 2020). In several countries around the world, whether developed or developing alike, the health system has been overwhelmed and might have reached a state of collapse as a result of the increasing demand for intensive care units. This calls for an accurate automatic COVID‐19 diagnosis system that essentially gives the evolving COVID‐19 situation around the world.
Chest X‐ray images are of the most widely‐used visual media for the diagnosis purpose. Specifically, these images have a relatively low cost, and are available in most hospitals (Chowdhury, Alzoubi, et al., 2019; Chowdhury, Khandakar, et al., 2019; Kallianos et al., 2019; Tahir et al., 2020). However, COVID‐19 diagnosis using X‐ray images is a challenging task due to the increase of the infected cases, daily. Hence, reading a lot of X‐ray images by radiologists is a huge and time‐consuming burden. Artificial intelligence (AI) can make a contribution in this regard. Recent studies managed to realize remarkable results concerned with the automatic diagnosis of COVID‐19 from X‐Ray images (Apostolopoulos & Mpesiana, 2020; Narin, Kaya, & Pamuk, 2020; Sethy & Behera, 2020).
Deep learning has been investigated in the last decade as an automatic feature extraction and classification tool. It has been widely used on medical images including X‐ray images (Chen et al., 2019; Gao, Yoon, Wu, & Chu, 2020; Kim et al., 2020). Recently, deep convolutional neural networks (DCNNs) have spread widely in the machine learning domain. The image features are extracted automatically, by using convolutional and pooling layers (Goodfellow, Bengio, & Courville, 2016). The DCNN models have been exploited in several applications, such as image classification and pattern recognition (Dorj, Lee, Choi, & Lee, 2018; Kassani & Kassani, 2019; Ribli, Horváth, Unger, Pollner, & Csabai, 2018; Saba, Mohamed, El‐Affendi, Amin, & Sharif, 2020; Zhou, 2020).
In this article, we present an automatic COVID‐19 diagnosis system using two strategies. The first one depends on pre‐trained transfer learning models, where chest X‐ray images are used as input. For this aim, we use AlexNet, GoogleNet, Inceptionv3, InceptionresNetv2, SqueezeNet, DenseNet201, ResNet18, ResNet50, ResNet101, VGG16 and VGG19 pre‐trained models to obtain high detection accuracies. The second strategy depends on training a CNN that is called, CONV‐COVID‐net from scratch for COVID‐19 detection. In addition, we compare the obtained results for the different deep learning models with different training and testing ratios.
2. RELATED WORKS
There are several AI systems that have been suggested for COVID‐19 diagnosis from X‐ray and CT images. Several studies investigated the feasibility of X‐ray and CT scans, when suitable image processing tools are employed to detect COVID‐19. X‐ray machines are utilized to scan the affected body similar to what is done with pneumonia and tumors.
A deep learning model for COVID‐19 detection with neural network (COVNet) has been used in Li et al. (2020) to extract visual features from volumetric chest CT scans for detecting COVID‐19. This model has been tested using a dataset, which has been gathered from six hospitals between August 2016 and February 2020. It achieved 96% for the area under the receiver operating characteristic (ROC) curve. Ghoshal and Tucker (2020) used the drop‐weights‐based Bayesian convolutional neural networks (BCNNs) in order to account for uncertainty in deep learning solutions for improving the diagnostic performance of the human‐machine combination on the available COVID‐19 chest X‐ray dataset. However, their paper revealed an accuracy of 89.92%.
He et al. (2016) presented an algorithm for COVID‐19 detection, in which a location‐attention network and ResNet18 (Nadeem et al., 2020) are used for the classification purpose. Their algorithm was tested on a dataset of 618 CT samples: 219 for COVID‐19 patients, 224 for viral pneumonia patients, and 175 for normal people. Their algorithm reported an accuracy of 86.7%. A modified inception transfer‐learning model was used in Narin et al. (2020) for COVID‐19 detection. Their model was tested on a dataset of 1,065 CT samples: 325 for COVID‐19 patients and 740 for viral pneumonia patients. They reported 79.3%, 83% and 67% for accuracy, specificity and sensitivity, respectively.
Wang et al. (2020) introduced a DCNN model, namely COVID‐Net for COVID‐19 detection. This model has been examined on a dataset of 16,756 chest X‐ray images for 13,645 patients. Their study achieved an average accuracy of 92.4%. The pre‐trained ResNet50 has been used by Wang et al. (2020) for COVID‐19 detection. A dataset of 100 chest X‐ray images; 50 for COVID‐19 patients and 50 for normal people, has been used to examine the model. This model reported an accuracy of 98%. Apostolopoulos and Mpesiana (2020) presented an automatic COVID‐19 detection system from X‐ray images with CNN‐based transfer learning. This system reported an accuracy of 96.78%, a sensitivity of 98.66%, and a specificity of 96.46%.
Hemdan et al. (2020) presented a CNN model that is called COVIDX‐Net for COVID‐19 detection from X‐ray images. They achieved an accuracy of 90%. Their model was tested on a dataset of 50 X‐ray samples: 25 for COVID‐19 patients and 25 for normal people. Sethy and Behera (2020) proposed a deep learning model to collect features from medical images, and then classify them with a support vector machine (SVM) classifier. They reported an accuracy of 95%. Wang et al. (2020) reported an accuracy equal to 86% with a deep learning model derived from the ResNet50 model. Ozturk et al. (2020) proposed the DarkCovid‐Net deep learning model for COVID‐19 detection. They reported accuracies of 98% and 87% on two datasets. Brunese et al. (2020) presented a transfer learning model derived from the VGG16 model for COVID‐19 detection from X‐ray images. They reported an average accuracy of 97%.
3. STATE‐OF‐THE‐ART CNNS FOR TRANSFER LEARNING
In this section, we clarify some of the existing state‐of‐the‐art DCNN models that can be used for COVID‐19 detection.
AlexNet is one of the most widely‐used CNN models in computer vision applications. It consists of 5 convolutional layers followed by 3 max‐pooling layers and 2 normalization layers in addition to 2 fully‐connected (FC) layers, and 1 softmax layer. The AlexNet achieves the target of image down‐sampling through the max‐pooling strategy. The final stage output in this type of networks is reformulated into vector form to be fed to the FC layer in order to get the final classification results (Simonyan & Zisserman, 2014).
VGG is another convolutional neural network with a deeper structure. The main feature of this type of networks is the utilization of small convolution masks. The final convolutional layer in the VGG hierarchy is followed by 2 FC layers rather than one. The output of the final layer gives the classification results. The models used in our experiments are the 16‐layer and 19‐layer VGG networks (Qassim, Verma, & Feinzimer, 2018; Zu et al., 2020).
GoogLeNet adopts the inception concept. Both Inceptionv3 and InceptionresNetv2 are considered. A sequence of operations is adopted depending on channel re‐projection, spatial convolution, and pooling operations. The main feature of this structure is the large convolution masks. Hence, the parameter space is reduced. This structure is also deeper than AlexNet and VGG. Another distinctive feature is the reduced computational complexity and the less dimensional space (Alom, Hasan, Yakopcic, & Taha, 2017; Ballester & Araujo, 2016; Parente & Ferreira, 2018).
SqueezeNet depends on projection. The main feature of this network is the reduction of the parameter space and computational complexity. It gives less features with 3 × 3 convolution masks. Squeeze layers, and identity‐mapping shortcut connections are used to achieve stable training with a deeper network structure. Global average pooling is adopted in the final convolution map, and then the output is fed to the FC layer. The SqueezeNet is exploited to give a performance comparable to that of AlexNet (Pradeep et al. 2018).
ResNet is based on residual learning not original signal learning. The residuals maintain much details of the images. Some layers are skipped in this structure. This network reduces the complexity of the training process. It is much deeper than the above‐mentioned networks. The fully‐connected layer is eliminated, while maintaining only global average pooling. It is expected to yield the best classification results due to the large depth of the network. The models used in our experiments are the ResNet18, ResNet50, and ResNet101 (Alom et al., 2018; Ghosal et al., 2019; Wu et al., 2019).
DensNet resembles the ResNet. Multiple feature maps from all layers are fed into the subsequent layers. The vanishing gradient problem is eliminated. Good representation of features is achieved based on the feature reuse principle (Haupt et al., 2018).
4. PROPOSED PRE‐TRAINING ‐BASED TRANSFER LEARNING APPROACH
All above‐mentioned networks will be used in the classification scenario recommended in this article. Deep learning from scratch is a tedious task requiring labeling and division of the data. To eliminate the large burden of this task, transfer learning is appropriate. In transfer learning, minimal changes are induced in the deep pre‐trained networks according to the characteristics of the input. The block diagram of the CNN including pre‐training‐based transfer learning models for COVID‐19 detection is presented in Figure 1.
FIGURE 1.
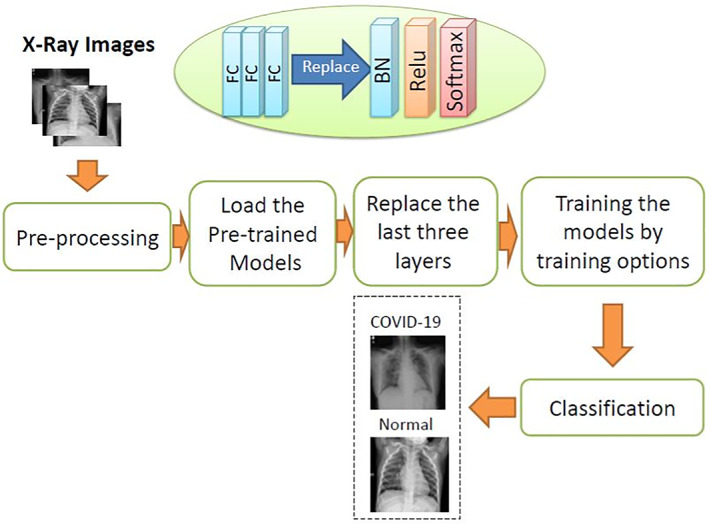
Block diagram of the proposed pre‐trainng‐based transfer learning approach
Table 1 presents the image input size and training options for the pre‐trained models presented in this article. The utilized dataset is randomly divided into two datasets with 80/20, 70/30, 60/40, and 50/50 ratios for training and testing, respectively. The pre‐trained models are loaded and the last three FC layers are replaced with batch normalization (BN), rectified linear unit (ReLU), and softmax layers. The training options used in this article proved their success in controlling the degradation problem, as well as providing the required convergence with few iterations. Stochastic gradient descent (SGD) algorithm is used for training due to its good convergence and low running time. The ReLU is used to activate all convolutional layers.
TABLE 1.
Training options for different pre‐trained models
| Training options (random initialization weights, batch size = 32, learning rate = 0.00001 and number of epochs = 10) | ||
|---|---|---|
| Model | Input size | No. of layers |
| AlexNet (Simonyan & Zisserman, 2014) | 227 × 227 | 8 |
| GoogleNet (Ballester & Araujo, 2016) | 224 × 224 | 22 |
| InceptionV3 (Parente & Ferreira, 2018) | 299 × 299 | 48 |
| InceptionresNetV2 (Alom et al., 2017) | 299 × 299 | 164 |
| SqueezeNet (Pradeep et al., 2018) | 227 × 227 | 18 |
| DenseNet201 (Haupt et al., 2018) | 224 × 224 | 201 |
| ResNet18 (Wu et al., 2019) | 224 × 224 | 18 |
| ResNet50 (Alom et al., 2018) | 224 × 224 | 50 |
| ResNet101 (Ghosal et al., 2019) | 224 × 224 | 101 |
| VGG16 (Zu et al., 2020) | 224 × 224 | 16 |
| VGG19 (Qassim et al., 2018) | 224 × 224 | 19 |
The final task of the proposed approach is the utilization of a tuned classifier in order to classify image batches to COVID‐19 or normal cases.
5. PROPOSED CONV‐COVID‐NET MODEL
In another attempt, a model is built from scratch for the classification task. It consists of different types of layers including an input layer, convolutional layers, pooling layers, FC layers, and an output layer. The proposed DCNN architecture used in this article is shown in Figure 2. It has the following architecture:
FIGURE 2.
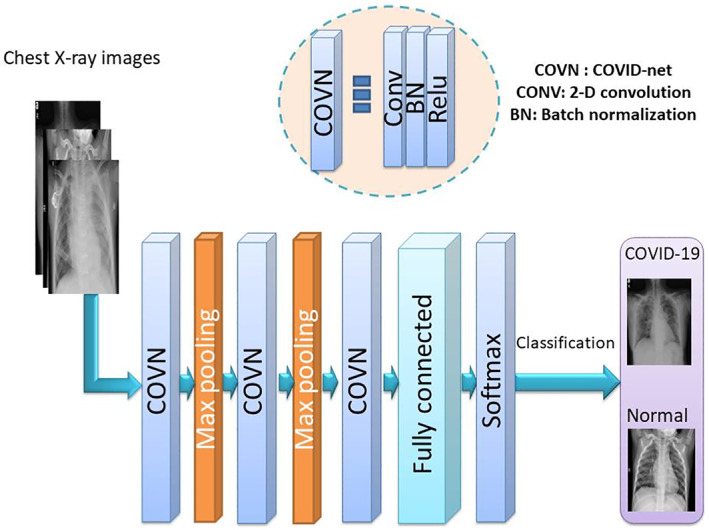
Block diagram of the proposed CONV‐COVID‐net model
Input layer: The X‐ray images are resized to the dimensions of 244 × 244 and used as input.
COVN layers: They consist of three layers: convolutional (Conv) layer, BN layer and ReLU layer. The convolution stage depends on 2‐D masks to be convolved with the input images. We perform three convolutions over the input images using multiple filters (8, 16, and 32) for the first, second and third Conv layers, respectively, with a fixed window size of 3. After that, the BN layer is implemented to eliminate the overfitting problem. The ReLU activation function induces some sort of non‐linearity for better operation of subsequent layers.
Pooling layer: The pooling layer is implemented to reduce the amount of extracted features. Max‐pooling is adopted to represent the variations of local activity levels. It reveals edges in detail. The maximum values obtained correspond majorly to edges. X‐ray images have much details. Pooling is implemented with a 2 × 2 window and a stride of 2.
FC layers: An FC layer is a normal neural network that gives the final classification decision. Softmax activation is adopted in an FC layer to classify the input images into two classes.
6. PERFORMANCE METRICS
The confusion matrix has foursome expected outcomes. True positive (T p ) is the number of correctly diagnosed anomalous cases. True negative (T n ) is the number of correctly identified normal cases. False positive (F p ) is the set of normal cases, which are classified as anomalous cases. False negative (F n ) is the set of anomalous cases observed as normal cases.
The overall performance of each deep learning classifier is evaluated based on sensitivity (Sen), specificity (Spec), accuracy (Acc), precision (Preci), mis‐classification rate (M r ), and false positive rate (F pr ) (Jensen et al., 1996; Taha & Hanbury, 2015).
Sensitivity is given by:
| (1) |
Specificity is given by:
| (2) |
Accuracy is given by:
| (3) |
Precision is given as:
| (4) |
Mis‐classification rate shows the number of false classified labels divided by the total number of test images, and it is defined as:
| (5) |
False positive rate is given by:
| (6) |
7. DATASET DESCRIPTION
The proposed deep learning models are tested on two different datasets. The first dataset (Github, 2020) contains 70 X‐ray images for normal persons and 60 X‐ray images for COVID‐19 patients. The second dataset (Mendeley, 2020) contains 912 X‐ray images for normal persons and 912 X‐ray images for COVID‐19 patients. Figure 3 presents X‐ray samples for COVID‐19 and normal cases from the second dataset (Mendeley, 2020).
FIGURE 3.
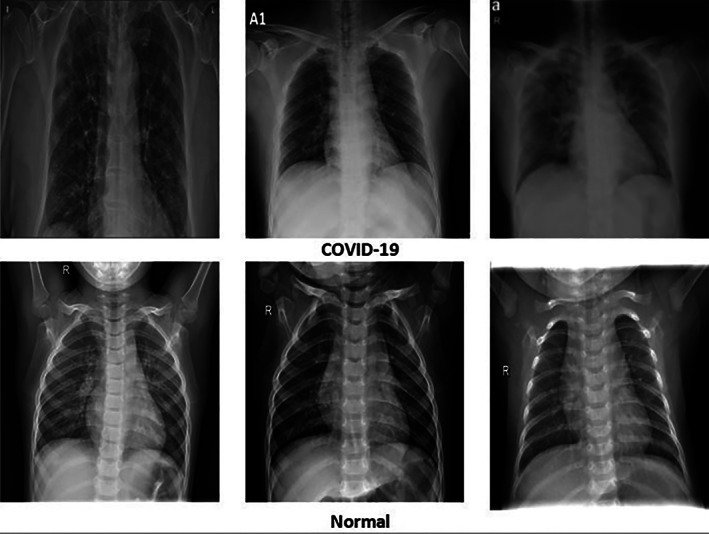
X‐ray images for COVID‐19 and normal cases (Mendeley, 2020)
8. SIMULATION RESULTS
Simulation experiments have been implemented to test the performance of the studied pre‐training‐based transfer learning models and the model built from scratch. These models have been tested on the two above‐mentioned datasets. Four different strategies have been adopted in the tests with 80/20, 70/30, 60/40 and 50/50 training/testing ratios.
Table 2 gives the evaluation metrics on the first dataset for all networks for the 80/20 training/testing ratio. It is clear from this table that the best performance is achieved with the ResNet101 due to its large depth and ability to model highly‐complex shapes. Table 3 gives the results of a similar study performed on the second dataset. From this table, it is clear that the ResNet101 keeps its outstanding performance on the large dataset. This reflects the inherent nature of the ResNet to model different shapes on a large dataset.
TABLE 2.
Performance results obtained with 80/20 training/testing ratio using different pre‐trained models on the first dataset
| Evaluation metric | ||||||
|---|---|---|---|---|---|---|
| Models | ACC | SEN | SPEC | Preci | Mr | Fpr |
| AlexNet | 0.9490 | 0.9796 | 0.9184 | 0.9231 | 0.0510 | 0.0816 |
| DenseNet201 | 0.9694 | 0.9388 | 1.0000 | 1.0000 | 0.0306 | 0 |
| GoogleNet | 0.9286 | 0.9592 | 0.8980 | 0.9038 | 0.0714 | 0.1020 |
| InceptionresNetv2 | 0.9592 | 0.9796 | 0.9388 | 0.9412 | 0.0408 | 0.0612 |
| Inceptionv3 | 0.9592 | 0.9796 | 0.9388 | 0.9412 | 0.0408 | 0.0612 |
| ResNet18 | 0.9184 | 0.8367 | 1.0000 | 1.0000 | 0.0816 | 0 |
| ResNet50 | 0.9592 | 0.9796 | 0.9388 | 0.9412 | 0.0408 | 0.0612 |
| ResNet101 | 0.9796 | 0.9796 | 0.9796 | 0.9796 | 0.0204 | 0.0204 |
| SqueezeNet | 0.9694 | 0.9388 | 1.0000 | 1.0000 | 0.0306 | 0 |
| VGG16 | 0.9798 | 0.9796 | 1.0000 | 1.0000 | 0.0102 | 0 |
| VGG19 | 0.9796 | 0.9592 | 1.0000 | 1.0000 | 0.0204 | 0 |
TABLE 3.
Performance results obtained with 80/20 training/testing ratio using different pre‐trained models on the second dataset
| Evaluation metric | ||||||
|---|---|---|---|---|---|---|
| Models | ACC | SEN | SPEC | Preci | Mr | Fpr |
| AlexNet | 0.9788 | 0.9753 | 0.9822 | 0.9821 | 0.0212 | 0.0178 |
| DenseNet201 | 0.9911 | 1.0000 | 0.9822 | 0.9825 | 0.0089 | 0.0178 |
| GoogleNet | 0.9712 | 0.9808 | 0.9616 | 0.9624 | 0.0288 | 0.0384 |
| InceptionresNetv2 | 0.9877 | 0.9863 | 0.9890 | 0.9890 | 0.0123 | 0.0110 |
| Inceptionv3 | 0.9836 | 0.9945 | 0.9726 | 0.9732 | 0.0164 | 0.0274 |
| ResNet18 | 0.9842 | 0.9849 | 0.9836 | 0.9836 | 0.0158 | 0.0164 |
| ResNet50 | 0.9913 | 1.0000 | 0.9877 | 0.9878 | 0.0062 | 0.0123 |
| ResNet101 | 0.9918 | 0.9945 | 0.9890 | 0.9891 | 0.0082 | 0.0110 |
| SqueezeNet | 0.9678 | 0.9507 | 0.9849 | 0.9844 | 0.0322 | 0.0151 |
| VGG16 | 0.9575 | 0.9370 | 0.9781 | 0.9771 | 0.0425 | 0.0219 |
| VGG19 | 0.9603 | 0.9808 | 0.9397 | 0.9421 | 0.0397 | 0.0603 |
For 70/30 training/testing ratio, the results of all networks are given in Tables 4 and 5 on the first and second datasets, respectively. From both tables, the ResNet101 is still the best network in performance. In addition, the metric values are enhanced due to the utilization of the optimum ratio for training and testing adopted in most deep learning models.
TABLE 4.
Performance results obtained with 70/30 training/testing ratio using different pre‐trained models on the first dataset
| Evaluation metric | ||||||
|---|---|---|---|---|---|---|
| Models | ACC | SEN | SPEC | Preci | Mr | Fpr |
| AlexNet | 0.9651 | 0.9767 | 0.9535 | 0.9545 | 0.0349 | 0.0465 |
| DenseNet201 | 0.9651 | 0.9767 | 0.9535 | 0.9545 | 0.0349 | 0.0465 |
| Googlenet | 0.9535 | 0.9535 | 0.9535 | 0.9535 | 0.0465 | 0.0465 |
| InceptionresNetv2 | 0.9535 | 0.9535 | 0.9535 | 0.9535 | 0.0465 | 0.0465 |
| Inceptionv3 | 0.9767 | 0.9767 | 0.9767 | 0.9767 | 0.0233 | 0.0233 |
| ResNet18 | 0.9767 | 0.9535 | 1.0000 | 1.0000 | 0.0233 | 0 |
| ResNet50 | 0.9851 | 0.9867 | 0.9835 | 0.9845 | 0.0149 | 0.0465 |
| ResNet101 | 1.0000 | 1.0000 | 1.0000 | 1.0000 | 0.0 | 0.0 |
| SqueezeNet | 0.9767 | 0.9535 | 1.0000 | 1.0000 | 0.0233 | 0 |
| VGG16 | 0.9535 | 0.9767 | 0.9302 | 0.9333 | 0.0465 | 0.0698 |
| VGG19 | 0.9651 | 0.9535 | 0.9767 | 0.9762 | 0.0349 | 0.0233 |
TABLE 5.
Performance results obtained with 70/30 training/testing ratio using different pre‐trained models on the second dataset
| Evaluation metric | ||||||
|---|---|---|---|---|---|---|
| Models | ACC | SEN | SPE | Preci | Mr | Fpr |
| AlexNet | 0.9859 | 0.9812 | 0.9906 | 0.9905 | 0.0141 | 0.0094 |
| DenseNet201 | 0.9914 | 1.0000 | 0.9828 | 0.9831 | 0.0086 | 0.0172 |
| Googlenet | 0.9765 | 0.9765 | 0.9765 | 0.9765 | 0.0235 | 0.0235 |
| InceptionresNetv2 | 0.9906 | 0.9984 | 0.9828 | 0.9830 | 0.0094 | 0.0172 |
| Inceptionv3 | 0.9922 | 0.9890 | 0.9953 | 0.9953 | 0.0078 | 0.0047 |
| ResNet18 | 0.99 | 0.9984 | 0.9436 | 0.9465 | 0.0290 | 0.0564 |
| ResNet50 | 0.9912 | 0.9859 | 1.0000 | 1.0000 | 0.0071 | 0 |
| ResNet101 | 0.9929 | 0.9884 | 0.9937 | 0.9938 | 0.0039 | 0.0063 |
| SqueezeNet | 0.9765 | 0.9890 | 0.9639 | 0.9639 | 0.0235 | 0.0361 |
| VGG16 | 0.9444 | 0.9028 | 0.9859 | 0.9846 | 0.0556 | 0.0141 |
| VGG19 | 0.9647 | 0.9514 | 0.9781 | 0.9775 | 0.0353 | 0.0219 |
To generalize this study, we have investigated the training/testing ratios of 60/40 and 50/50. The results of these experiments are given in Tables 6, 7, 8, and 9. From these tables, it is clear that the ResNet101 is still the best in performance, but it is not recommended to use training/testing ratios rather than 70/30.
TABLE 6.
Performance results obtained with 60/40 training/testing ratio using different pre‐trained models on the first dataset
| Evaluation metric | ||||||
|---|---|---|---|---|---|---|
| Models | ACC | SEN | SPEC | Preci | Mr | Fpr |
| AlexNet | 0.9459 | 0.9730 | 0.9189 | 0.9231 | 0.0541 | 0.0811 |
| DenseNet201 | 0.9730 | 0.9730 | 0.9730 | 0.9730 | 0.0270 | 0.0270 |
| GoogleNet | 0.9595 | 0.9459 | 0.9730 | 0.9722 | 0.0405 | 0.0270 |
| InceptionresNetv2 | 0.9595 | 0.9730 | 0.9459 | 0.9474 | 0.0405 | 0.0541 |
| Inceptionv3 | 0.9730 | 0.9730 | 0.9730 | 0.9730 | 0.0270 | 0.0270 |
| ResNet18 | 0.9865 | 0.9730 | 1.0000 | 1.0000 | 0.0135 | 0 |
| ResNet50 | 0.9865 | 0.9730 | 1.0000 | 1.0000 | 0.0135 | 0 |
| ResNet101 | 0.9875 | 0.9730 | 1.0000 | 1.0000 | 0.0135 | 0 |
| SqueezeNet | 0.9595 | 0.9459 | 0.9730 | 0.9722 | 0.0405 | 0.0270 |
| VGG16 | 0.9730 | 0.9730 | 0.9730 | 0.9730 | 0.0270 | 0.0270 |
| VGG19 | 0.9730 | 0.9459 | 1.0000 | 1.0000 | 0.0270 | 0 |
TABLE 7.
Performance results obtained with 50/50 training/testing ratio using different pre‐trained models on the first dataset
| Evaluation metric | ||||||
|---|---|---|---|---|---|---|
| Models | ACC | SEN | SPEC | Preci | Mr | Fpr |
| AlexNet | 0.9667 | 0.9667 | 0.9667 | 0.9667 | 0.0333 | 0.0333 |
| DenseNet201 | 0.9833 | 0.9667 | 1.0000 | 1.0000 | 0.0167 | 0 |
| GoogleNet | 0.9500 | 0.9000 | 1.0000 | 1.0000 | 0.0500 | 0 |
| InceptionresNetv2 | 0.9667 | 0.9667 | 0.9667 | 0.9667 | 0.0333 | 0.0333 |
| Inceptionv3 | 0.9667 | 0.9667 | 0.9667 | 0.9667 | 0.0333 | 0.0333 |
| ResNet18 | 0.9500 | 0.9000 | 1.0000 | 1.0000 | 0.0500 | 0 |
| ResNet50 | 0.9833 | 0.9667 | 1.0000 | 1.0000 | 0.0167 | 0 |
| ResNet101 | 0.9853 | 0.9667 | 1.0000 | 1.0000 | 0.0167 | 0 |
| SqueezeNet | 0.9667 | 0.9667 | 0.9667 | 0.9667 | 0.0333 | 0.0333 |
| VGG16 | 0.9833 | 0.9667 | 1.0000 | 1.0000 | 0.0167 | 0 |
| VGG19 | 0.9833 | 0.9667 | 1.0000 | 1.0000 | 0.0167 | 0 |
TABLE 8.
Performance results obtained with 60/40 training/testing ratio using different pre‐trained models on the second dataset
| Evaluation metric | ||||||
|---|---|---|---|---|---|---|
| Models | ACC | SEN | SPEC | Preci | Mr | Fpr |
| AlexNet | 0.9762 | 0.9580 | 0.9945 | 0.9943 | 0.0238 | 0.0055 |
| DenseNet201 | 0.9954 | 0.9945 | 0.9963 | 0.9963 | 0.0046 | 0.0037 |
| GoogleNet | 0.9808 | 0.9689 | 0.9927 | 0.9925 | 0.0192 | 0.0073 |
| InceptionresNetv2 | 0.9918 | 0.9890 | 0.9945 | 0.9945 | 0.0082 | 0.0055 |
| Inceptionv3 | 0.9899 | 0.9890 | 0.9909 | 0.9908 | 0.0101 | 0.0091 |
| ResNet18 | 0.9899 | 0.9909 | 0.9890 | 0.9891 | 0.0101 | 0.0101 |
| ResNet50 | 0.9918 | 0.9982 | 1.0000 | 1.0000 | 0.0009 | 0 |
| ResNet101 | 0.9919 | 0.9982 | 0.9854 | 0.9856 | 0.0082 | 0.0146 |
| SqueezeNet | 0.9781 | 0.9909 | 0.9653 | 0.9661 | 0.0219 | 0.0347 |
| VGG16 | 0.9634 | 0.9726 | 0.9543 | 0.9551 | 0.0366 | 0.0457 |
| VGG19 | 0.9762 | 0.9872 | 0.9653 | 0.9660 | 0.0238 | 0.0347 |
TABLE 9.
Performance results obtained with 50/50 training/testing ratio using different pre‐trained models on the second dataset
| Evaluation metric | ||||||
|---|---|---|---|---|---|---|
| Models | ACC | SEN | SPEC | Preci | Mr | Fpr |
| AlexNet | 0.9485 | 1.0000 | 0.8969 | 0.9066 | 0.0515 | 0.1031 |
| DenseNet201 | 0.9856 | 1.0000 | 0.9912 | 0.9913 | 0.0044 | 0.0088 |
| GoogleNet | 0.9846 | 0.9759 | 0.9934 | 0.9933 | 0.0154 | 0.0066 |
| InceptionresNetv2 | 0.9867 | 0.9956 | 0.9978 | 0.9978 | 0.0033 | 0.0022 |
| Inceptionv3 | 0.99.05 | 0.9868 | 0.9956 | 0.9956 | 0.0088 | 0.0044 |
| ResNet18 | 0.9857 | 0.9890 | 0.9825 | 0.9826 | 0.0143 | 0.0175 |
| ResNet50 | 0.9916 | 0.9853 | 0.0000 | 1.0000 | 1.0000 | 0 |
| ResNet101 | 0.9918 | 0.9978 | 0.9934 | 0.9934 | 0.0044 | 0.0066 |
| SqueezeNet | 0.9836 | 0.9912 | 0.9759 | 0.9762 | 0.0164 | 0.0241 |
| VGG16 | 0.9682 | 0.9825 | 0.9539 | 0.9552 | 0.0318 | 0.0461 |
| VGG19 | 0.9441 | 0.8904 | 0.9978 | 0.9975 | 0.0559 | 0.0022 |
For more illustration of the results, we present a comparison between ResNet models considering the confusion matrices and accuracy levels. Figures 4 and 5 present the confusion matrices for the highest performance models on the first and second datasets, respectively. It is clear from these figures that the best performance is achieved with ResNet101 due to its depth. The accuracy values are presented in Figures 6 and 7 for different training/testing ratios on the first and second datasets, respectively. The ResNet101 still has the best performance for all training/testing ratios. Moreover, it has the highest performance with 70/30 training/testing ratio. The 70/30 ratio is the optimum ratio that is adopted with most deep learning models (Draelos, 2019; Liu & Cocea, 2017).
FIGURE 4.
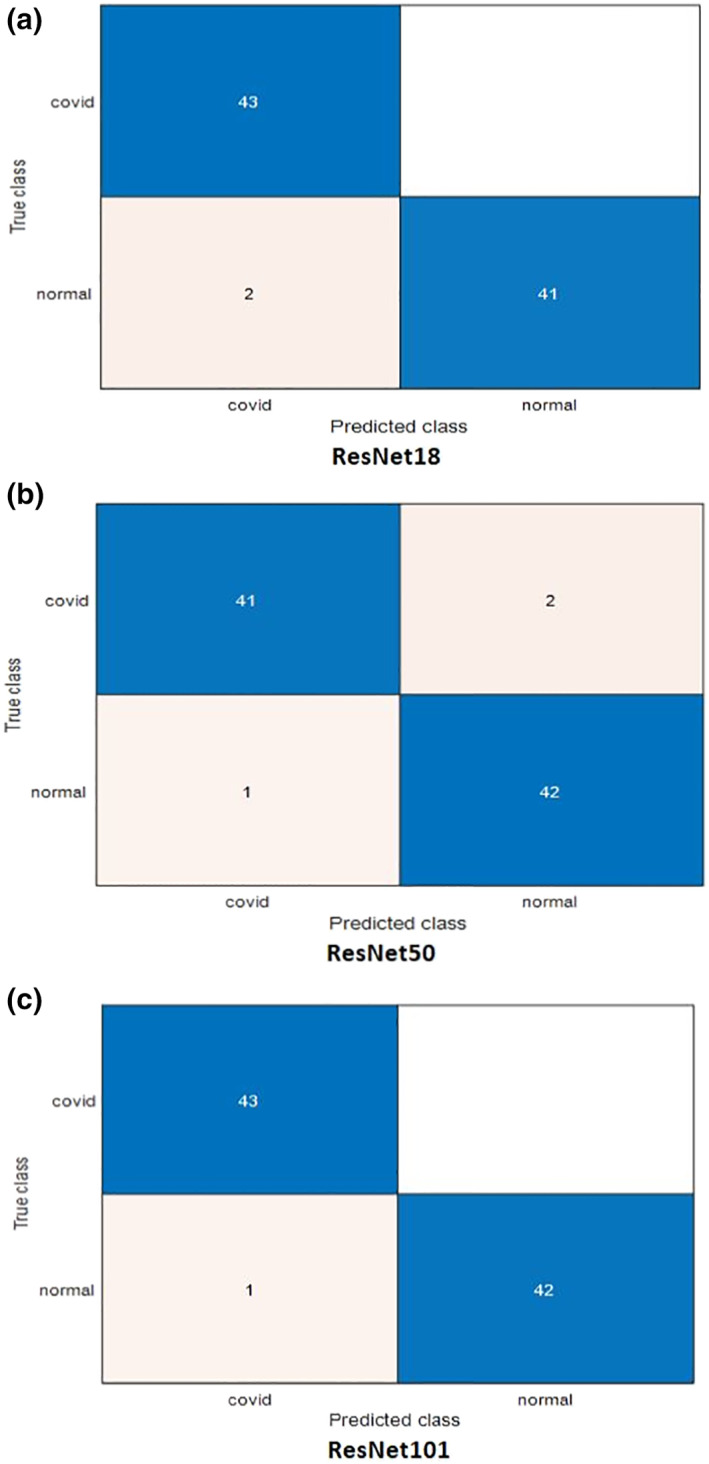
Confusion matrices for the highest performance pre‐trained models used for COVID‐19 detection on the first dataset
FIGURE 5.
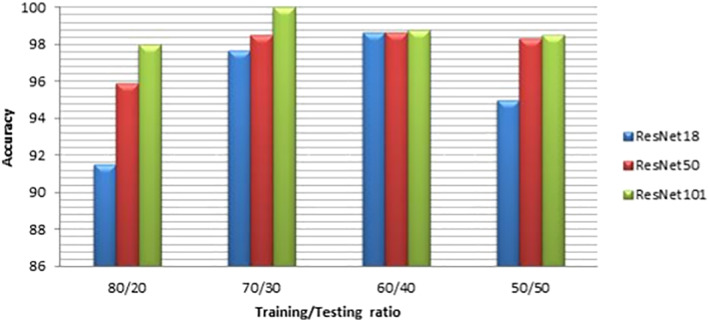
Accuracies of the highest performance models with different training/testing ratios on the first dataset
FIGURE 6.
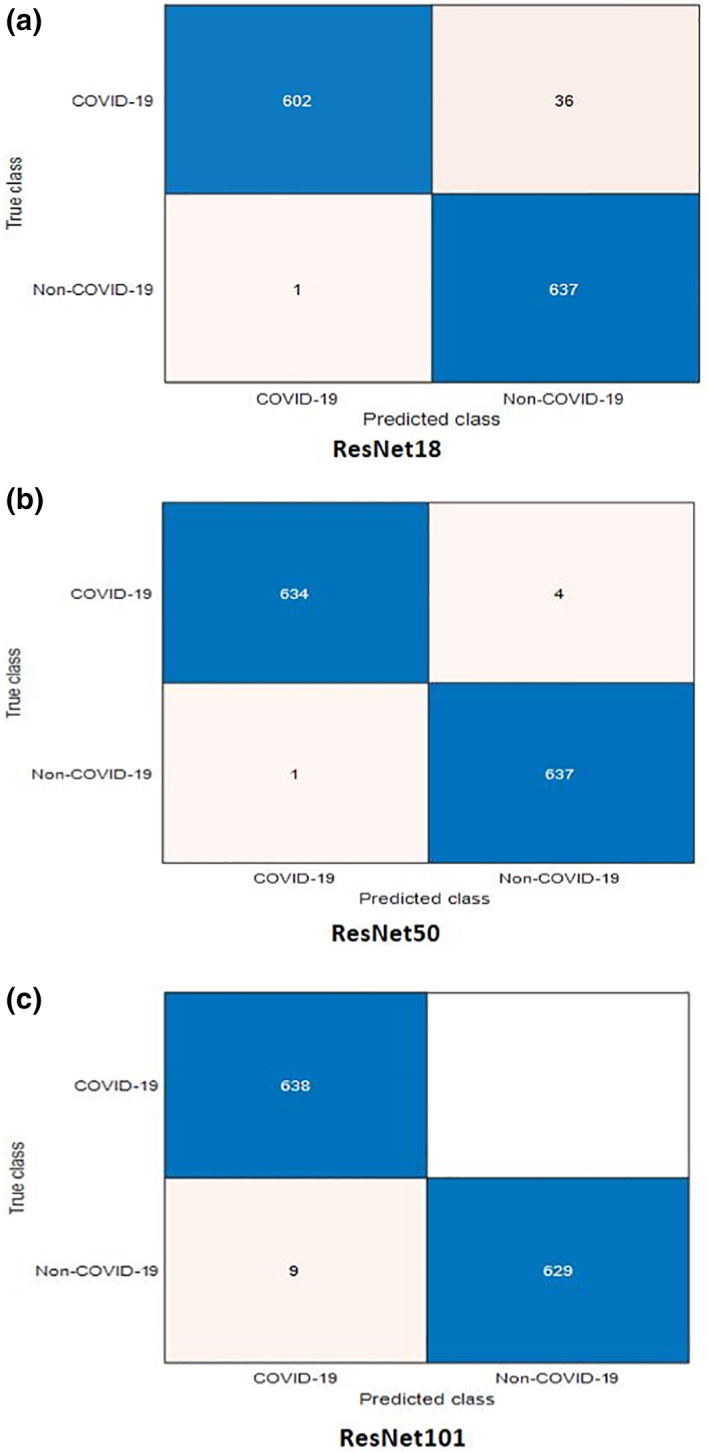
Confusion matrices for the highest performance pre‐trained models used for COVID‐19 detection on the second dataset
FIGURE 7.
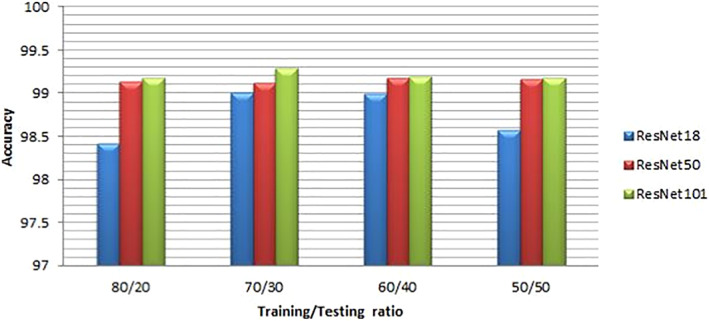
Accuracies of the highest performance models with different training/testing ratios on the second dataset
Therefore, we recommend the ResNet101 model to be applied for COVID‐19 detection from X‐ray images with 70/30 training/testing ratio. ResNet101 model is an improved version of CNNs. As the network gets deeper and more complex, ResNet101 prevents the distortion that may occur in features. Moreover, the ResNet101 model depends on residual blocks to allow faster training.
In addition, the model from scratch has been tested on both datasets, and the results are given in Tables 10 and 11. Figures 8 and 9 reveal the behavior of both accuracy and loss of the CNN model built from scratch on the first and second datasets, respectively. The validation accuracy gets increased in synchronization with the training accuracy. In addition, the validation loss is decreased in synchronization with the training loss. The adopted loss function is the minimum mean square error (MSE). The optimizer used is the Adam's optimizer. Distance minimization strategy is adopted based on the MSE. All these observations confirm that the proposed model achieves good performance in terms of accuracy and loss, even if the used data is not large enough.
TABLE 10.
Performance results obtained from CONV‐COVID‐net with different training/testing ratios on the first dataset
| Training/testing ratio (%) | Evaluation metric | ||||||
|---|---|---|---|---|---|---|---|
| Training | Testing | ACC | SEN | SPEC | Preci | Mr | Fpr |
| 80 | 20 | 0.9031 | 1.0000 | 0.8333 | 0.8750 | 0.0769 | 0.1667 |
| 70 | 30 | 0.9183 | 0.8432 | 0.8955 | 0.9083 | 0 | 0 |
| 60 | 40 | 0.9008 | 1.0000 | 0.9083 | 0.9155 | 0.0192 | 0.0417 |
| 50 | 50 | 0.9231 | 0.9429 | 0.9000 | 0.9167 | 0.0769 | 0.1000 |
TABLE 11.
Performance results obtained from CONV‐COVID‐net with different training/testing ratios on the second dataset
| Training/testing ratio (%) | Evaluation metric | ||||||
|---|---|---|---|---|---|---|---|
| Training | Testing | ACC | SEN | SPEC | Preci | Mr | Fpr |
| 80 | 20 | 0.9396 | 0.9615 | 0.9176 | 0.9211 | 0.0604 | 0.0824 |
| 70 | 30 | 0.9398 | 0.9489 | 0.9307 | 0.9319 | 0.0602 | 0.0693 |
| 60 | 40 | 0.9301 | 0.8986 | 0.9616 | 0.9591 | 0.0699 | 0.038 |
| 50 | 50 | 0.9211 | 0.8925 | 0.9496 | 0.9465 | 0.0789 | 0.0504 |
FIGURE 8.
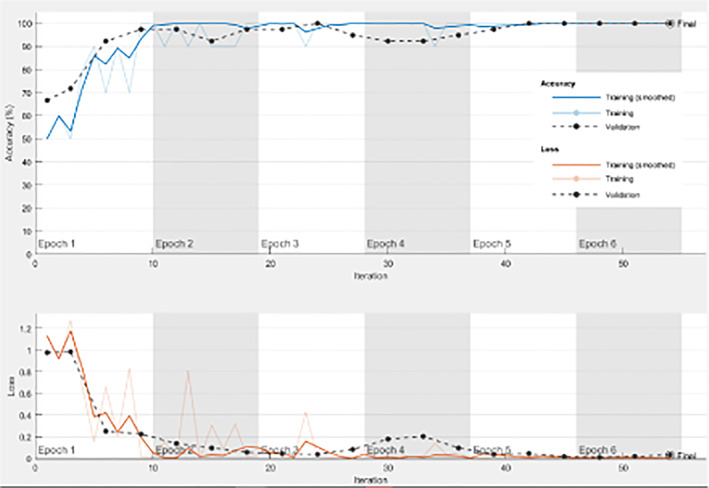
Training progress with 70/30 training/testing ratio on the first dataset
FIGURE 9.
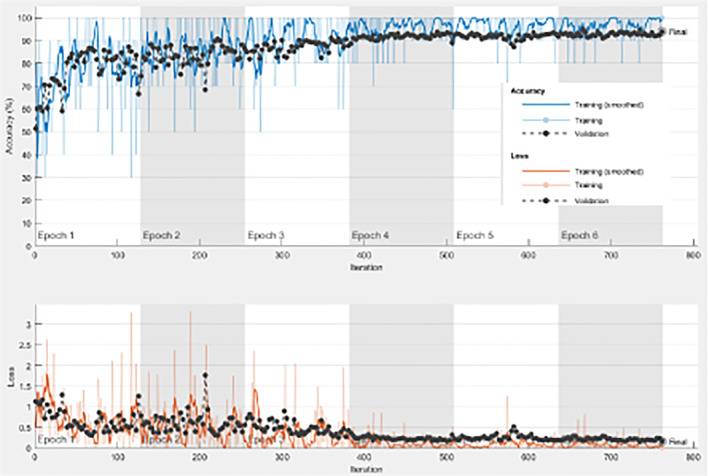
Training progress with 70/30 training/testing ratio on the second dataset
8.1. Comparison with state‐of‐the‐art methods
Table 12 presents the results for some state‐of‐the‐art methods used for COVID‐19 detection. It is clear that the proposed approach based on transfer learning outperforms the other methods from the accuracy perspective.
TABLE 12.
Comparison with state‐of‐the‐art methods
| Method | Images | COVID‐19 | Normal | Accuracy |
|---|---|---|---|---|
| Apostolopoulos and Mpesiana (2020) | X‐ray | 224 | 504 | 93 |
| L. Wang, Lin, and Wong (2020) | X‐ray | 53 | 8,066 | 92 |
| Sethy and Behera (2020) | X‐ray | 25 | 25 | 95 |
| Hemdan et al. (2020) | X‐ray | 25 | 25 | 90 |
| Narin et al. (2020) | X‐ray | 50 | 50 | 98 |
| L. Wang, Lin, and Wong (2020) | CT | 777 | 708 | 86 |
| S. Wang, Kang, et al. (2020) | CT | 195 | 258 | 82 |
| Ozturk et al. (2020) | X‐ray | 250 | 1,000 | 92 |
| Li et al. (2020) | CT | 1,296 | 1.325 | 96 |
| Brunese et al. (2020) | X‐ray | 250 | 3.520 | 97 |
| Proposed approach based on transfer learning | X‐ray | 60 | 70 | 100 |
| 912 | 912 | 99.29 | ||
| Proposed model trained from scratch | X‐ray | 60 | 70 | 91.83 |
| 912 | 912 | 93.98 |
9. CONCLUSIONS
The emergence of COVID‐19 infection in the last months has led to the necessity of AI tools to help for automated diagnosis of COVID‐19 cases. This necessity has motivated us to test some deep learning models with different learning strategies for the diagnosis of this contagious disease. This article presented a pre‐training‐based transfer learning approach for automatic detection of COVID‐19 from X‐ray images with different training/testing ratios. The used models have been investigated and compared. Simulation results proved that transfer learning based on ResNet models (ResNet18, ResNet50, and ResNet101) outperforms other transfer learning models. Moreover, we designed a deep CNN model, namely CONV‐COVID‐net, and trained it specifically to identify X‐ray images of COVID‐19 patients. The proposed CONV‐COVID‐net model gives good results, even if the used data is not large enough.
Emara HM, Shoaib MR, Elwekeil M, et al. Deep convolutional neural networks for COVID‐19 automatic diagnosis. Microsc Res Tech. 2021;84:2504–2516. 10.1002/jemt.23713
Review Editor: Peter Saggau
DATA AVAILABILITY STATEMENT
The data that support the findings of this study are openly available in [Github] at [https://github.com/vicely07/COVID19-image-classification/tree/master/Data/all], and in [Mendeley] at [https://data.mendeley.com/datasets/2fxz4px6d8/4].
REFERENCES
- Alom, M. Z. , Hasan, M. , Yakopcic, C. , and Taha, T. M. (2017). Inception recurrent convolutional neural network for object recognition. arXiv preprint arXiv:1704.07709 .
- Alom, M. Z. , Taha, T. M. , Yakopcic, C. , Westberg, S. , Sidike, P. , Nasrin, M. S. , … Asari, V. K. (2018). The history began from alexnet: A comprehensive survey on deep learning approaches. arXiv preprint arXiv:1803.01164 .
- Apostolopoulos, I. D. , & Mpesiana, T. A. (2020). Covid‐19: Automatic detection from x‐ray images utilizing transfer learning with convolutional neural networks. Physical and Engineering Sciences in Medicine, 43(2), 635–640. [DOI] [PMC free article] [PubMed] [Google Scholar]
- Ballester, P. , & Araujo, R. M. (2016). On the performance of googlenet and alexnet applied to sketches. In Proceedings of the AAAI Conference on Artificial Intelligence. 30(1). [Google Scholar]
- Brunese, L. , Mercaldo, F. , Reginelli, A. , & Santone, A. (2020). Explainable deep learning for pulmonary disease and coronavirus covid‐19 detection from x‐rays. Computer Methods and Programs in Biomedicine, 196, 105608. [DOI] [PMC free article] [PubMed] [Google Scholar]
- Chen, L. , Bentley, P. , Mori, K. , Misawa, K. , Fujiwara, M. , & Rueckert, D. (2019). Self‐supervised learning for medical image analysis using image context restoration. Medical Image Analysis, 58, 101539. [DOI] [PMC free article] [PubMed] [Google Scholar]
- Chowdhury, M. E. , Alzoubi, K. , Khandakar, A. , Khallifa, R. , Abouhasera, R. , Koubaa, S. , … Hasan, A. (2019). Wearable real‐time heart attack detection and warning system to reduce road accidents. Sensors, 19(12), 2780. [DOI] [PMC free article] [PubMed] [Google Scholar]
- Chowdhury, M. E. , Khandakar, A. , Alzoubi, K. , Mansoor, S. , Tahir, A. M. , Reaz, M. B. I. , & Al‐Emadi, N. (2019). Real‐time smart‐digital stethoscope system for heart diseases monitoring. Sensors, 19(12), 2781. [DOI] [PMC free article] [PubMed] [Google Scholar]
- Dorj, U.‐O. , Lee, K.‐K. , Choi, J.‐Y. , & Lee, M. (2018). The skin cancer classification using deep convolutional neural network. Multimedia Tools and Applications, 77(8), 9909–9924. [Google Scholar]
- Draelos, R. (2019). Best use of train/val/test splits, with tips for medical data. In Glass Box: Artificial Intelligence+ Medicine. https://glassboxmedicine.com/2019/09/15/best-use-of-train-val-test-splits-with-tips-for-medical-data [Google Scholar]
- Gao, F. , Yoon, H. , Wu, T. , & Chu, X. (2020). A feature transfer enabled multi‐task deep learning model on medical imaging. Expert Systems with Applications, 143, 112957. [Google Scholar]
- Ghosal, P. , Nandanwar, L. , Kanchan, S. , Bhadra, A. , Chakraborty, J. , & Nandi, D. (2019). Brain tumor classification using resnet‐101 based squeeze and excitation deep neural network. In 2019 Second International Conference on Advanced Computational and Communication Paradigms (ICACCP) (pp. 1–6). IEEE. [Google Scholar]
- Ghoshal, B. , & Tucker, A. (2020). Estimating uncertainty and interpretability in deep learning for coronavirus (covid‐19) detection. arXiv preprint arXiv:2003.10769 .
- Github . (2020). COVID19‐image‐classification. https://github.com/vicely07/COVID19-image-classification/tree/master/Data.
- Goodfellow, I. , Bengio, Y. , & Courville, A. (2016). Deep learning. Cambridge: MIT Press. [Google Scholar]
- Haupt, J. , Kahl, S. , Kowerko, D. , & Eibl, M. (2018). Large‐scale plant classification using deep convolutional neural networks. In CLEF (Working Notes). [Google Scholar]
- He, K. , Zhang, X. , Ren, S. , & Sun, J. (2016). Deep residual learning for image recognition. In Proceedings of the IEEE Conference on Computer Vision and Pattern Recognition (pp. 770–778). [Google Scholar]
- Hemdan, E. E.‐D. , Shouman, M. A. , & Karar, M. E. (2020). Covidx‐net: A framework of deep learning classifiers to diagnose covid‐19 in x‐ray images. arXiv preprint arXiv:2003.11055 .
- Jensen, J. R. et al. (1996). Introductory digital image processing: A remote sensing perspective (no. Ed. 2). Prentice‐Hall Inc. [Google Scholar]
- Kallianos, K. , Mongan, J. , Antani, S. , Henry, T. , Taylor, A. , Abuya, J. , & Kohli, M. (2019). How far have we come? Artificial intelligence for chest radiograph interpretation. Clinical Radiology, 74(5), 338–345. [DOI] [PubMed] [Google Scholar]
- Kassani, S. H. , & Kassani, P. H. (2019). A comparative study of deep learning architectures on melanoma detection. Tissue and Cell, 58, 76–83. [DOI] [PubMed] [Google Scholar]
- Kim, M. , Yan, C. , Yang, D. , Wang, Q. , Ma, J. , & Wu, G. (2020). Deep learning in biomedical image analysis. In Biomedical information technology (pp. 239–263). Academic Press: Elsevier. [Google Scholar]
- Li, L. , Qin, L. , Xu, Z. , Yin, Y. , Wang, X. , Kong, B. , … Xia, J. (2020). Using artificial intelligence to detect covid‐19 and community‐acquired pneumonia based on pulmonary ct: Evaluation of the diagnostic accuracy. Radiology, 296(2), E65–E71. [DOI] [PMC free article] [PubMed] [Google Scholar]
- Liu, H. , & Cocea, M. (2017). Semi‐random partitioning of data into training and test sets in granular computing context. Granular Computing, 2(4), 357–386. [Google Scholar]
- Mendeley . (2020). Datasets. https://data.mendeley.com/datasets/2fxz4px6d8/4.
- Nadeem, M. W. , Ghamdi, M. A. A. , Hussain, M. , Khan, M. A. , Khan, K. M. , Almotiri, S. H. , & Butt, S. A. (2020). Brain tumor analysis empowered with deep learning: A review, taxonomy, and future challenges. Brain Sciences, 10(2), 118. [DOI] [PMC free article] [PubMed] [Google Scholar]
- Narin, A. , Kaya, C. , & Pamuk, Z. (2020). Automatic detection of coronavirus disease (covid‐19) using x‐ray images and deep convolutional neural networks. arXiv preprint arXiv:2003.10849 . [DOI] [PMC free article] [PubMed]
- Ozturk, T. , Talo, M. , Yildirim, E. A. , Baloglu, U. B. , Yildirim, O. , & Acharya, U. R. (2020). Automated detection of covid‐19 cases using deep neural networks with x‐ray images. Computers in Biology and Medicine, 121, 103792. [DOI] [PMC free article] [PubMed] [Google Scholar]
- Parente, L. , & Ferreira, L. (2018). Assessing the spatial and occupation dynamics of the brazilian pasturelands based on the automated classification of modis images from 2000 to 2016. Remote Sensing, 10(4), 606. [Google Scholar]
- Pradeep, K. , Kamalavasan, K. , Natheesan, R. , & Pasqual, A. (2018). Edgenet: Squeezenet like convolution neural network on embedded fpga. In 2018 25th IEEE International Conference on Electronics, Circuits and Systems (ICECS) (pp. 81–84). IEEE. [Google Scholar]
- Qassim, H. , Verma, A. , & Feinzimer, D. (2018). Compressed residual‐vgg16 cnn model for big data places image recognition. In 2018 IEEE 8th Annual Computing and Communication Workshop and Conference (CCWC) (pp. 169–175). IEEE. [Google Scholar]
- Ribli, D. , Horváth, A. , Unger, Z. , Pollner, P. , & Csabai, I. (2018). Detecting and classifying lesions in mammograms with deep learning. Scientific Reports, 8(1), 1–7. [DOI] [PMC free article] [PubMed] [Google Scholar]
- Saba, T. , Mohamed, A. S. , El‐Affendi, M. , Amin, J. , & Sharif, M. (2020). Brain tumor detection using fusion of hand crafted and deep learning features. Cognitive Systems Research, 59, 221–230. [Google Scholar]
- Sethy, P. K. , & Behera, S. K. (2020). Detection of coronavirus disease (covid‐19) based on deep features. Preprint, 2020030300, 2020. [Google Scholar]
- Simonyan, K. and Zisserman, A. (2014). Very deep convolutional networks for large‐scale image recognition. arXiv preprint arXiv:1409.1556 .
- Taha, A. A. , & Hanbury, A. (2015). Metrics for evaluating 3d medical image segmentation: Analysis, selection, and tool. BMC Medical Imaging, 15(1), 29. [DOI] [PMC free article] [PubMed] [Google Scholar]
- Tahir, A. M. , Chowdhury, M. E. , Khandakar, A. , Al‐Hamouz, S. , Abdalla, M. , Awadallah, S. , … Al‐Emadi, N. (2020). A systematic approach to the design and characterization of a smart insole for detecting vertical ground reaction force (vgrf) in gait analysis. Sensors, 20(4), 957. [DOI] [PMC free article] [PubMed] [Google Scholar]
- Wang, L. , Lin, Z. Q. , & Wong, A. (2020). Covid‐net: A tailored deep convolutional neural network design for detection of covid‐19 cases from chest x‐ray images. Scientific Reports, 10(1), 1–12. [DOI] [PMC free article] [PubMed] [Google Scholar]
- Wang, S. , Kang, B. , Ma, J. , Zeng, X. , Xiao, M. , Guo, J. , … Xu, B. (2020). A deep learning algorithm using ct images to screen for corona virus disease (covid‐19). MedRxiv. Preprint. [DOI] [PMC free article] [PubMed] [Google Scholar]
- Wang, W. , Xu, Y. , Gao, R. , Lu, R. , Han, K. , Wu, G. , & Tan, W. (2020). Detection of sars‐cov‐2 in different types of clinical specimens. JAMA, 323(18), 1843–1844. [DOI] [PMC free article] [PubMed] [Google Scholar]
- WHO . (2020). Programmes and projects. https://www.who.int/health-topics/coronavirus20.03.2020.
- Wu, Z. , Shen, C. , & Van Den Hengel, A. (2019). Wider or deeper: Revisiting the resnet model for visual recognition. Pattern Recognition, 90, 119–133. [Google Scholar]
- Zhou, D.‐X. (2020). Universality of deep convolutional neural networks. Applied and Computational Harmonic Analysis, 48(2), 787–794. [Google Scholar]
- Zu, Z. Y. , Jiang, M. D. , Xu, P. P. , Chen, W. , Ni, Q. Q. , Lu, G. M. , & Zhang, L. J. (2020). Coronavirus disease 2019 (covid‐19): A perspective from China. Radiology, 296(2), E15–E25. [DOI] [PMC free article] [PubMed] [Google Scholar]
Associated Data
This section collects any data citations, data availability statements, or supplementary materials included in this article.
Data Availability Statement
The data that support the findings of this study are openly available in [Github] at [https://github.com/vicely07/COVID19-image-classification/tree/master/Data/all], and in [Mendeley] at [https://data.mendeley.com/datasets/2fxz4px6d8/4].


