

Abstract
Alzheimer’s disease (AD) often coexists with other aging-associated diseases including obesity, diabetes, hypertension, and cardiovascular diseases. The early stage of these comorbidities is known as metabolic syndrome (MetS) which is highly prevalent in mid-life. An important cause of MetS is the deficiency of SIRT3, a mitochondrial deacetylase which enhances the functions of critical mitochondrial proteins, including metabolic enzymes, by deacetylation. Deletion of Sirt3 gene has been reported to result in the acceleration of MetS. In a recently published study, we demonstrated in the brain of Sirt3−/− mice, downregulation of metabolic enzymes, insulin resistance and elevation of inflammatory markers including microglial proliferation. These findings suggested a novel pathway that could link SIRT3 deficiency to neuroinflammation, an important cause of Alzheimer’s pathogenesis. Therefore, we hypothesized that MetS and amyloid pathology may interact through converging pathways of insulin resistance and neuroinflammation in comorbid AD. To investigate these interactions, we crossed Sirt3−/− mice with APP/PS1 mice and successfully generated APP/PS1/Sirt3−/− mice with amyloid pathology and MetS. In these comorbid AD mice, we observed exacerbation of insulin resistance, glucose intolerance, amyloid plaque deposition, markers of neuroinflammation, including elevated expression of IL-1β, TNF-α and Cox-2 at 8 months of age. There was also increased microglial proliferation and activation. Our observations suggest a novel mechanism by which MetS may interact with amyloid pathology during the cellular phase of AD. Therapeutic targeting of SIRT3 in AD with comorbidities may produce beneficial effects.
Keywords: SIRT3, Metabolic syndrome, Insulin resistance, Amyloid pathology, Microglia and Neuroinflammation
1. Introduction
Alzheimer’s disease (AD), the most common form of dementia, is characterized by deposition of extracellular amyloid plaques and the formation of intracellular neurofibrillary tangles [1]. It is also being recognized that AD often coexists with brain lesions, caused by other comorbidities, including obesity, diabetes, hypertension and cardiovascular diseases [2–4]. A report reviewing the findings of two important studies, Nun Study [5] and Honolulu Asia Aging Study [6,7], concluded that the total burden of neuropathological lesions, caused by comorbidities, are the relevant determinants of cognitive dysfunction [2]. The comorbidities are known to be important causes of vascular dementia, the second most common form of dementia [8]. However, the traditional view that AD and vascular dementia are distinct entities has been challenged [9,10]. The Adult Changes in Thought (ACT) study suggests that dementia is a syndrome with multiple etiologies [3]. With the availability of a wide range of medications, patients with comorbidities are living longer and thus are exposed to aging-associated diseases [11,12]. The early stage of these comorbidities is referred to as metabolic syndrome (MetS) [13]. Because MetS affects 1 in 3 adults in the US [14], the incidence of comorbid AD may increase significantly in the coming decades.
Although the research in MetS has traditionally remained in the domain of peripheral tissues, changes in brain function are beginning to be recognized. Several epidemiological studies have reported that MetS is an independent risk factor for dementia [15–17]. Insulin resistance in MetS is a key link to cognitive dysfunction [18]. Furthermore, association between MetS and AD has been reported [19,20]. For example, the progression of mild cognitive impairment (MCI) to AD is accelerated by the presence of MetS as shown by two longitudinal studies [21,22]. Another study showed greater cognitive decline in AD patients when there is coexisting MetS [23]. Insulin resistance and vascular endothelial dysfunction are the important causes of this association. Animal studies have also suggested the link between MetS and cognitive dysfunction. For example, feeding mice with diet rich in advanced glycation end products (AGE) leads to MetS and cognitive dysfunction [24]. Dinel et al. observed behavioral alterations and markers of central inflammation in a mouse model of MetS [25]. Adiponectin gene deletion-induced brain insulin resistance causes AD-like pathology and cognitive impairment [26]. Thus, MetS affects cognitive function independently as well as with coexisting AD.
Metabolic syndrome is a combination of five risk factors including abdominal obesity, hypertriglyceridemia, insulin resistance, high blood pressure and low levels of HDL (good cholesterol) [27–29]. This precondition for comorbidities is caused by a combination of genetic risk factors and life style changes [13]. Feeding a calorie-rich high fat diet or Western diet in rodents leads to MetS [30]. A key component of MetS is the deficiency of a mitochondrial deacetylase, Silent information regulator 3 (SIRT3) which enhances the functions of critical mitochondrial proteins by deacetylation [31]. SIRT3 belongs to a family of seven proteins which play important roles in longevity, metabolism and inflammation [32]. Silencing of Sirt3 in mice leads to acceleration of MetS [33–35]. Chronic consumption of excessive calories, a cause of MetS, decreases SIRT3 levels and depletes cellular NAD content which is needed for SIRT3 activity [31]. Furthermore, reduced human SIRT3 activity, caused by a single point mutation (V208I), is associated with MetS [33]. Thus, Sirt3−/− mouse is one of the models to study the effects of MetS in the brain.
In a recent study, we examined the effects of Sirt3 gene deletion and Western diet feeding on mitochondrial function in the brain [36]. We observed hyperacetylation of mitochondrial proteins, suggesting downregulation their function. A comprehensive acetylome analysis identified 103 such proteins. These proteins included metabolic and antioxidant enzymes and components of respiratory chain. Decreased mitochondrial function was shown by impaired mitochondrial respiration. Furthermore, increase in Interleukin-1beta (IL-1β) levels and microglial proliferation were observed in the brain of Sirt3−/− mouse. Because mitochondrial dysfunction and neuroinflammation are important causes of AD [37,38], we hypothesized that MetS may interact with the early asymptomatic phase of AD. Mild cognitive impairment (MCI) is the stage that precedes clinical AD. Even before MCI, Alzheimer’s pathologies take place at the cellular and molecular level for several decades, a stage known as the cellular phase of AD [39]. Therefore, this early cellular phase is likely to overlap with MetS in mid-life, suggesting that deletion of Sirt3 gene in mice overexpressing human mutant amyloid precursor protein (APP) will be a novel approach to investigate the interactions between MetS and amyloid pathology.
Rodent models of Alzheimer’s disease have been developed with one of the two major pathologies, namely, amyloid plaque deposition and neurofibrillary tangles. For example, mouse models overexpressing mutants of human APP and presenilin1 (PS1) are used to study the pathways of amyloid plaque deposition and the downstream effects of Aβ [40,41]. Similarly, tau pathology has been studied in mice overexpressing human mutant tau (P301L) [42]. Combining both pathologies, Oddo et al. generated a triple transgenic mouse model, 3XTg AD mice [43] which overexpress APPswe and tauP301L transgenes on a PS1M146V knock-in background. These models have advanced our understanding of the basic biology of AD from early events to late neurodegeneration. It has been also recognized that Alzheimer’s models with comorbidities may recapitulate more features of the human disease [44]. These models are essential to test potential therapeutic agents for better success in later clinical trials. Therefore, the objective of this study was to generate a mouse model with amyloid pathology and MetS so that the early molecular and cellular events in the brain of comorbid AD mice can be examined with a focus on neuroinflammation, plaque deposition and microglial regulation.
2. Materials and methods
2.1. Generation of a new comorbid AD mouse model
APP/PS1 and Sirt3−/− mice, in C57BL/6 genetic background, were obtained from Jackson Laboratory (Bar Harbor, ME; Stock #5864) and Louise Lantier, Vanderbilt University Medical Center (Nashville, TN), respectively. Animal care and the experimental procedures were approved by Institutional Animal Care and Use Committee (protocol #2MR1604M) at the Rocky Mountain Regional Veterans Affairs Medical Center, Aurora, CO. First, male APP/PS1 mice were crossed with female Sirt3−/− mice to generate APP/PS1/Sirt3+/− mice. In the second crossing, breeding pairs were set up with male APP/PS1/Sirt3+/− and female Sirt3−/− mice to generate APP/PS1/Sirt3−/− mice. After the generation of these founder mice, the following two parallel crosses were set up to generate the four groups of mice needed for this study. Male APP/PS1/Sirt3−/− mice were crossed with female Sirt3−/− mice to generate APP/PS1/Sirt3−/− and Sirt3−/− mice. Parallelly, male APP/PS1 mice were crossed with female C57BL/6 mice to generate the wild type and AD mice. Tail snips were excised from each progeny and subjected to genotyping for Sirt3 homozygosity and PSEN1. Because AD affects females more than males, we decided to examine the effects of Sirt3 deletion in female mice first. We chose 8 mo-old mice to determine early cellular and molecular effects. Six female mice from each of the four groups of animals viz. wild type (WT), Sirt3−/− (S), APP/PS1 (A) and APP/PS1/Sirt3−/− (A/S) were aged to 8 mo and sacrificed after isoflurane exposure. Blood was collected by cardiac puncture and separated plasma was stored at −80 °C. Further, mice were perfused with cold PBS and half of the brain hemisphere was kept in the fixative for 2–3 h at RT, followed by cryopreservation in 30% sucrose solution overnight at 4 °C and then embedded in OCT and rest of the brain was snap-frozen for protein and RNA isolation.
2.2. Insulin, triglyceride and CRP assays
Plasma insulin was assayed using a kit from ALPCO, Salem, NH (Cat. # 80-INSMS-E01). Plasma triglyceride levels were measured, using a colorimetric kit from Abcam, Cambridge, MA (Cat. # ab65336). Plasma C-reactive protein (CRP) was analyzed by Enzyme-linked immunosorbent assay (ELISA), using a kit from R&D Systems, Minneapolis, MN (Cat. #MLB00C).
2.3. Oral glucose tolerance test
One week before sacrificing the mice, oral glucose tolerance test was performed by the standard procedure. Briefly, after overnight fasting, blood samples (~5 μL) were collected from tail prick with a lancet. The animals were then fed glucose (2 g/kg bw) in a volume of 200 μL by oral gavage, using plastic tubing (Instech Laboratories, Inc. Plymouth Meeting PA). Post glucose administration, blood samples were again collected at 30, 60- and 120-min intervals for glucose measurement, using a glucometer (One touch ultra, Lifescan). After plotting the glucose response curve with time, the area under the curve was calculated for each group of mice as a quantitative measure of glucose intolerance.
2.4. RT-PCR analysis of Inflammatory markers in the brain
Total RNA was extracted from the brain samples, using an isolation kit from Fisher Scientific, (Pittsburgh, PA). Following treatment with DNase, the RNA samples (2–4 μg) were reverse transcribed to generate cDNA [45]. The mRNA levels of IL-1β, Tumor necrosis factor-alpha (TNF-α) and Cox-2 were measured by real-time quantitative reverse transcription-polymerase chain reaction (RT-PCR), using Taqman probes. The primers and probes were designed by Primer Express (PE ABI, Foster City, CA). For standards, the amplicons corresponding to the amplification sequence were synthesized and used. The mRNA levels of the inflammatory markers were expressed as pg/ng of Gapdh.
2.5. Measurement of brain mitochondrial oxygen consumption
Mitochondrial respiration was measured by the procedure described previously [36]. Briefly, brain cortex samples were hand-homogenized in ice-cold mitochondrial isolation buffer (MIB: 70 mM sucrose, 210 mM mannitol, 5 mM HEPES, 1 mM EGTA and 0.5% fatty acid free BSA, pH 7.2). Following cold (4 °C) centrifugation for 10 min at 500g, the supernatant, containing crude mitochondrial fractions, was used to measure oxygen consumption, using Oroboros Oxygraph-2k (O2K; Oroboros Instrument Corp, Innsburk, Austria). Homogenates containing 4 mg of cortical tissues were re-suspended in mitochondrial respiration buffer [MiR06 (0.5 mM EGTA, 3 mM magnesium chloride, 60 mM K-lactobionate, 20 mM taurine, 10 mM potassium phosphate, 20 mM HEPES, 110 mM sucrose, 1 g/L bovine serum albumin, 280 U/mL catalase, pH 7.1)]. Oxygen concentration in MiR06 (chambers) was maintained between 250 - 400 mM concentration. Substrates and inhibitors were added to assess respiration at several states. CI-linked LEAK respiration rate was measured with the final concentration of CI-linked substrate 5 mM pyruvate + 2 mM malate + 10 mM glutamate (PMG). Then 2 mM adenosine diphosphate (ADP) was added to induce CI-linked OXPHOS, followed by 6 mM succinate (S) to observe CI + CII linked OXPHOS. Further 10 μg/mL oligomycin was added to inhibit ATP synthase to measure leak respiration, followed by stepwise titration with 0.5 μM carbonyl cyanide 4-(trifluoromethoxy) phenylhydrazone until maximal uncoupled respiration fueled by complex II (uncoupled state). Exogenous Cytochrome C (10 μM) was used to determine mitochondrial membrane damage. As addition of cytochrome C did not increase mitochondrial respiration, indicating minimal damage to the outer mitochondrial membrane during mitochondrial isolation preparation.
2.6. Western blot analysis
The brain frontal cortical tissues from four groups of mice were lysed with mammalian protein extraction buffer (Pierce, Rockford, IL) and the lysates were analyzed by western blot analysis as previously described [46]. Briefly, samples with equal amount of protein (30–50 μg) were separated on 7.5% or 12% tris glycine gels by SDS-PAGE and transferred onto polyvinylidene difluoride (PVDF) membrane. The membranes were incubated in 5% nonfat milk in TBST for 1 h at RT to block non-specific binding. The blots were then incubated with the primary antibodies [Sirt1 (Cat # 9475), Sirt2 (Cat # 12650), Sirt3 (Cat # 5490), Sirt5 (Cat # 8782), Sirt6 (Cat # 12486), Sirt7 (Cat # 5360), pAKT-Ser473 (Cat # 4060), total AKT (Cat # 9272), pJNK1/2 (Cat # 9251), total JNK1/2 (Cat # 9252), pP38 (Cat # 9211), total p38 (Cat # 9212), Synaptophysin (Cat # 36406), Synapsin-2 (Cat # 85852), β tubulin (Cat # 5568) or β actin (Cat # 4967), Cell Signaling Technology, Danvers, MA; Sirt4 (Cat # PA5-68562), Invitrogen (Carlsbad, CA)] at 4 °C overnight. After washing in TBST three times, the membranes were incubated in the presence of secondary antibodies conjugated to alkaline phosphatase. After further washing in TBST, the immunoreactive proteins were visualized with CDP-Star reagent (Sigma Aldrich-St Louis, MO), using ChemiDoc Imaging Systems (BIO-RAD, Hercules, CA). The band intensities were quantitated, using Fluor S MultiImager and Quantity One software from Bio-Rad and corrected for the levels of β actin.
2.7. Immunofluorescence staining
The brain tissues were embedded in OCT and the sections from frontal cortex region (10 μM) were permeabilized in 0.02% Triton-X100 in TBS, at RT for 30 min and blocked in normal goat serum (1.26%) in 0.3% Triton-X-100 in TBS (TBST) for 1 h at RT. The sections were washed in TBS and incubated with mouse anti-β amyloid antibody (Cat # 2450, CST, Danvers, MA) in TBST overnight at 4 °C in humidified chamber. In the case of dual immunofluorescent staining, the following combinations of primary antibodies were used: (i) mouse anti-β amyloid antibody (Cat # 2450, CST, Danvers, MA) and rabbit anti-Iba1 antibody (Cat # 019-19741, Wako, Richmond, VA; 1:200 dilution); (ii) rabbit anti-β amyloid (Cat # 8243, CST, Danvers, MA) and mouse anti-GFAP (Cat # 3670, CST, Danvers, MA) and (iii) mouse anti-β amyloid antibody (Cat # 2450, CST, Danvers, MA) and rabbit anti-CD 68 (# ab125212, Abcam, Cambridge, MA). Next day, following 3 washes with TBST, the slides were incubated with appropriate secondary antibodies, conjugated with fluorescein isothiocyanate (FITC) or Cy3 and DAPI in the dark for 2 h at RT. Following additional washes in TBST, the sections were mounted with Prolong®Gold antifade reagent (Invitrogen, Carlsbad, CA) and covered with coverslips. Imaging was done with the Leica SP8 confocal microscope with a white light laser, using a Leica HC PL APO 40x 1.30 NA oil objective. Quantitative data analysis was performed with the Leica LAS X 3D analysis software. Seven to nine Z-stack images were taken randomly throughout the samples, then processed by both the volumetric analysis (μm3) for plaques, and surface area volume (μm2) for microglia and astrocytes with the 3D analysis software extensions. Plaques were categorized as small if the diameter was < 30 μm. Plaques with a diameter of > 30 μm were labeled as large. Each plaque from all Z-stack images were isolated and evaluated with the volumetric analysis software. All images were then processed into maximum intensity projections, and surface volume calculations were completed for glial cells.
2.8. Statistical analysis
Statistical significance was determined using Sigma Stat version 3.5 software. Every dataset passed through Shapiro-Wilk normality test and differences between groups were determined by one-way ANOVA, followed by a Bonferroni’s test, and two-sided P values of < 0.05 were considered significant.
3. Results
3.1. Deletion of Sirt3 gene in an Alzheimer’s mouse model
Our objective of this study was to investigate the interactions between MetS and amyloid pathology in a comorbid AD model. In a previous study, we observed brain mitochondrial dysfunction and neuroinflammation in Sirt3−/− mice, both important causes of Alzheimer’s pathogenesis [36]. Therefore, we crossed Sirt3−/− mouse, a model for MetS with APP/PS1 mouse which has been well-characterized for amyloid pathology. We were successful in the homozygous deletion of Sirt3 gene to generate a viable APP/PS1/Sirt3−/− mouse as a comorbid AD mouse model. To confirm the deletion of Sirt3 gene, we examined the expression of Sirt3 at the mRNA and protein level in the brain samples. Sirt3 mRNA was at negligible levels in the brain of Sirt3−/− and APP/PS1/Sirt3−/− mice (Fig. 1A). Western blot analysis (Fig. 1B) and the quantitation of SIRT3 bands (Fig. 1C) further confirmed the absence of SIRT3 protein in the brain samples of Sirt3−/− and APP/PS1/Sirt3−/− mice. Interestingly, there were also significant decreases (P < 0.05) in the mRNA and protein levels of Sirt3 in APP/PS1 mouse brain. This observation suggests that amyloid pathology itself may interfere with the deacetylation and activation of mitochondrial proteins due to the downregulation of SIRT3.
Fig. 1.
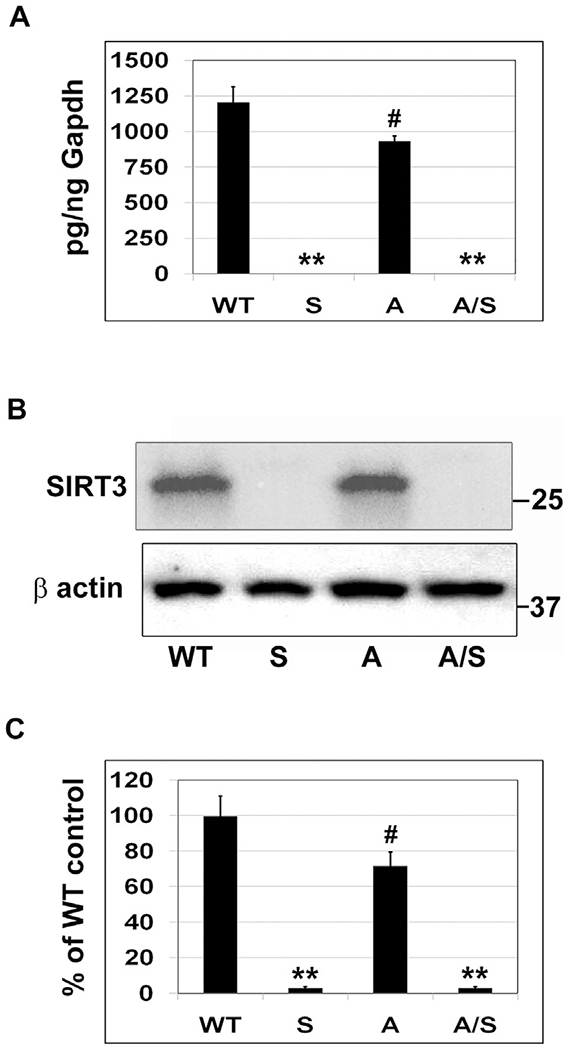
Deletion of Sirt3 gene in an Alzheimer’s mouse model. The brain samples of eight-month-old female mice belonging to four groups (six each), namely, wild type, Sirt3−/−, APP/PS1, and APP/PS1/Sirt3−/− mice were used for the (A) Isolation of total RNA, followed by the RT-PCR analysis of Sirt3 mRNA and (B) Western blot analysis of SIRT3 protein. (C) Blots were scanned and corrected for β actin levels. Quantitative data are shown with the mean ± SEM from 6 animals for each group. WT: Wild type, S: Sirt3−/−, A: APP/PS1, and A/S: APP/PS1/Sirt3−/−. ** P < 0.001; # P < 0.05 compared to wild type mice.
3.2. Modulation of other sirtuins, following Sirt3 deletion
SIRT3 belongs to the sirtuin family, consisting of seven proteins with some overlapping functions. To determine if silencing of Sirt3 leads to compensatory increase in the levels of other sirtuins, we performed western blot analysis (Fig. 2). Overall, we did not observe any increase in the levels of other sirtuins in Sirt3−/− as well as APP/PS1/Sirt3−/− mouse brain samples. In fact, there were decreases in the levels of SIRT1 (P < 0.05; Fig. 2B), SIRT4 (P < 0.01; Fig. 2D) and SIRT6 (P < 0.05– < 0.01; Fig. 2F) in Sirt3−/− and APP/PS1/Sirt3−/− mice. These observations suggested that SIRT3 deficiency may down-regulate other sirtuins as well. Furthermore, we observed changes in the levels of these proteins in APP/PS1 mouse brain, suggesting that sirtuins may be modulated during β amyloid deposition. In addition to the decrease of SIRT3 as observed in the previous section (Fig. 1), decreases (20–25%; P < 0.05) were observed in SIRT1 (Fig. 2B) and SIRT4 (Fig. 2D), whereas SIRT2 (Fig. 2C) and SIRT5 (Fig. 2E) levels increased (P < 0.05) in APP/PS1 mouse brain. Others have also reported decreases in SIRT1 [47] and SIRT3 [48] with AD mouse models.
Fig. 2.
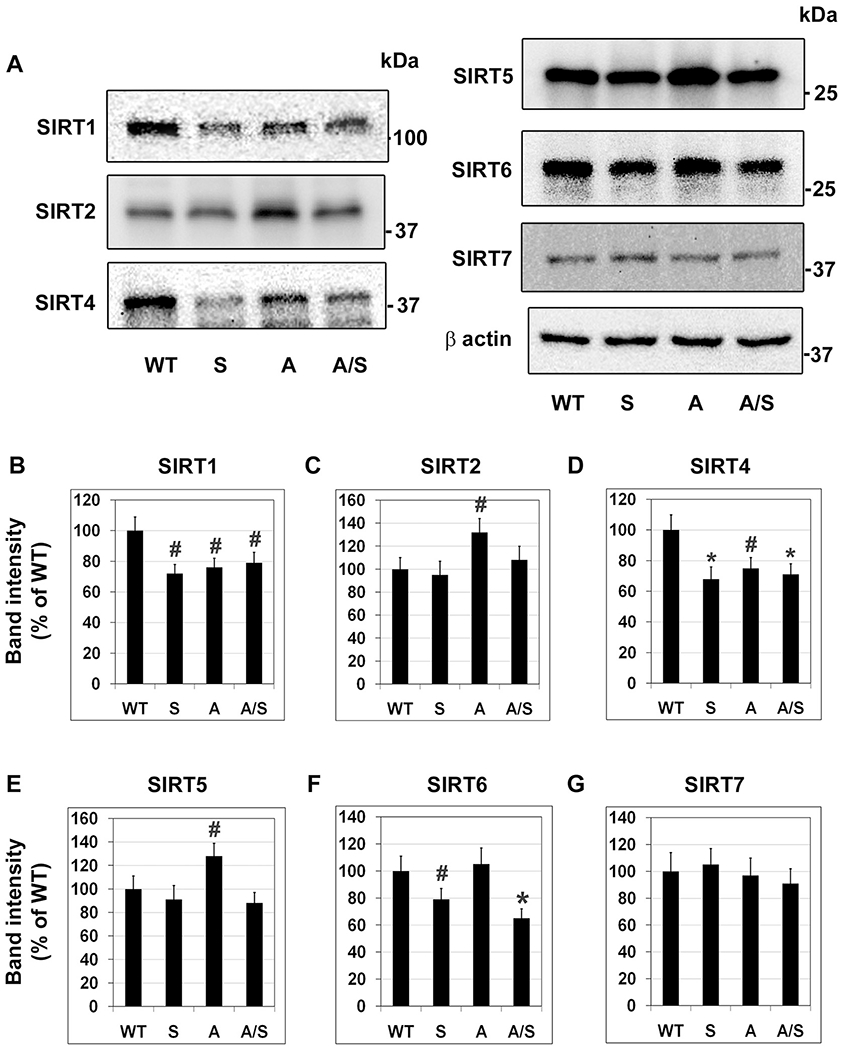
Modulation of other sirtuins, following Sirt3 deletion. (A) Brain samples, six each from four groups of mice, were immunoblotted for the members of sirtuin family, excluding SIRT3. (B)–(G). The blots of SIRT1 (B), SIRT2 (C), SIRT4 (D), SIRT5 (E) SIRT6 (F) and SIRT7 (G) were scanned and corrected for the levels of β actin. Representative images are presented. Quantitative data are presented with the mean ± SEM from 6 animals for each group. WT: Wild type, S: Sirt3−/−, A: APP/PS1, and A/S: APP/PS1/Sirt3−/−. # P < 0.05; * P < 0.01 vs wild type.
3.3. Insulin resistance and glucose intolerance in comorbid AD model
Insulin resistance plays a key role in MetS as well as in AD pathogenesis [49,50]. We observed hyperinsulinemia, a marker for insulin resistance, in Sirt3−/− and APP/PS1 mice with a two-fold increase (P < 0.01) in the plasma insulin levels (Fig. 3A) whereas a three-fold increase (P < 0.001) in circulating insulin levels was seen in APP/PS1/Sirt3−/− mice, suggesting MetS-induced exacerbation of insulin resistance in the comorbid AD mice. Plasma triglyceride levels were significantly (P < 0.01) high in Sirt3−/− mice but 50% (P < 0.01) and 40% (P < 0.05) lower in APP/PS1 and APP/PS1/Sirt3−/− mice respectively (Fig. 3B). Because insulin resistance leads to glucose intolerance, we further performed oral glucose tolerance test in the four groups of mice (Fig. 3C). Glucose intolerance was evident in the mice with MetS and amyloid pathology. Measurement of area under the curve (Fig. 3D) showed significant increases of glucose intolerance in APP/PS1 mice (P < 0.01) and APP/PS1/Sirt3−/− mice (P < 0.001 vs WT and P < 0.05 vs APP/PS1). To further determine if there is brain insulin resistance, we examined the active phosphorylated (Serine 473) form of Akt, a key target of insulin receptor signaling. There were significant decreases (P < 0.001) in the active phosphorylated Akt levels in the brain samples of Sirt3−/− and APP/PS1 mice, with APP/PS1/Sirt3−/− samples showing maximum decrease, while total Akt levels remained unchanged (Fig. 3E and F). Furthermore, we observed activation of stress-signaling pathways in brain samples of comorbid AD mice. As shown in Fig. 3(G–J), significant increases in the levels of phosphorylated JNK (P < 0.001) and p38 MAP kinase (P < 0.01) were observed in APP/PS1/Sirt3−/− mice. The increased phosphorylation of these stress kinases was similarly significant with respect to α actin levels as well. These pathways are known to interfere with insulin action [51]. Therefore, our findings suggest that brain insulin resistance, a component of amyloid pathology, may be further exacerbated with coexisting MetS.
Fig. 3.
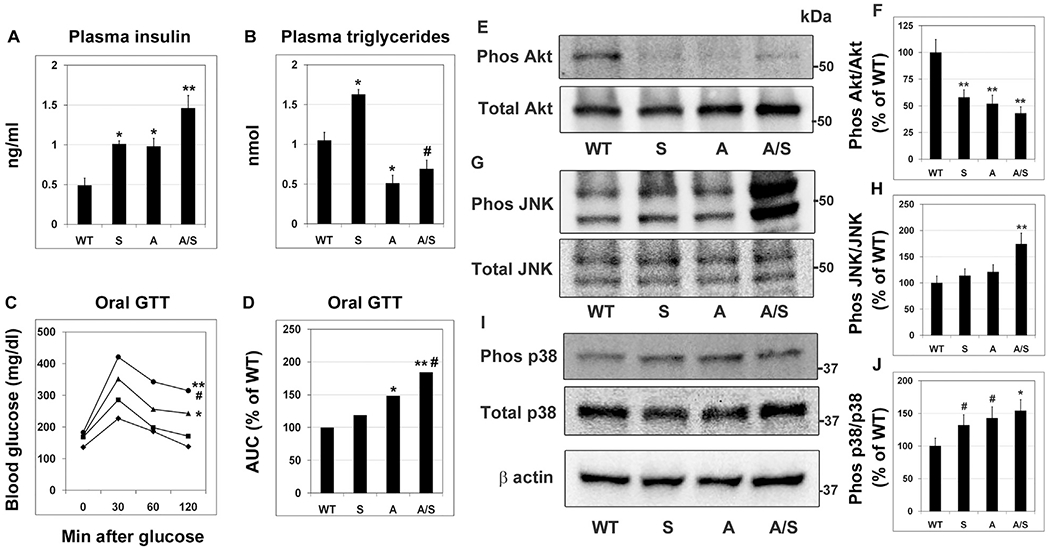
Insulin resistance and glucose intolerance in comorbid AD model. The following end points were determined in wild type, Sirt3−/−, APP/PS1 and APP/PS1/Sirt3−/− mice (six each). (A) Plasma insulin levels were measured by ELISA (B) Plasma triglyceride levels were determined by a colorimetric assay. (C) Glucose tolerance (GTT) test was performed in wild type (◆), Sirt3−/− (■), APP/PS1 (▲) and APP/PS1/Sirt3−/− (●) mice (one week before sacrifice), following overnight-fasting and administration of oral glucose (2 g/kg BW). (D) Area under the curve was calculated for the GTT curves. Brain samples were immunoblotted for the phosphorylated forms of Akt (E), JNK (G) and p38 MAPK (I). The blots were reprobed for the corresponding total proteins. The blots were scanned, and the extents of phosphorylation of Akt (F), JNK (H) and p38MAPK (J) were calculated. Representative images are presented. Quantitative data are shown with the mean ± SEM from 6 animals for each group. WT: Wild type, S: Sirt3−/−, A: APP/PS1, and A/S: APP/PS1/Sirt3−/−. # P < 0.05 * P < 0.01; ** P < 0.001; compared to wild type mice.
3.4. Elevation of inflammatory markers in the brain
We reported in a recent study that Sirt3 downregulation leads to formation of inflammasome which is known to trigger inflammation [36]. Neuroinflammation is an important cause of Alzheimer’s pathogenesis. Therefore, we examined the markers of inflammation in the mouse brain samples. IL-1β mRNA levels were significantly higher (P < 0.01) in Sirt3−/− (125%) and APP/PS1 (75%) mouse brain samples, when compared to WT mouse brain (Fig. 4A). In APP/PS1/Sirt3−/− mice, IL-1β mRNA levels were elevated by ~200% (P < 0.001), suggesting interactions between MetS and amyloid pathology. Similar observations were made with the expression of TNF-α and Cox-2. Sirt3 deletion in the WT mice led to 92% elevation (P < 0.01) in TNF-α mRNA levels (Fig. 4B). APP/PS1 mice showed an increase of 105% (P < 0.01) in TNF-α levels in the brain when compared to WT mice. The combination of MetS and amyloid pathology resulted in 288% increase (P < 0.001) of TNF-α levels in APP/PS1/Sirt3−/− mice (Fig. 4B). Cox-2 mRNA levels showed a significant increase of 50% (P < 0.01) in Sirt3−/− and APP/PS1 mouse brain samples whereas 141% increase (P < 0.001) in Cox2 mRNA levels were observed in the comorbid AD mouse brain (Fig. 4C). Overall, the combination of MetS and amyloid pathology resulted in exacerbation of inflammatory markers. However, plasma CRP levels were comparable in all the four groups, suggesting that MetS and amyloid pathology, either alone or in combination did not affect the peripheral inflammation significantly at this early stage of 8 months (Fig. 4D). To determine if neuroinflammation causes neurodegeneration, neuronal and synaptic markers were examined (Fig. 4E–H). However, no significant changes were observed in their levels. It is possible that neurodegenerative changes have not taken place, being at the early stages of interactions between metabolic syndrome and amyloid pathology.
Fig. 4.
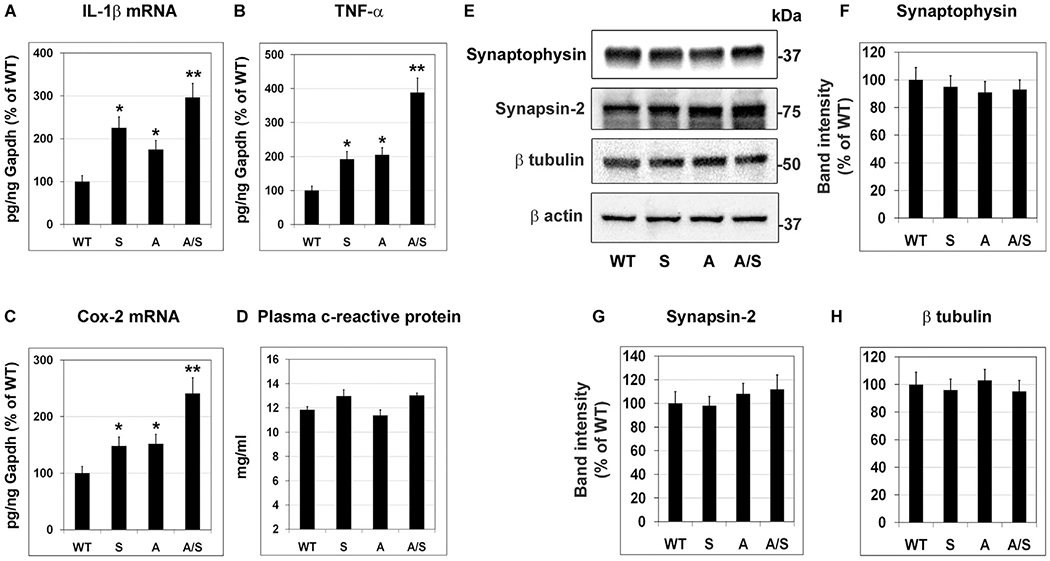
Elevation of inflammatory markers in the brain. Total RNA was isolated from the brain samples of four groups of mice (six each). RT-PCR analysis of IL-1β (A), TNF-α (B) and Cox-2 (C) were performed. (D) C-reactive protein levels in the plasma samples were assayed by a colorimetric method. (E) Brain samples were immunoblotted for neuronal markers. The blots of synaptophysin (F), synapsin-2 (G) and β tubulin (H) were scanned and corrected for the levels of β actin. Representative images are presented. Data are presented with the mean ± SEM from 6 animals for each group. WT: Wild type, S: Sirt3−/−, A: APP/PS1, and A/S: APP/PS1/Sirt3−/−. * P < 0.01; ** P < 0.001 compared to WT. # P < 0.05 vs APP/PS1.
3.5. Mitochondrial respiration in the brain
Many of the components of electron transport chain are deacetylated and activated by SIRT3. In a previous study, we reported that Sirt3 deficiency-induced MetS led to decrease in mitochondrial respiration [36]. To determine how MetS affects mitochondrial function in an Alzheimer’s mouse model, we performed respiration studies, using Oroboros Oxygraph-2k. Pyruvate (P), malate (M), glutamate (G) and succinate (S) were used as substrates. Sirt3 deletion caused decreased mitochondrial respiration in response to PMG at state 2 (ADP-independent), state 3 (ADP-dependent) by 75% (P < 0.001; Fig. 5A) and 50% (P < 0.01; Fig. 5B) respectively. In response to PMGS, state 3 (ADP-dependent) and State 4 (ADP-independent) respiration decreased by 55–63% (P < 0.001; Fig. 5C and D). The ratio of State 3 to State 4 did not change as a result of Sirt3 deficiency (Fig. 5E). Uncoupled respiration decreased significantly, following Sirt3 deletion (P < 0.05–01; Fig. 5F). Interestingly, in the case of APP/PS1 mice, mitochondrial respiration at multiples states increased significantly (P < 0.01) in the brain samples even though we had observed modest decrease in SIRT3 levels in APP/PS1 mouse brain (Fig. 1B). The probable cause could be a compensatory response from brain cells, following Aβ-induced injury. Sirt3 deletion in these AD mice led to decreases (P < 0.05-P < 0.01) in respiratory rates (Fig. 5B–F). Overall, MetS and amyloid pathology did not have similar effects on mitochondrial respiration, suggesting complex interactions between these conditions that need to be further investigated.
Fig. 5.
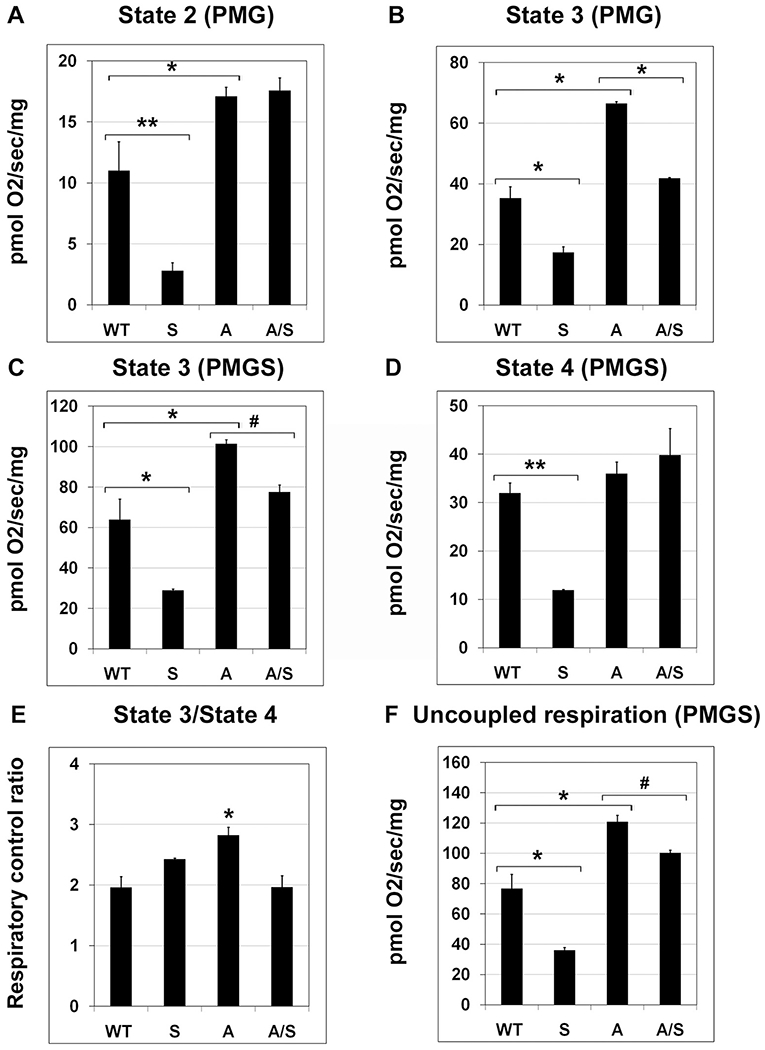
Mitochondrial respiration in the brain. Mitochondrial respiration was measured with fresh mouse brain cortical samples, six each of four groups of mice, using Oroboros Oxygraph-2K (O2K; Oroboros Instruments Corp, Innsbruck, Austria) with the addition of following substrates and inhibitors: 5 mM pyruvate + 2 mM malate + 10 mM glutamate (PMG) + 2 mM adenosine diphosphate (ADP) + 6 mM succinate (S), 10 μg/mL oligomycin, and 0.5 μM stepwise titration of carbonyl cyanide 4-(trifluoromethoxy) phenylhydrazone until maximal uncoupling (uncoupled state) is reached. (A) State 2 PMG (ADP-independent); (B) State 3 PMG (ADP-dependent); (C) State 3 PMGS (ADP-dependent); (D) State 4 PMGS (ADP-independent); (E) Respiratory control ratio (State 3/State 4); (F) Uncoupled respiration (PMGS). Quantitative data are shown with the mean ± SEM from 6 animals for each group. WT: Wild type, S: Sirt3−/−, A: APP/PS1, and A/S: APP/PS1/Sirt3−/−. # P < 0.05; * P < 0.01; ** P < 0.001.
3.6. Metabolic syndrome-induced exacerbation of amyloid plaque deposition in the brain
APP/PS1 mouse model is characterized by deposition of amyloid plaques in the brain in an age-dependent manner and we hypothesized that MetS will further exacerbate this key pathology of AD. Therefore, immunofluorescent staining for the plaques was performed with the four groups of samples. There was no plaque formation in the brain of wild type and Sirt3−/− mice (Fig. 6A and B). Abundance of plaques was seen in the brain of APP/PS1 at 8 mo as expected (Fig. 6C). Silencing of Sirt3 gene in these mice resulted in further increase in amyloid deposition (Fig. 6D). The plaque load was quantitated by counting the number of plaques and by measuring the plaque size. Volumetric analysis, using Leica LAS X 3D software showed 50% increase (P < 0.01) in the number of small (< 30 μm; Fig. 6E) as well as large plaques (> 30 μm; Fig. 6F) in APP/PS1/Sirt3−/− mice when compared to APP/PS1 mice, suggesting that MetS exacerbates amyloid plaque accumulation.
Fig. 6.
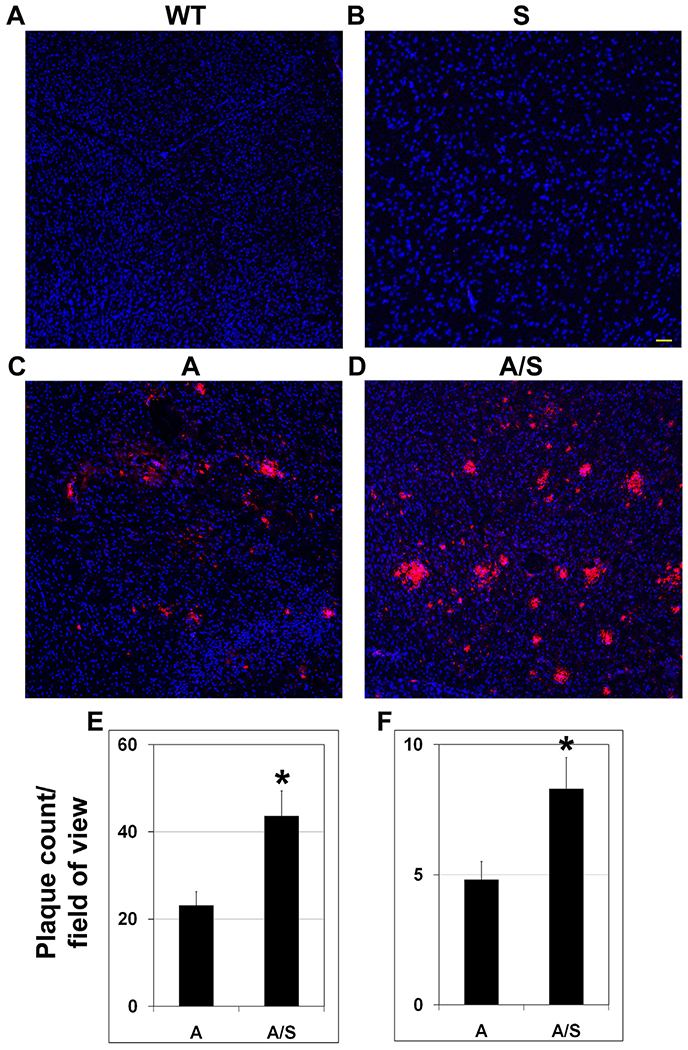
Metabolic syndrome-induced exacerbation of amyloid plaque deposition in the brain. (A)–(D). Immunofluorescent staining was performed in coronal brain sections from eight mo-old wild type (A), Sirt3−/− (B), APP/PS1 (C) and APP/PS1/Sirt3−/− (D) mice (six each) with mouse anti-β amyloid antibody (Cat # 2450; CST). Images were captured at low magnification (Bar-100 μm). (E–F) Volumetric analysis of plaque load was performed with APP/PS1 and APP/PS1/Sirt3−/− mice, using Leica LAS X 3D analysis software package. Small [ < 30 μm; (E)] and large [ > 30 μm; (F)] plaques were counted in random fields. Quantitative data are presented with the mean ± SEM from 6 animals for each group. WT: Wild type, S: Sirt3−/−, A: APP/PS1, and A/S: APP/PS1/Sirt3−/−. *P < 0.01 vs APP/PS1 mice.
3.7. Microglial proliferation and activation in the brain
Microglial dysregulation is a key component of Alzheimer’s disease [52,53]. Therefore, we performed dual immunofluorescence staining for Iba1, a marker for microglia, and amyloid plaques to colocalize the plaques with microglia (Fig. 7). Modest microglial proliferation was seen in Sirt3−/− mice as we had reported previously [36]. As expected, increased colocalization of microglia with plaques was observed in APP/PS1 mice. The abundance of microglial population especially around the plaques was significantly more in APP/PS1/Sirt3−/− mice (last panel) when compared to APP/PS1 mice. Quantitation of Iba1 staining by volumetric analysis, using Leica LAS X software showed 68% increase (P < 0.01) in comorbid AD mice vs AD mice, especially around the plaques. Morphological changes in microglia were also observed in the AD mouse brain samples. For example, microglia had less dendritic spines and were more amoeboid in nature. This observation was more evident with APP/PS1/Sirt3−/− mice (Fig. 7; last panel). Furthermore, microglial activation is also a characteristic feature of AD brain [54]. Therefore, immunofluorescent staining was performed for CD68, one of the markers for the activated microglia. The images are presented at two levels of magnification (Fig. 8). We observed significantly more activated microglia in APP/PS1/Sirt3−/− mice (Fig. 8; last panel), compared to APP/PS1 mice.
Fig. 7.
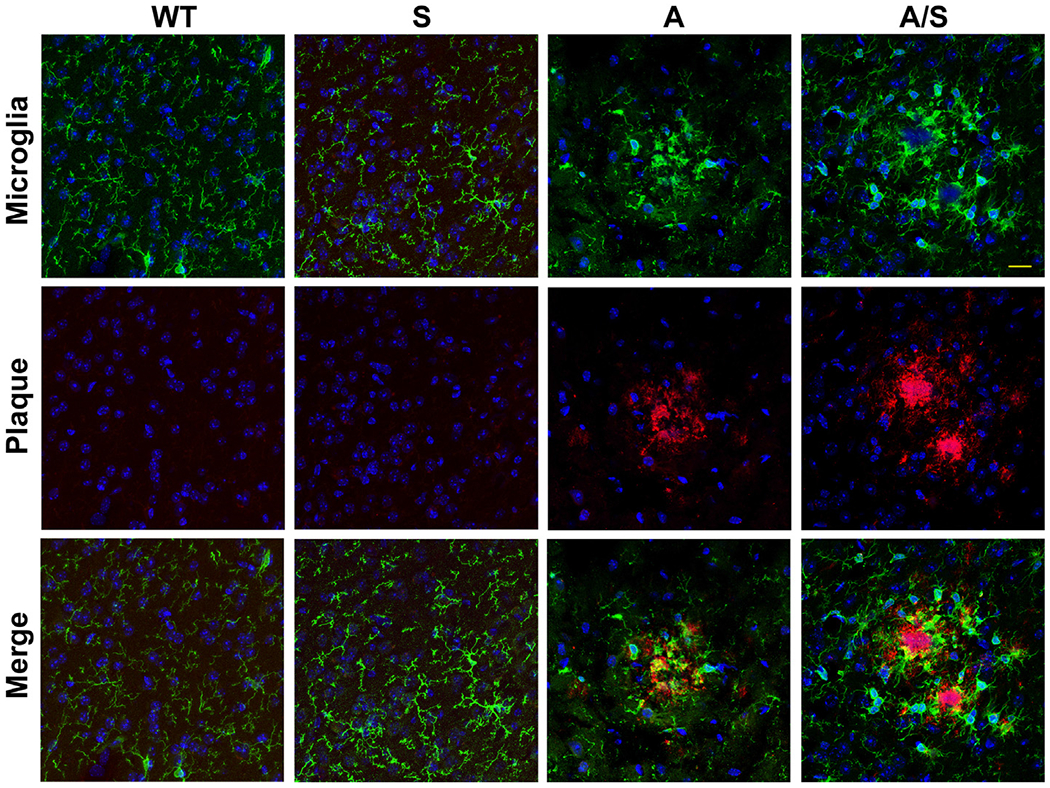
Microglial proliferation in the brain. Dual immunofluorescent staining was performed with mouse brain sections as in Fig. 6, with two primary antibodies, namely, mouse anti-β amyloid antibody (Cat # 2450; CST) and rabbit anti-Iba1 antibody (Cat # 019-19741; Wako Chemicals), followed by exposure to anti-mouse Cy3 (Red) and anti-rabbit FITC (green). DAPI (blue) was used to stain nuclei. Representative images (Bar-25 μm) are presented. Representative images from 6 animals for each group are shown. WT: Wild type, S: Sirt3−/−, A: APP/PS1, and A/S: APP/PS1/Sirt3−/−.
Fig. 8.
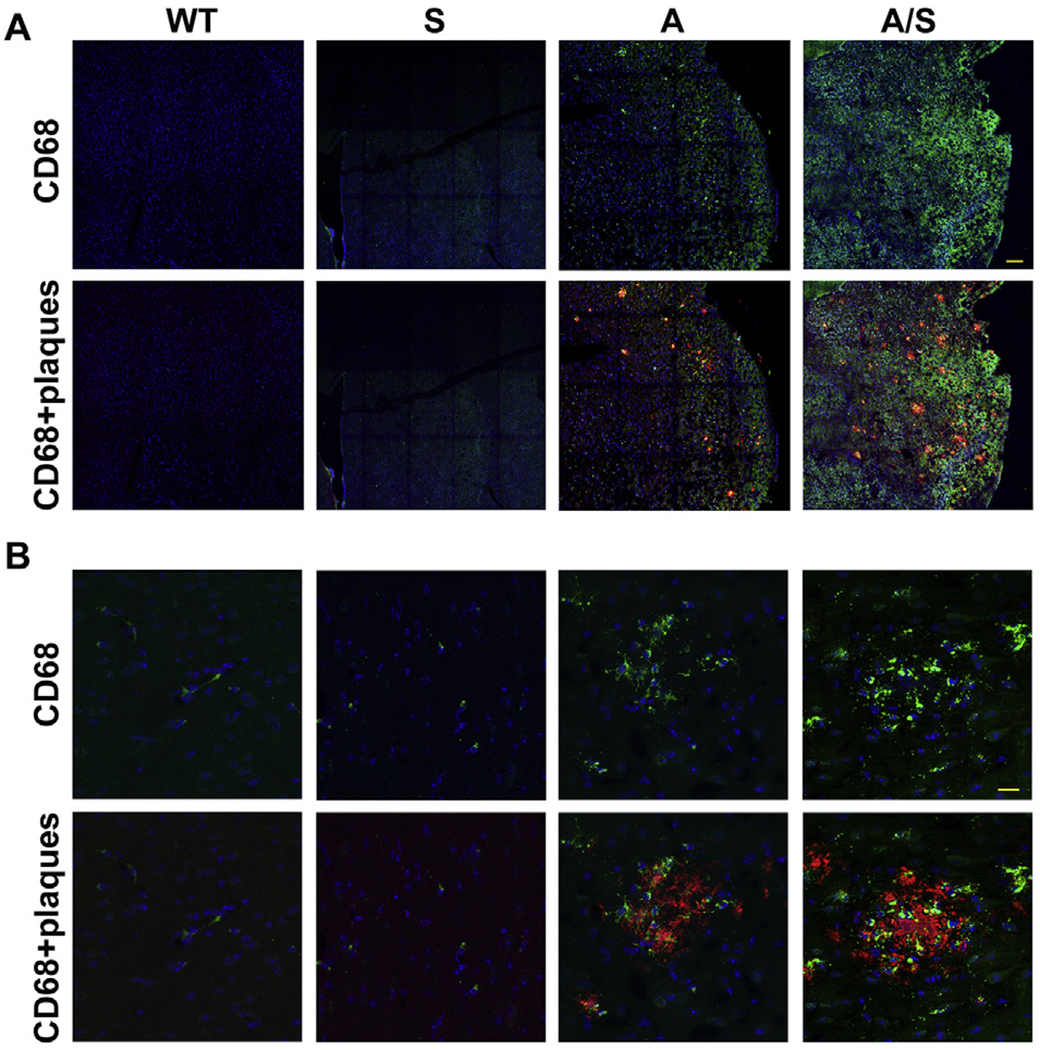
Microglial activation in the brain. Mouse brain sections were dual-immunostained for β amyloid plaques and CD68, a marker for activated microglia with mouse brain sections as in Fig. 6. Appropriate secondary antibodies linked to Cy3 (red) or FITC (green) were used so that the plaques were stained red and microglia cells were stained green. DAPI (blue) was used to stain nuclei. Images are presented at low (A; Bar-100 μm) and high (B; Bar-25 μm) magnification. Representative images from 6 animals for each group are presented. WT: Wild type, S: Sirt3−/−, A: APP/PS1, and A/S: APP/PS1/Sirt3−/−.
3.8. Astrocytosis in the brain
In a previous study, we had reported astrocytosis in the brain of Tg2576 mice, another transgenic mouse model for AD, especially around the plaques [55]. Therefore, immunofluorescent staining for glial fibrillary acidic protein (GFAP), an astrocyte marker, was performed with the mouse brain samples to determine the effect of Sirt3 gene deletion in the Alzheimer’s background. As expected, we observed abundance of astrocytes in APP/PS1 mouse brain (Fig. 9). Astrocytes colocalized with the amyloid plaques as in the case of microglia. There was significantly a greater number of astrocytes in the comorbid AD mice (Fig. 9; last panel). Quantitation of GFAP staining by volumetric analysis revealed 58% increase (P < 0.01) in astrocytes around the plaques in APP/PS1/Sirt3−/− mice, compared to APP/PS1 mice. Taken together, Sirt3 gene deletion in APP/PS1 mice resulted in increased amyloid plaque deposition and glial proliferation, suggesting that comorbidities may exacerbate AD pathogenesis.
Fig. 9.
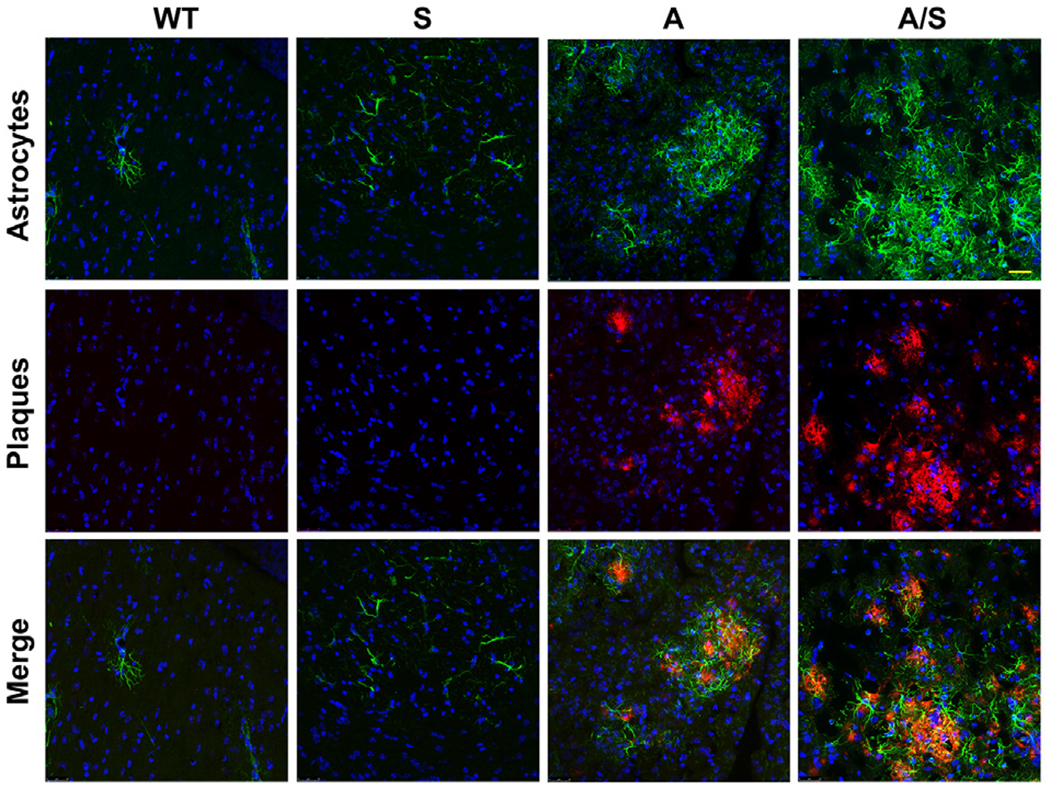
Astrocytosis in the brain. Dual immunofluorescence staining with the brain sections of four groups of mice (six each) with rabbit anti-β amyloid antibody and mouse GFAP antibodies, followed by exposure to Cy3 (red)-linked anti-rabbit IgG and FITC (green)-linked anti-mouse IgG. DAPI (blue) was used to stain nuclei. Representative images are presented at high magnification (Bar-25 μm). Representative images from 6 animals for each group are presented. WT: Wild type, S: Sirt3−/−, A: APP/PS1, and A/S: APP/PS1/Sirt3−/−.
4. Discussion
The life expectancy of the population with chronic diseases, including diabetes, hypertension and cardiovascular diseases, is steadily increasing with improved treatment options [11,12]. At the same time, this population is exposed to aging-associated neurodegenerative diseases, including AD [56]. This may be the main reason that the incidence of AD is projected to grow dramatically worldwide in the coming decades [16,57]. Clinical diagnosis of AD is preceded by a long cellular phase [39]. During this asymptomatic phase, there is a delicate balance between cognitive reserve and the progressive Alzheimer’s pathologies [58,59]. This balance can be tilted toward clinical dementia by the brain lesions caused by comorbidities [2]. The precondition for these comorbidities is MetS which has become a global problem [60]. In this study, we have generated APP/PS1/Sirt3−/− mice in which MetS is superimposed with amyloid pathology. Sirt3 gene deletion, resulted in an exacerbated phenotype in the comorbid AD mouse model, in terms of insulin resistance, neuroinflammation, plaque deposition and microgliosis. Our findings in this model at an early stage, suggest that MetS in mid-life may interact with amyloid pathology during the cellular phase and hasten the progression of AD pathogenesis.
Alzheimer’s transgenic mice, expressing human mutant APP and presenilin have advanced our knowledge of disease progression, with respect to amyloid deposition [61]. It has been also recognized that animal models that recapitulate the complexities of the human Alzheimer’s disease are needed [44]. The comorbid APP/PS1/Sirt3−/− mouse developed in this study is one such model. Our main objective is to determine how MetS in mid-life interacts with the early cellular phase of AD. Although comorbidities have been reported to exacerbate cognitive decline in AD [2–4], a specific mechanism has not been identified because of the complex nature of interactions. We took the approach of genetically inducing MetS in a transgenic mouse with amyloid pathology so that early interactions with the asymptomatic phase of AD can be studied. In our recent study [36], using Sirt3 deficiency as a model for MetS, we made novel observations on the brain metabolic dysregulation and neuroinflammation, both important causes of AD pathogenesis. Therefore, we deleted Sirt3 gene in APP/PS1 mouse, a well characterized model for amyloid pathology. An exacerbated phenotype was seen in critical end points of insulin resistance, neuroinflammation and amyloid plaque depositions in the comorbid AD mouse model.
Hyperinsulinemia and glucose intolerance were evident in APP/PS1 mice (Fig. 3). When combined with MetS, these markers of insulin resistance were further exacerbated in the comorbid AD model. Decrease in insulin sensitivity was observed in the brain, as shown by a decrease in the activation of Akt, a target of insulin receptor signaling. In addition, there was activation of stress-signaling pathways which can also interfere with insulin signaling. A previous study has reported central insulin resistance in two other mouse models with amyloid pathology, namely Tg2576 and 3xTg-AD mice [62]. In these mice, impaired insulin signaling was observed even before peripheral insulin resistance, suggesting the amyloid pathology to be the main driver of this finding. Insulin resistance can lead to decreased cerebral glucose utilization which is seen in the early stages of AD [63]. Experimental studies have also reported the CNS effects of peripheral insulin resistance. For example, feeding mice with high fat diet leads to palmitic acid deposition and insulin resistance in the hippocampus and plays a role in diet-induced cognitive dysfunction [64]. The production of Aβ in the hippocampal interstitial fluid is elevated following modulation of blood glucose levels in a mouse model of AD and these effects are further exacerbated in aged AD mice [65]. Aβ in turn can also interfere with insulin action [49], leading to a vicious cycle. Thus, improving insulin sensitivity in the AD brain as a therapeutic strategy [66] has more relevance in the case of comorbid AD.
Measuring the respiratory capacity with different substrates, is one of the approaches to assess the mitochondrial function. Because SIRT3 activates several members of the respiratory chain complex, its downregulation as in MetS is expected to impair respiration. We observed decreased mitochondrial respiration at multiple states with the brain samples of Sirt3−/− mice as in our previous report [36]. Brain mitochondrial dysfunction is also an important cause of Alzheimer’s pathogenesis [67,68]. Another study had reported significant decreases in oxygen flux in APP/PS1 mouse brain [69]. In contrast, we observed increased mitochondrial respiration in APP/PS1 mice at States 2 and 3. The probable reason could be the fact that our observation was at an early stage of 8 months whereas the previous study had measured the respiration at 15 months. It is possible that in response to Aβ-induced injury in the brain, there is a compensatory increase in the respiratory rates at early stages but with progressive amyloid pathology, this response may fail, leading to decrease in the mitochondrial respiration at 15 mo. Sirt3 gene deletion did decrease the respiration in APP/PS1/Sirt3−/− mice when compared to APP/PS1 mice, especially at State 3 with the substrates, pyruvate, malate, glutamate and succinate. These findings suggest that the early protective response to Aβ at the mitochondrial level may fail with coexisting MetS.
We had previously reported the elevation of IL-1β expression in Sirt3−/− mouse brain [36]. Neuroinflammatory markers are known to be elevated in Alzheimer’s brain [70]. As expected, we observed exacerbation of neuroinflammation in the comorbid AD mouse brain (Fig. 4). The mRNA levels of IL-1β, TNF-α and Cox-2 were significantly more in APP/PS1/Sirt3−/− mouse brain, compared to the brain samples of APP/PS1 and Sirt3−/− mice. In a previous study, we had demonstrated that IL-1β and TNF-α, together, induce an inflammatory loop by a mechanism involving the activation of transcription factors, NF-kB and STAT1 in a human neuroprogenitor cell-derived neuronal culture model [45]. We observed the synergistic induction of an array of inflammatory mediators by a combination of IL-1β and TNF-α, suggesting that these proinflammatory cytokines can sustain a vicious cycle of inflammatory response in the brain. Genome-wide association studies (GWAS) of AD patients have shown many risk factor genes to be in immune-regulatory pathways, especially in microglia [71]. These immune cells are the critical regulators of innate immune response in the brain. Microglial dysregulation is known to play a key role in causing neuroinflammation in AD [52,53]. Significant microglial proliferation, especially around the plaques, was seen in APP/PS1Sirt3−/− mouse brain when compared to APP/PS1 mice (Fig. 7). There was also increased staining for CD68 (Fig. 8), suggesting microglial activation which is in response to plaque deposition. However, chronic microglial activation as a result of elevated amyloid plaque deposition can be detrimental. The inability of microglia to clear them leads to a proinflammatory phenotype of microglia. Sirt3 deficiency is expected to dysregulate microglia through multiple mechanisms. First, peripheral inflammation is known to prime the microglia, leading to its exacerbated response to later stimulation [72]. Second, microglia are known to change their phenotype in response to stress in the brain environment, especially in neuronal synapses [73]. Third, Sirt3 downregulation within microglia can also affect its metabolism, an under-studied area of research [74]. Microglia have a high demand for energy production because of their constant patrolling function [74]. Therefore, Sirt3 gene deletion-induced metabolic stress in the neurons as well as within microglia can lead to their dysregulation. In addition to microglial dysregulation, increased astrocyte proliferation near the plaques was seen in APP/PS/Sirt3−/− mouse brain (Fig. 9). Thus, MetS may induce increased glial proliferation in the AD brain, setting the stage for progressive neurodegeneration.
A key finding with our new animal model was the increase in amyloid plaque load as a result of Sirt3 deletion (Fig. 6). Increases in the number as well as the size of the plaques were observed in APP/PS1/Sirt3−/− mouse brain, compared to the brain samples of APP/PS1 mice as revealed by volumetric analysis. We propose two mechanisms by which SIRT3 deficiency may increase amyloid deposition. First, hyperinsulinemia, resulting from insulin resistance, is known to sequester insulin degrading enzyme (IDE) which is one of the enzymes that degrade and clear Aβ [75–77]. Decrease of IDE over time can lead to increased amyloid deposition. Second, Sirt3 deficiency can dysregulate microglial function, leading to decreased clearance of amyloid plaques. Their inability to clear the progressive amyloid deposition results in their sustained activation and elevation of inflammatory markers in the comorbid AD mouse brain. Although we have focused on the effects of MetS on amyloid pathology alone in this study, we anticipate that MetS may interact with tau pathology as well because insulin resistance, a component of MetS, is known facilitate tau hyperphosphorylation [78], the preceding step to neurofibrillary tangle formation. We will take up the crossing of Sirt3−/− mice with a transgenic mouse model expressing human mutant tau (P301L) in a future study.
While, comorbidities make the treatment of AD a challenge, they also present therapeutic opportunities. The clinical trials targeting Alzheimer’s pathologies may have better success when combined with drugs targeting coexisting conditions, including diabetes [79]. For example, glucagon-like peptide-1 (GLP-1)-based therapies, available for the treatment of type 2 diabetes [80,81], can be used in the treatment of AD and comorbid AD. These drugs either sustain the endogenous GLP-1 levels by inhibiting the DPP-4 enzymes that degrade GLP-1 or belong to DPP-4-resistant GLP-1 analogs. We have demonstrated by in vivo and in vitro studies that GLP-1 has neuroprotective and anti-inflammatory effects in the brain [82,83]. For example, markers of neuroinflammation were elevated in the brain samples of ZDF rats, a model for metabolic syndrome, obesity and type 2 diabetes [83] and treatment with a DPP-4 inhibitor, alogliptin, significantly reduced neuroinflammation. In addition, alogliptin activated CREB, a transcription factor that is needed for cognition and memory formation. In another in vitro study, we demonstrated the expression of GLP-1 receptors in a neural stem cell-derived human brain neuronal model [82]. GLP-1 also induced BDNF promoter in a CREB-dependent manner, suggesting that GLP-1 has independent neuroprotective effects in the brain. Therefore, diabetic patients receiving GLP-1-based drugs are less likely to develop dementia because of their parallel beneficial effects in the brain, in addition to lowering blood glucose levels.
Our previous report [36] and the findings of the current study suggest that SIRT3 is a potential therapeutic target for AD because it mediates adaptive response to metabolic stress, improves mitochondrial function and upregulates antioxidant defense mechanism in the brain. Nicotinamide adenine dinucleotide (NAD+) is a cosubstrate for sirtuins, including SIRT3 [84,85]. Depletion of NAD+ plays a critical role in neurodegeneration [85–87]. Therefore, increasing the cellular NAD+ content is emerging as an important therapeutic strategy to activate the sirtuin pathway [88]. Administration of nicotinamide riboside (NR), a precursor of NAD+, leads to increase in the cellular level of NAD+ [89]. NR prevents high-fat diet-induced obesity in mice through activation of SIRT1 and SIRT3 [90] and reverses insulin resistance and glucose intolerance in a mouse model for type 2 diabetes [91]. Furthermore, it has been reported that NR improves cognition in AD mice by inducing the expression of PGC-1-α [89]. Nicotinamide mononucleotide (NMN) another precursor of NAD, has been also shown to improve brain mitochondrial function in Alzheimer’s mice [92]. Thus, SIRT3 is a potential therapeutic target for AD even in the absence of comorbidities.
Acknowledgements
This work was carried out with the use of resources and facilities at the Rocky Mountain Regional Veterans Affairs Medical Center. This study was supported by a Merit Review grant NEUD-004-07F from the Veterans Administration (to S.P.). Confocal microscopy was carried out at the VA Microscopy Core Facility.
Abbreviations:
- AD
Alzheimer’s disease
- Aβ
Amyloid beta
- AGE
advanced glycation end products
- APP/PS1
Amyloid precursor protein/presenilin1
- CREB
Cyclic AMP response element binding protein
- CRP
C-reactive protein
- ELISA
Enzyme-linked immunosorbent assay
- FITC
Fluorescein isothiocyanate
- GFAP
Glial fibrillary acidic protein
- MCI
mild cognitive impairment
- IL-1β
Interleukin-1 beta
- MetS
metabolic syndrome
- NAD+
Nicotinamide adenine dinucleotide
- NMN
Nicotinamide mononucleotide
- RT-PCR
Reverse transcription-polymerase chain reaction
- SIRT3 (protein)and Sirt3 (gene)-mouse
Silent information regulator 3
- TNF-α
Tumor necrosis factor-alpha
- WT
Wild type
Footnotes
Declaration of competing interest
The authors declare no competing interests.
References
- [1].Selkoe DJ, Alzheimer’s disease: genes, proteins and therapy, Physiol. Rev 81 (2001) 741–766. [DOI] [PubMed] [Google Scholar]
- [2].White LR, Edland SD, Hemmy LS, Montine KS, Zarow C, Sonnen JA, Uyehara-Lock JH, Gelber RP, Ross GW, Petrovitch H, Masaki KH, Lim KO, Launer LJ, Montine TJ, Neuropathologic comorbidity and cognitive impairment in the Nun and Honolulu-Asia Aging Studies, Neurology 86 (2016) 1000–1008. [DOI] [PMC free article] [PubMed] [Google Scholar]
- [3].Montine TJ, Sonnen JA, Montine KS, Crane PK, Larson EB, Adult Changes in Thought study: dementia is an individually varying convergent syndrome with prevalent clinically silent diseases that may be modified by some commonly used therapeutics, Curr. Alzheimer Res 9 (2012) 718–723. [DOI] [PMC free article] [PubMed] [Google Scholar]
- [4].Kawas CH, Kim RC, Sonnen JA, Bullain SS, Trieu T, Corrada MM, Multiple pathologies are common and related to dementia in the oldest-old: the 90+ study, Neurology 85 (2015) 535–542. [DOI] [PMC free article] [PubMed] [Google Scholar]
- [5].Tyas SL, Salazar JC, Snowdon DA, Desrosiers MF, Riley KP, Mendiondo MS, Kryscio RJ, Transitions to mild cognitive impairments, dementia, and death: findings from the Nun study, Am. J. Epidemiol 165 (2007) 1231–1238. [DOI] [PMC free article] [PubMed] [Google Scholar]
- [6].Gelber RP, Launer LJ, White LR, The Honolulu-Asia Aging study: epidemiologic and neuropathologic research on cognitive impairment, Curr. Alzheimer Res 9 (2012) 664–672. [DOI] [PMC free article] [PubMed] [Google Scholar]
- [7].Gelber RP, Ross GW, Petrovitch H, Masaki KH, Launer LJ, White LR, Antihypertensive medication use and risk of cognitive impairment: the Honolulu-Asia Aging study, Neurology 81 (2013) 888–895. [DOI] [PMC free article] [PubMed] [Google Scholar]
- [8].Qiu C, Fratiglioni L, A major role for cardiovascular burden in age-related cognitive decline, Nat. Rev. Cardiol 12 (2015) 267–277. [DOI] [PubMed] [Google Scholar]
- [9].Snyder HM, Corriveau RA, Craft S, Faber JE, Greenberg SM, Knopman D, Lamb BT, Montine TJ, Nedergaard M, Schaffer CB, Schneider JA, Wellington C, Wilcock DM, Zipfel GJ, Zlokovic B, Bain LJ, Bosetti F, Galis ZS, Koroshetz W, Carrillo MC, Vascular contributions to cognitive impairment and dementia including Alzheimer’s disease, Alzheimers Dement. 11 (2015) 710–717. [DOI] [PMC free article] [PubMed] [Google Scholar]
- [10].Raz L, Knoefel J, Bhaskar K, The neuropathology and cerebrovascular mechanisms of dementia, J. Cereb. Blood Flow Metab 36 (2016) 172–186. [DOI] [PMC free article] [PubMed] [Google Scholar]
- [11].Ioacara S, Guja C, Ionescu-Tirgoviste C, Fica S, Sabau S, Radu S, Micu A, Tiu C, Improvements in life expectancy in adult type 2 diabetes patients in the last six decades, Diabetes Res. Clin. Pract 92 (2011) 400–404. [DOI] [PubMed] [Google Scholar]
- [12].Mensah GA, Wei GS, Sorlie PD, Fine LJ, Rosenberg Y, Kaufmann PG, Mussolino ME, Hsu LL, Addou E, Engelgau MM, Gordon D, Decline in cardiovascular mortality: possible causes and implications, Circ. Res 120 (2017) 366–380. [DOI] [PMC free article] [PubMed] [Google Scholar]
- [13].Lusis AJ, Attie AD, Reue K, Metabolic syndrome: from epidemiology to systems biology, Nat. Rev. Genet 9 (2008) 819–830. [DOI] [PMC free article] [PubMed] [Google Scholar]
- [14].Aguilar M, Bhuket T, Torres S, Liu B, Wong RJ, Prevalence of the metabolic syndrome in the United States, 2003–2012, JAMA 313 (2015) 1973–1974. [DOI] [PubMed] [Google Scholar]
- [15].Forti P, Pisacane N, Rietti E, Lucicesare A, Olivelli V, Mariani E, Mecocci P, Ravaglia G, Metabolic syndrome and risk of dementia in older adults, J. Am. Geriatr. Soc 58 (2010) 487–492. [DOI] [PubMed] [Google Scholar]
- [16].Frisardi V, Solfrizzi V, Seripa D, Capurso C, Santamato A, Sancarlo D, Vendemiale G, Pilotto A, Panza F, Metabolic-cognitive syndrome: a cross-talk between metabolic syndrome and Alzheimer’s disease, Ageing Res. Rev 9 (2010) 399–417. [DOI] [PubMed] [Google Scholar]
- [17].Panza F, Frisardi V, Seripa D, Imbimbo BP, Sancarlo D, D’Onofrio G, Addante F, Paris F, Pilotto A, Solfrizzi V, Metabolic syndrome, mild cognitive impairment, and dementia, Curr. Alzheimer Res 8 (2011) 492–509. [DOI] [PubMed] [Google Scholar]
- [18].Kim B, Feldman EL, Insulin resistance in the nervous system, Trends Endocrinol. Metab 23 (2011) 133–141. [DOI] [PMC free article] [PubMed] [Google Scholar]
- [19].Vanhanen M, Koivisto K, Moilanen L, Helkala EL, Hanninen T, Soininen H, Kervinen K, Kesaniemi YA, Laakso M, Kuusisto J, Association of metabolic syndrome with Alzheimer disease: a population-based study, Neurology 67 (2006) 843–847. [DOI] [PubMed] [Google Scholar]
- [20].Razay G, Vreugdenhil A, Wilcock G, The metabolic syndrome and Alzheimer disease, Arch. Neurol 64 (2007) 93–96. [DOI] [PubMed] [Google Scholar]
- [21].Solfrizzi V, Scafato E, Capurso C, D’Introno A, Colacicco AM, Frisardi V, Vendemiale G, Baldereschi M, Crepaldi G, Di Carlo A, Galluzzo L, Gandin C, Inzitari D, Maggi S, Capurso A, Panza F, Metabolic syndrome and the risk of vascular dementia: the Italian Longitudinal Study on Ageing, J. Neurol. Neurosurg. Psychiatry 81 (2010) 433–440. [DOI] [PubMed] [Google Scholar]
- [22].Ng TP, Feng L, Nyunt MS, Gao Q, Lim ML, Collinson SL, Chong MS, Lim WS, Lee TS, Yap P, Yap KB, Metabolic syndrome and the risk of mild cognitive impairment and progression to dementia: follow-up of the Singapore Longitudinal Ageing Study Cohort, JAMA Neurology 73 (2016) 456–463. [DOI] [PubMed] [Google Scholar]
- [23].Hishikawa N, Fukui Y, Sato K, Kono S, Yamashita T, Ohta Y, Deguchi K, Abe K, Cognitive and affective functions in Alzheimer’s disease patients with metabolic syndrome, Eur. J. Neurol 23 (2016) 339–345. [DOI] [PubMed] [Google Scholar]
- [24].Cai W, Ramdas M, Zhu L, Chen X, Striker GE, Vlassara H, Oral advanced glycation endproducts (AGEs) promote insulin resistance and diabetes by depleting the antioxidant defenses AGE receptor-1 and sirtuin 1, Proc. Natl. Acad. Sci. U. S. A 109 (2012) 15888–15893. [DOI] [PMC free article] [PubMed] [Google Scholar]
- [25].Dinel AL, Andre C, Aubert A, Ferreira G, Laye S, Castanon N, Cognitive and emotional alterations are related to hippocampal inflammation in a mouse model of metabolic syndrome, PLoS One 6 (2011) e24325. [DOI] [PMC free article] [PubMed] [Google Scholar]
- [26].Ng RC, Cheng OY, Jian M, Kwan JS, Ho PW, Cheng KK, Yeung PK, Zhou LL, Hoo RL, Chung SK, Xu A, Lam KS, Chan KH, Chronic adiponectin deficiency leads to Alzheimer’s disease-like cognitive impairments and pathologies through AMPK inactivation and cerebral insulin resistance in aged mice, Mol. Neurodegener 11 (2016) 71. [DOI] [PMC free article] [PubMed] [Google Scholar]
- [27].Goodman E, Daniels SR, Meigs JB, Dolan LM, Instability in the diagnosis of metabolic syndrome in adolescents, Circulation 115 (2007) 2316–2322. [DOI] [PMC free article] [PubMed] [Google Scholar]
- [28].Gaillard TR, The metabolic syndrome and its components in African-American women: emerging trends and implications, Front. Endocrinol 8 (2017) 383. [DOI] [PMC free article] [PubMed] [Google Scholar]
- [29].Guzman M, Zbella E, Alvarez SS, Nguyen JL, Imperial E, Troncale FJ, Holub C, Mallhi AK, VanWyk S, Effect of an intensive lifestyle intervention on the prevalence of metabolic syndrome and its components among overweight and obese adults, J. Public Health (Oxf) (2019), 10.1093/pubmed/fdzl70. [DOI] [PMC free article] [PubMed] [Google Scholar]
- [30].Kanoski SE, Davidson TL, Western diet consumption and cognitive impairment: links to hippocampal dysfunction and obesity, Physiol. Behav 103 (2011) 59–68. [DOI] [PMC free article] [PubMed] [Google Scholar]
- [31].Hirschey MD, Shimazu T, Huang JY, Schwer B, Verdin E, SIRT3 regulates mitochondrial protein acetylation and intermediary metabolism, Cold Spring Harb. Symp. Quant. Biol 76 (2011) 267–277. [DOI] [PubMed] [Google Scholar]
- [32].Guarente L, Sirtuins as potential targets for metabolic syndrome, Nature 444 (2006) 868–874. [DOI] [PubMed] [Google Scholar]
- [33].Hirschey MD, Shimazu T, Jing E, Grueter CA, Collins AM, Aouizerat B, Stancakova A, Goetzman E, Lam MM, Schwer B, Stevens RD, Muehlbauer MJ, Kakar S, Bass NM, Kuusisto J, Laakso M, Alt FW, Newgard CB, Farese RV Jr., Kahn CR, Verdin E, SIRT3 deficiency and mitochondrial protein hyperacetylation accelerate the development of the metabolic syndrome, Mol. Cell 44 (2011) 177–190. [DOI] [PMC free article] [PubMed] [Google Scholar]
- [34].Jing E, Emanuelli B, Hirschey MD, Boucher J, Lee KY, Lombard D, Verdin EM, Kahn CR, Sirtuin-3 (Sirt3) regulates skeletal muscle metabolism and insulin signaling via altered mitochondrial oxidation and reactive oxygen species production, Proc. Natl. Acad. Sci. U. S. A 108 (2011) 14608–14613. [DOI] [PMC free article] [PubMed] [Google Scholar]
- [35].Green MF, Hirschey MD, SIRT3 weighs heavily in the metabolic balance: a new role for SIRT3 in metabolic syndrome, J. Gerontol. A: Biol. Sci. Med. Sci 68 (2013) 105–107. [DOI] [PubMed] [Google Scholar]
- [36].Tyagi A, Nguyen CU, Chong T, Michel CR, Fritz KS, Reisdorph N, Knaub L, Reusch JEB, Pugazhenthi S, SIRT3 deficiency-induced mitochondrial dysfunction and inflammasome formation in the brain, Sci. Rep 8 (2018) 17547. [DOI] [PMC free article] [PubMed] [Google Scholar]
- [37].Heneka MT, Carson MJ, El Khoury J, Landreth GE, Brosseron F, Feinstein DL, Jacobs AH, Wyss-Coray T, Vitorica J, Ransohoff RM, Herrup K, Frautschy SA, Finsen B, Brown GC, Verkhratsky A, Yamanaka K, Koistinaho J, Latz E, Halle A, Petzold GC, Town T, Morgan D, Shinohara ML, Perry VH, Holmes C, Bazan NG, Brooks DJ, Hunot S, Joseph B, Deigendesch N, Garaschuk O, Boddeke E, Dinarello CA, Breitner JC, Cole GM, Golenbock DT, Kummer MP, Neuroinflammation in Alzheimer’s disease, Lancet Neurol, 14 (2015) 388–405. [DOI] [PMC free article] [PubMed] [Google Scholar]
- [38].Wilkins HM, Swerdlow RH, Relationships between mitochondria and neuroinflammation: implications for Alzheimer’s disease, Curr. Top. Med. Chem 16 (2016) 849–857. [DOI] [PMC free article] [PubMed] [Google Scholar]
- [39].De Strooper B, Karran E, The cellular phase of Alzheimer’s disease, Cell 164 (2016) 603–615. [DOI] [PubMed] [Google Scholar]
- [40].Jankowsky JL, Fadale DJ, Anderson J, Xu GM, Gonzales V, Jenkins NA, Copeland NG, Lee MK, Younkin LH, Wagner SL, Younkin SG, Borchelt DR, Mutant presenilins specifically elevate the levels of the 42 residue beta-amyloid peptide in vivo: evidence for augmentation of a 42-specific gamma secretase, Hum. Mol. Genet 13 (2004) 159–170. [DOI] [PubMed] [Google Scholar]
- [41].Eimer WA, Vassar R, Neuron loss in the 5XFAD mouse model of Alzheimer’s disease correlates with intraneuronal Abeta42 accumulation and Caspase-3 activation, Mol. Neurodegener 8 (2013) 2. [DOI] [PMC free article] [PubMed] [Google Scholar]
- [42].Yoshiyama Y, Higuchi M, Zhang B, Huang SM, Iwata N, Saido TC, Maeda J, Suhara T, Trojanowski JQ, Lee VM, Synapse loss and microglial activation precede tangles in a P301S tauopathy mouse model, Neuron 53 (2007) 337–351. [DOI] [PubMed] [Google Scholar]
- [43].Oddo S, Caccamo A, Shepherd JD, Murphy MP, Golde TE, Kayed R, Metherate R, Mattson MP, Akbari Y, LaFerla FM, Triple-transgenic model of Alzheimer’s disease with plaques and tangles: intracellular Abeta and synaptic dysfunction, Neuron 39 (2003) 409–421. [DOI] [PubMed] [Google Scholar]
- [44].Snyder HM, Hendrix J, Bain LJ, Carrillo MC, Alzheimer’s disease research in the context of the national plan to address Alzheimer’s disease, Mol. Asp. Med 43–44 (2015) 16–24. [DOI] [PubMed] [Google Scholar]
- [45].Pugazhenthi S, Zhang Y, Bouchard R, Mahaffey G, Induction of an inflammatory loop by interleukin-1beta and tumor necrosis factor-alpha involves NF-kB and STAT-1 in differentiated human neuroprogenitor cells, PLoS One 8 (2013) e69585. [DOI] [PMC free article] [PubMed] [Google Scholar]
- [46].Qin L, Bouchard R, Pugazhenthi S, Regulation of cAMP response element binding protein during neuroglial interactions, J. Neurochem 136 (2015) 918–930. [DOI] [PubMed] [Google Scholar]
- [47].Dong YT, Cao K, Tan LC, Wang XL, Qi XL, Xiao Y, Guan ZZ, Stimulation of SIRT1 attenuates the level of oxidative stress in the brains of APP/PS1 double transgenic mice and in primary neurons exposed to oligomers of the amyloid-beta peptide, J. Alzheimers Dis 63 (2018) 283–301. [DOI] [PubMed] [Google Scholar]
- [48].Yang W, Zou Y, Zhang M, Zhao N, Tian Q, Gu M, Liu W, Shi R, Lu Y, Yu W, Mitochondrial Sirt3 expression is decreased in APP/PS1 double transgenic mouse model of Alzheimer’s disease, Neurochem. Res 40 (2015) 1576–1582. [DOI] [PubMed] [Google Scholar]
- [49].Talbot K, Wang HY, Kazi H, Han LY, Bakshi KP, Stucky A, Fuino RL, Kawaguchi KR, Samoyedny AJ, Wilson RS, Arvanitakis Z, Schneider JA, Wolf BA, Bennett DA, Trojanowski JQ, Arnold SE, Demonstrated brain insulin resistance in Alzheimer’s disease patients is associated with IGF-1 resistance, IRS-1 dysregulation, and cognitive decline, J. Clin. Invest 122 (2012) 1316–1338. [DOI] [PMC free article] [PubMed] [Google Scholar]
- [50].Stanley M, Macauley SL, Caesar EE, Koscal LJ, Moritz W, Robinson GO, Roh J, Keyser J, Jiang H, Holtzman DM, The effects of peripheral and central high insulin on brain insulin signaling and amyloid-beta in young and old APP/PS1 mice, J. Neurosci 36 (2016) 11704–11715. [DOI] [PMC free article] [PubMed] [Google Scholar]
- [51].Standen CL, Kennedy NJ, Flavell RA, Davis RJ, Signal transduction cross talk mediated by Jun N-terminal kinase-interacting protein and insulin receptor substrate scaffold protein complexes, Mol. Cell. Biol 29 (2009) 4831–4840. [DOI] [PMC free article] [PubMed] [Google Scholar]
- [52].Navarro V, Sanchez-Mejias E, Jimenez S, Munoz-Castro C, Sanchez-Varo R, Davila JC, Vizuete M, Gutierrez A, Vitorica J, Microglia in Alzheimer’s disease: activated, dysfunctional or degenerative, Front. Aging Neurosci 10 (2018) 140. [DOI] [PMC free article] [PubMed] [Google Scholar]
- [53].Sarlus H, Heneka MT, Microglia in Alzheimer’s disease, J. Clin. Invest 127 (2017) 3240–3249. [DOI] [PMC free article] [PubMed] [Google Scholar]
- [54].Gold M, El Khoury J, Beta-amyloid, microglia, and the inflammasome in Alzheimer’s disease, Semin Immunopathol, 37 (2015) 607–611. [DOI] [PMC free article] [PubMed] [Google Scholar]
- [55].Pugazhenthi S, Wang M, Pham S, Sze CI, Eckman CB, Downregulation of CREB expression in Alzheimer’s brain and in Abeta-treated rat hippocampal neurons, Mol. Neurodegener 6 (2011) 60. [DOI] [PMC free article] [PubMed] [Google Scholar]
- [56].Pugazhenthi S, Qin L, Reddy PH, Common neurodegenerative pathways in obesity, diabetes, and Alzheimer’s disease, Biochim. Biophys. Acta 1863 (2016) 1037–1045. [DOI] [PMC free article] [PubMed] [Google Scholar]
- [57].Guzman-Martinez L, Maccioni RB, Farias GA, Fuentes P, Navarrete LP, Biomarkers for Alzheimer’s disease, Curr. Alzheimer Res 16 (2019) 518–528. [DOI] [PubMed] [Google Scholar]
- [58].Sperling R, Mormino E, Johnson K, The evolution of preclinical Alzheimer’s disease: implications for prevention trials, Neuron 84 (2014) 608–622. [DOI] [PMC free article] [PubMed] [Google Scholar]
- [59].Buchman AS, Yu L, Boyle PA, Schneider JA, De Jager PL, Bennett DA, Higher brain BDNF gene expression is associated with slower cognitive decline in older adults, Neurology 86 (2016) 735–741. [DOI] [PMC free article] [PubMed] [Google Scholar]
- [60].Saklayen MG, The global epidemic of the metabolic syndrome, Curr. Hypertens. Rep 20 (2018) 12. [DOI] [PMC free article] [PubMed] [Google Scholar]
- [61].Sasaguri H, Nilsson P, Hashimoto S, Nagata K, Saito T, De Strooper B, Hardy J, Vassar R, Winblad B, Saido TC, APP mouse models for Alzheimer’s disease preclinical studies, EMBO J. 36 (2017) 2473–2487. [DOI] [PMC free article] [PubMed] [Google Scholar]
- [62].Velazquez R, Tran A, Ishimwe E, Denner L, Dave N, Oddo S, Dineley KT, Central insulin dysregulation and energy dyshomeostasis in two mouse models of Alzheimer’s disease, Neurobiol. Aging 58 (2017) 1–13. [DOI] [PMC free article] [PubMed] [Google Scholar]
- [63].Cunnane S, Nugent S, Roy M, Courchesne-Loyer A, Croteau E, Tremblay S, Castellano A, Pifferi F, Bocti C, Paquet N, Begdouri H, Bentourkia M, Turcotte A, Allard M, Barberger-Gateau P, Fulop T, Rapoport SI, Brain fuel metabolism, aging, and Alzheimer’s disease, Nutrition 27 (2011) 3–20. [DOI] [PMC free article] [PubMed] [Google Scholar]
- [64].Spinelli M, Fusco S, Mainardi M, Scala F, Natale F, Lapenta R, Mattera A, Rinaudo M, Li Puma DD, Ripoli C, Grassi A, D’Ascenzo M, Grassi C, Brain insulin resistance impairs hippocampal synaptic plasticity and memory by increasing GluA1 palmitoylation through FoxO3a, Nat. Commun 8 (2017) 2009. [DOI] [PMC free article] [PubMed] [Google Scholar]
- [65].Macauley SL, Stanley M, Caesar EE, Yamada SA, Raichle ME, Perez R, Mahan TE, Sutphen CL, Holtzman DM, Hyperglycemia modulates extracellular amyloid-beta concentrations and neuronal activity in vivo, J. Clin. Invest 125 (2015) 2463–2467. [DOI] [PMC free article] [PubMed] [Google Scholar]
- [66].Diehl T, Mullins R, Kapogiannis D, Insulin resistance in Alzheimer’s disease, Transl. Res 183 (2017) 26–40. [DOI] [PMC free article] [PubMed] [Google Scholar]
- [67].Caldwell CC, Yao J, Brinton RD, Targeting the prodromal stage of Alzheimer’s disease: bioenergetic and mitochondrial opportunities, Neurotherapeutics 12 (2015) 66–80. [DOI] [PMC free article] [PubMed] [Google Scholar]
- [68].Du H, Guo L, Yan S, Sosunov AA, McKhann GM, Yan SS, Early deficits in synaptic mitochondria in an Alzheimer’s disease mouse model, Proc. Natl. Acad. Sci. U. S. A 107 (2010) 18670–18675. [DOI] [PMC free article] [PubMed] [Google Scholar]
- [69].Derungs R, Camici GG, Spescha RD, Welt T, Tackenberg C, Spani C, Wirth F, Grimm A, Eckert A, Nitsch RM, Kulic L, Genetic ablation of the p66(Shc) adaptor protein reverses cognitive deficits and improves mitochondrial function in an APP transgenic mouse model of Alzheimer’s disease, Mol. Psychiatry 22 (2017) 605–614. [DOI] [PubMed] [Google Scholar]
- [70].Heppner FL, Ransohoff RM, Becher B, Immune attack: the role of inflammation in Alzheimer disease, Nat. Rev. Neurosci 16 (2015) 358–372. [DOI] [PubMed] [Google Scholar]
- [71].Mhatre SD, Tsai CA, Rubin AJ, James ML, Andreasson KI, Microglial malfunction: the third rail in the development of Alzheimer’s disease, Trends Neurosci. 38 (2015) 621–636. [DOI] [PMC free article] [PubMed] [Google Scholar]
- [72].Norden DM, Godbout JP, Review: microglia of the aged brain: primed to be activated and resistant to regulation, Neuropathol. Appl. Neurobiol 39 (2013) 19–34. [DOI] [PMC free article] [PubMed] [Google Scholar]
- [73].Hickman SE, Kingery ND, Ohsumi TK, Borowsky ML, Wang LC, Means TK, El Khoury J, The microglial sensome revealed by direct RNA sequencing, Nat. Neurosci 16 (2013) 1896–1905. [DOI] [PMC free article] [PubMed] [Google Scholar]
- [74].Kalsbeek MJ, Mulder L, Yi CX, Microglia energy metabolism in metabolic disorder, Mol. Cell. Endocrinol 438 (2016) 27–35. [DOI] [PubMed] [Google Scholar]
- [75].Farris W, Mansourian S, Chang Y, Lindsley L, Eckman EA, Frosch MP, Eckman AB, Tanzi RE, Selkoe DJ, Guenette S, Insulin-degrading enzyme regulates the levels of insulin, amyloid beta-protein, and the beta-amyloid precursor protein intracellular domain in vivo, Proc. Natl. Acad. Sci. U. S. A 100 (2003) 4162–4167. [DOI] [PMC free article] [PubMed] [Google Scholar]
- [76].Zhao L, Teter B, Morihara T, Lim GP, Ambegaokar SS, Ubeda OJ, Frautschy SA, Cole GM, Insulin-degrading enzyme as a downstream target of insulin receptor signaling cascade: implications for Alzheimer’s disease intervention, J. Neurosci 24 (2004) 11120–11126. [DOI] [PMC free article] [PubMed] [Google Scholar]
- [77].Kurochkin IV, Guarnera E, Berezovsky IN, Insulin-degrading enzyme in the fight against Alzheimer’s disease, Trends Pharmacol. Sci 39 (2018) 49–58. [DOI] [PubMed] [Google Scholar]
- [78].El Khoury NB, Gratuze M, Papon MA, Bretteville A, Planel E, Insulin dysfunction and Tau pathology, Front. Cell. Neurosci 8 (2014) 22. [DOI] [PMC free article] [PubMed] [Google Scholar]
- [79].Sebastiao I, Candeias E, Santos MS, de Oliveira CR, Moreira PI, Duarte AI, Insulin as a bridge between type 2 diabetes and Alzheimer disease - how anti-diabetics could be a solution for dementia, Front. Endocrinol 5 (2014) 110. [DOI] [PMC free article] [PubMed] [Google Scholar]
- [80].Drucker DJ, Nauck MA, The incretin system: glucagon-like peptide-1 receptor agonists and dipeptidyl peptidase-4 inhibitors in type 2 diabetes, Lancet 368 (2006) 1696–1705. [DOI] [PubMed] [Google Scholar]
- [81].Baetta R, Corsini A, Pharmacology of dipeptidyl peptidase-4 inhibitors: similarities and differences, Drugs 71 (2011) 1441–1467. [DOI] [PubMed] [Google Scholar]
- [82].Velmurugan K, Bouchard R, Mahaffey G, Pugazhenthi S, Neuroprotective actions of glucagon-like peptide-1 in differentiated human neuroprogenitor cells, J. Neurochem 123 (2012) 919–931. [DOI] [PubMed] [Google Scholar]
- [83].Qin L, Chong T, Rodriguez R, Pugazhenthi S, Glucagon-like peptide-1-mediated modulation of inflammatory pathways in the diabetic brain: relevance to Alzheimer’s disease, Curr. Alzheimer Res 13 (2016) 1346–1355. [DOI] [PubMed] [Google Scholar]
- [84].Imai S, Guarente L, NAD+ and sirtuins in aging and disease, Trends Cell Biol. 24 (2014) 464–471. [DOI] [PMC free article] [PubMed] [Google Scholar]
- [85].Verdin E, NAD(+) in aging, metabolism, and neurodegeneration, Science 350 (2015) 1208–1213. [DOI] [PubMed] [Google Scholar]
- [86].Zhu XH, Lu M, Lee BY, Ugurbil K, Chen W, In vivo NAD assay reveals the intracellular NAD contents and redox state in healthy human brain and their age dependences, Proc. Natl. Acad. Sci. U. S. A 112 (2015) 2876–2881. [DOI] [PMC free article] [PubMed] [Google Scholar]
- [87].Zhang H, Ryu D, Wu Y, Gariani K, Wang X, Luan P, D’Amico D, Ropelle ER, Lutolf MP, Aebersold R, Schoonjans K, Menzies KJ, Auwerx J, NAD(+) repletion improves mitochondrial and stem cell function and enhances life span in mice, Science 352 (2016) 1436–1443. [DOI] [PubMed] [Google Scholar]
- [88].Imai S, A possibility of nutriceuticals as an anti-aging intervention: activation of sirtuins by promoting mammalian NAD biosynthesis, Pharmacol. Res 62 (2010) 42–47. [DOI] [PMC free article] [PubMed] [Google Scholar]
- [89].Gong B, Pan Y, Vempati P, Zhao W, Enable L, Ho L, Wang J, Sastre M, Ono K, Sauve AA, Pasinetti GM, Nicotinamide riboside restores cognition through an upregulation of proliferator-activated receptor-gamma coactivator 1alpha regulated beta-secretase 1 degradation and mitochondrial gene expression in Alzheimer’s mouse models, Neurobiol. Aging 34 (2013) 1581–1588. [DOI] [PMC free article] [PubMed] [Google Scholar]
- [90].Canto C, Houtkooper RH, Pirinen E, Youn DY, Oosterveer MH, Cen Y, Fernandez-Marcos PJ, Yamamoto H, Andreux PA, Cettour-Rose P, Gademann K, Rinsch C, Schoonjans K, Sauve AA, Auwerx J, The NAD(+) precursor nicotinamide riboside enhances oxidative metabolism and protects against high-fat diet-induced obesity, Cell Metab. 15 (2012) 838–847. [DOI] [PMC free article] [PubMed] [Google Scholar]
- [91].Trammell SA, Weidemann BJ, Chadda A, Yorek MS, Holmes A, Coppey LJ, Obrosov A, Kardon RH, Yorek MA, Brenner C, Nicotinamide riboside opposes type 2 diabetes and neuropathy in mice, Sci. Rep 6 (2016) 26933. [DOI] [PMC free article] [PubMed] [Google Scholar]
- [92].Long AN, Owens K, Schlappal AE, Kristian T, Fishman PS, Schuh RA, Effect of nicotinamide mononucleotide on brain mitochondrial respiratory deficits in an Alzheimer’s disease-relevant murine model, BMC Neurol. 15 (2015) 19. [DOI] [PMC free article] [PubMed] [Google Scholar]