Abstract
Background
The current methods adopted to screen for prostate cancer (PCa) can sometimes be misleading and inaccurate. Moreover, for advanced stages of PCa, the current effect of treatment is not satisfactory for some patients. Accordingly, we aimed to identify new biomarkers for the diagnosis and prognosis of PCa.
Methods
A series of bioinformatic tools were utilized to search for potential new biomarkers of PCa and analyze their functions, expression, clinical relevance, prognostic value, and underlying mechanisms.
Results
Although ASPN was overexpressed in PCa, EDN3, PENK, MEIS2, IGF1, and CXCL12 were downregulated. The univariate Cox regression analysis showed that abnormally high expression of ASPN and low expression of other genes predicted worse prognosis. Moreover, the multivariate Cox regression analysis showed that ASPN, PENK, and MEIS2 were independently associated with the overall survival (OS) of patients, whereas other markers were not. The outcomes of gene ontology and gene set enrichment analysis showed that the expression levels of these genes might be associated with cell proliferation and infiltration of immune cells in PCa.
Conclusions
We demonstrated that ASPN, EDN3, PENK, MEIS2, IGF1, and CXCL12 are possibly novel diagnostic indicators for PCa, whereas ASPN, PENK, and MEIS2 show appealing potential to predict the prognosis of this disease.
Keywords: Biomarkers, prostate cancer (PCa), bioinformatics, immune infiltration, prognosis
Introduction
Prostate cancer (PCa) is one of the most common cancers in the world, accounting for approximately 21% of all the tumors diagnosed in men (1). It was reported that 1.4 million new cases of PCa could be diagnosed worldwide. The main patients with PCa are over 65 years of age, whereas relatively fewer patients with PCa under 50 years of age are reported.
The most adoptable screening method for patients with PCa is the test for serum levels of prostate specific antigen (PSA). The serum levels of PSA are age-dependent and related to the size of the prostate. When the serum level of PSA exceeds 4 ng/mL, it is thought to be abnormal, and when it exceeds 10 ng/mL, the possibility of PCa should be highly considered (2). With the development of PSA screening, doctor diagnosis seems to be easier and more accurate. However, many researchers have found that PSA screening might lead to over-diagnosis and over-treatment owing to false positive results (3). Accordingly, whether the adoption of PSA screening only is suitable for the diagnosis of patients with PCa remains controversial. Therefore, it is imperative to find novel and dependable indicators of this disease.
Although early-stage PCa can usually be treated successfully and might not even be treated because of a lack of threat to the patient’s life, aggressive PCa with regional invasion and even distant metastasis can be much more dangerous. Unlike localized PCa, which is mainly treated with surgery, locally advanced and metastatic PCa is usually treated with radiation, hormonal therapy, and even immune therapy (4). These therapies are effective for some patients, whereas they could be invalid or have little effect on others. Hence, the treatment strategy for PCa, and especially localized advanced and metastatic disease, needs to be improved. Therefore, we conducted a series of bioinformatics analyses to find possible new diagnostic biomarkers and treatment targets for PCa based on the data obtained from some public databases such as the Gene Expression Omnibus (GEO), The Cancer Genome Atlas (TCGA), and Oncomine. Finally, we found that ASPN, EDN3, PENK, MEIS2, IGF1, and CXCL12 are possible diagnostic biomarkers for PCa. Moreover, we suggested that ASPN, PENK, and MEIS2 are independent indicators of patient prognosis. We present the following article/case in accordance with the MDAR reporting checklist (available at https://dx.doi.org/10.21037/tau-21-401).
Methods
Data collection and processing
The gene expression profiling datasets (GSE46602, including 15 normal samples and 15 PCa samples; GSE69223, consisting of 40 PCa samples and 10 normal samples) were downloaded from the GEO database (platform: GPL570 Affymetrix human genome U133 Plus 2.0 array). We also downloaded PCa-related data from TCGA dataset, which included 499 PCa samples and 52 normal samples. The Oncomine database was also used to analyze the correlated gene expression in PCa.
We used the Limma package to identify the differentially expressed genes (DEGs) (5). An adjusted P value <0.05 and |log (fold-change [FC]) | >1 was regarded as the cut-off criteria. Next, we drew Venn diagrams to identify the overlapping DEGs in the two gene expression microarrays. We also used the package ggplot2 to draw a volcano plot and show the screened DEGs from the two microarrays. The top 50 DEGs of GSE69223 were also shown through the heatmap. The study was conducted in accordance with the Declaration of Helsinki (as revised in 2013).
Gene ontology (GO) functional analysis and Kyoto Encyclopedia of Genes and Genomes (KEGG) pathway analysis
To find the possible biological meaning behind these DEGs, package cluster profiler was used for GO functional analysis and KEGG pathway analysis of overlapping DEGs (6). Furthermore, P<0.05 and q<0.05 were regarded as cut-offs.
Construction of protein-protein interaction (PPI) network and identification of hub genes
We constructed PPI networks of overlapping DEGs using The Search Tool for the retrieval of interacting Genes (STRING), which showed the interactions between proteins (http://string-db.org/). An interaction with a score >0.4 was considered statistically significant. Cytoscape software was used to visualize the PPI network and identify the top 20 genes with the highest degree of connectivity as the hub genes.
Survival analysis
To investigate the possible relationship between the expression level of these hub genes and the overall survival (OS) of patients with PCa, we carried out univariate Cox regression analysis with the Survival package using survival data from GSE16560, which consisted of 281 tumor samples. Moreover, the Cox regression model with multivariate analyses was used to judge whether a gene was an independent prognostic indicator for the survival of patients with PCa.
Association between expression levels of hub genes and clinical parameters in patients with PCa
Using the related clinical data comprising information about age, N stage, and M stage of patients, we explored the association between these hub genes and these clinical parameters in patients with PCa using the ggplot2 package.
Validation of expression levels using TCGA and Oncomine databases
TCGA constructed by the National Cancer Institute and National Human Genome Research Institute included sequencing and pathological data of 33 different types of tumors. Oncomine is a large tumor microarray database, covering 65 microarray datasets, 4,700 microarrays, and 480 million gene expression datapoints. We extracted mRNA expression data of paired and unpaired samples from these two databases to confirm the differential expression levels of these hub genes between tumor and normal samples.
Exploration of possible diagnostic value using receiver operating characteristic (ROC) curves
We adopted the pROC package and ggplot2 to estimate the possible diagnostic value of these hub genes using the ROC curves (7).
Co-expression analysis of genes
The online cBioPortal for Cancer Genomics (http//www.cbioportal.org/) integrates data from 126 tumor genome studies, including large-scale cancer research projects such as TCGA and ICGC. Gene Expression Profiling Interactive Analysis (GEPIA) functions as a web-based tool to provide differential expression analysis, correlation analysis, and survival analysis (http://www.gepia.cancer-pku.cn). We performed co-expression analysis of these genes by utilizing these two tools. P<0.05 was considered statistically significant.
Identification of genetic alterations through cBioPortal
We also used cBioPortal to find possible alterations in these genes in patients with PCa and explore the relationship between such alterations and prognosis.
Exploration of possible mechanism through gene set enrichment analysis (GSEA)
GSEA is a powerful tool to research a group of genes that might share a common biological function, chromosomal location, or regulatory mechanism. We here employed GSEA to reveal possible mechanisms underlying the development of PCa mediated by these genes. Genes with a nominal P<0.05 and FDR <0.25 were considered significantly enriched.
Possible association between hub genes and immune cell infiltration
The Tumor Immune Estimation Resource (TIMER) uses RNA-Seq expression profile data to provide a robust estimation of the infiltration of immune cells for tumor profiles with six state-of-the-art algorithms (http://timer.cistrome.org). We used TIMER to investigate the association between hub genes and immune cells in tumor tissues.
Statistical analysis
A Wilcoxon rank sum test was employed for unpaired tumor samples, which was used for paired tumor samples from TCGA. For the Oncomine database, we used a Student’s t test to contrast mRNA expression. The Cox hazard regression model was utilized to conduct univariate and multivariate analysis. The correlations for gene expression in GEPIA and cBioPortal were estimated by Spearman’s correlation. The association between gene expression and immune infiltration levels was also evaluated by Spearman’s correlation in TIMER. P<0.05 was considered statistically significant.
Results
Identification of DEGs in patients with PCa
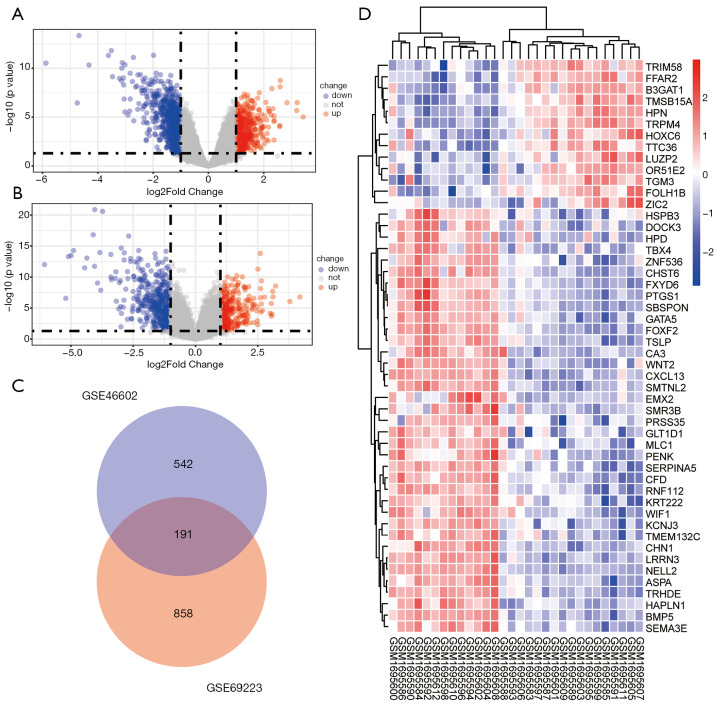
In the GSE69223 dataset, there were 15 normal tissues and 15 tumor tissues. According to the screening criteria of logFC ≥1 or logFC ≤−1 and an adjusted P value <0.05, 1,049 DEGs were identified using the Limma package. In the GSE46602 dataset, there were 10 normal tissues and 40 tumor tissues. According to the criteria, 733 DEGs were found. The DEGs of these two datasets are presented using a volcano plot (Figure 1A,B). Moreover, using the online website tool Draw Venn Diagram, we found 191 overlapping DEGs (Figure 1C). We also screened the top 50 differentially expressed genes in PCa from GSE69223 (Figure 1D).
Figure 1.
Identification of differentially expressed genes of GSE69223 and GSE46602. (A) The differentially expressed genes from GSE69223; (B) the differentially expressed genes from GSE46602; (C) overlapping differentially expressed genes from these two series; (D) top 50 differentially expressed genes from GSE69223.
GO and KEGG pathway analyses show a possible association with cell proliferation
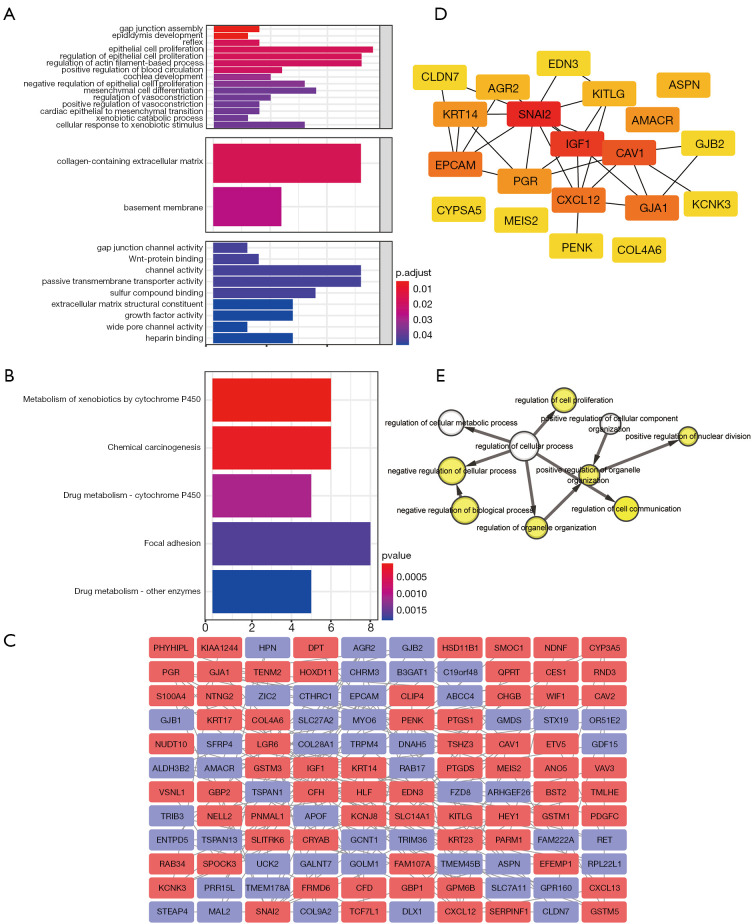
To further explore the possible mechanism associated with these overlapping DEGs in patients with PCa, GO functional and KEGG pathway analyses were conducted using the Clusterprofiler package. We found that in the cellular component category of GO analysis, the DEGs were mainly enriched in collagen-containing extracellular matrix and basement membrane. Regarding biological processes, the DEGs were mainly enriched in negative regulation of epithelial cell proliferation, mesenchymal cell differentiation, gap junction assembly, and endocytosis involved in viral entry in host cells. Regarding molecular function, the DEGs were mainly enriched in gap junction activity, Wnt-protein binding, and growth factor activity.
For the KEGG pathway analysis of overlapping DEGs, we found that these genes were mostly enriched in focal adhesion, metabolism of xenobiotics by cytochrome P450, and chemical carcinogenesis. Together, these analyses identified a possible role of these hub genes in monitoring cell proliferation in PCa. All results of GO and KEGG analyses are presented in Figure 2A and 2B.
Figure 2.
Gene Ontology Functional and Kyoto Encyclopedia of Gene and Genomes pathway analysis of differentially expressed genes. Identification of hub genes and biological process analysis of them. (A) Gene Ontology analysis; (B) Kyoto Encyclopedia of Gene and Genomes pathway analysis pathway analysis; (C) protein-protein interaction network of the differentially expressed genes; (D) Hub genes identified from the network; (E) biological processes related to the hub genes.
Construction of PPI network and identification of hub genes
To construct the PPI network, the overlapping DEGs of the two datasets were imported into the online website tool STRING. The network was then imported into the software Cytoscape (Figure 2C). After that, we identified the hub genes inside the network using this software. We regarded the top 20 genes with the highest degree of connectivity as hub genes with the CytoHubba app inside the Cytoscape software (Figure 2D). We then further performed biological process analysis of these hub genes. We found that the regulation of cell proliferation, positive regulation of nuclear division, negative regulation of cellular process, negative regulation of biological process, and regulation of organelle organization were mainly enriched (Figure 2E).
Survival analysis of hub genes
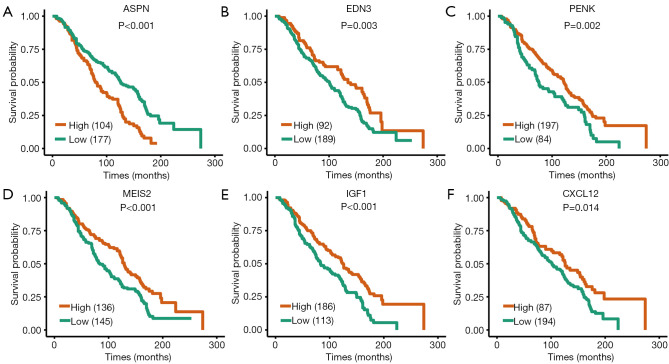
To explore the possible relationship between these genes and the prognosis of patients with PCa, survival analysis was conducted using the Survival and Survminer package. Results showed that patients with higher expression levels of ASPN had worse OS, whereas patients with lower expression levels of EDN3, PENK, MEIS2, IGF1, and CXCL12 had worse OS (Figure 3). The other hub genes were not associated with patient OS. Next, Cox regression with multivariate analysis was conducted to judge the prognostic value of these genes (Table 1). Univariate analysis results showed that ASPN (HR =1.89, P=0.0000118), EDN3 (HR =0.637, P=0.00351), PENK (HR =0.638, P=0.00225), MEIS2 (HR =0.624, P=0.000938), IGF1 (HR =0.597, P=0.000254), and CXCL12 (HR =0.677, P=0.0142) were correlated with the OS of patients. Regarding multivariate analysis, ASPN, PENK, and MEIS2 showed statistical significance, demonstrating that they could be independent prognostic biomarkers for the OS of patients with PCa.
Figure 3.
Survival analysis of hub genes. (A-F) The prognostic significance of these hub genes in patients with prostate cancer.
Table 1. Cox proportion hazard ratio analysis of the genes.
| Variable | Univariate analysis | Multivariate analysis | |||||
|---|---|---|---|---|---|---|---|
| HR1 | 95% CI | P value | HR | 95% CI | P value | ||
| ASPN | 1.89 | 1.42–2.51 | 1.18E-05 | 1.591 | 1.170–2.165 | 0.003101651 | |
| EDN3 | 0.637 | 0.471–0.862 | 0.00351 | 0.812 | 0.581–1.135 | 0.223905424 | |
| PENK | 0.638 | 0.478–0.851 | 0.00225 | 0.722 | 0.523–0.997 | 0.04820305 | |
| MEIS2 | 0.624 | 0.472–0.825 | 0.000938 | 0.636 | 0.467–0.867 | 0.00415153 | |
| IGF1 | 0.597 | 0.453–0.787 | 0.000254 | 1.214 | 0.894–1.648 | 0.213853147 | |
| CXCL12 | 0.677 | 0.496–0.925 | 0.0142 | 1.020 | 0.739–1.408 | 0.906392005 | |
| Age (year) | 1.55 | 1.17–2.04 | 0.0021 | 1.624 | 1.216–2.168 | 0.001022709 | |
| Gleason score | 2.86 | 2.04–4 | 1.11E-09 | 1.485 | 1.012–2.180 | 0.043257124 | |
| Tumor Invasion | 9.69 | 6.78–13.9 | 1.30E-35 | 9.159 | 6.239–13.444 | 1.20E-29 | |
| Gene fusion | 2.37 | 1.68–3.34 | 8.04E-07 | 1.190 | 0.825–1.716 | 0.352418055 | |
| Cancer percent | 2.04 | 1.54–2.69 | 5.45E-07 | 1.078 | 0.791–1.468 | 0.634931453 | |
HR1 estimated from Cox proportional hazard regression model. CI, confidence interval; HR, hazard ratio; mRNA, messenger RNA.
Association between expression levels of hub genes and clinical parameters in patients with PCa
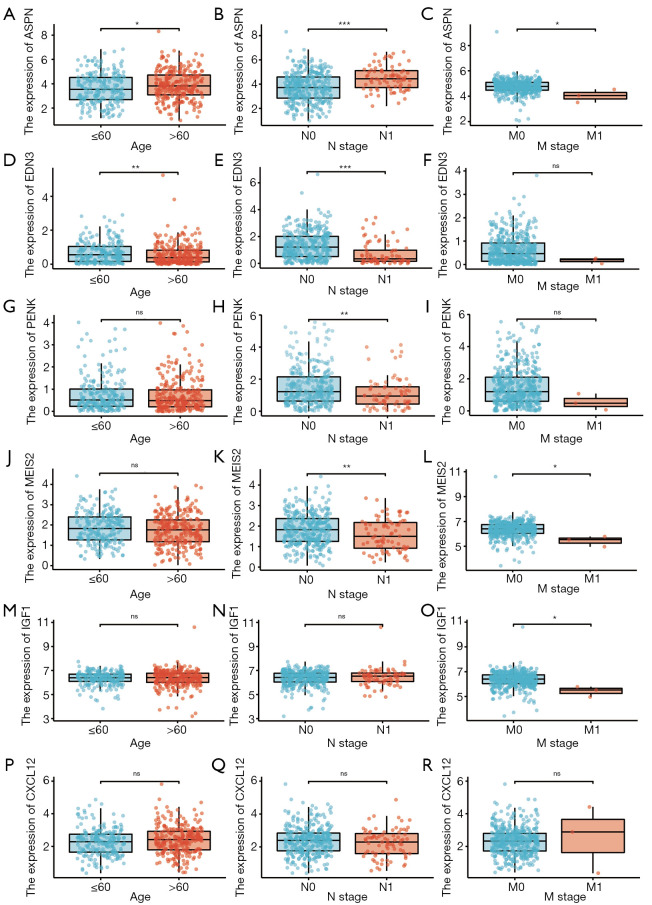
We explored the relationship between the expression of these genes and clinical parameters (Figure 4). Results showed that there was a significant difference in expression levels of ASPN between distinct groups based on age, N stage, and M stage, whereas the expression of EDN3 was not related to the M stage of PCa. The expression of PENK was closely associated with the N stage of PCa, and MEIS2 was related to both N and M stages of PCa. IGF1 was closely related to the M stage of PCa, but CXCL12 was not related to the investigated clinical parameters.
Figure 4.
Association between the expression of hub genes and clinical parameters in prostate cancer. (A-C) The expression levels of ASPN in various subgroups of patients with prostate cancer; (D-F) the expression levels of EDN3 in various subgroups of patients with prostate cancer; (G-I) the expression levels of PENK in various subgroups of patients with prostate cancer; (J-L) the expression levels of MEIS2 in various subgroups of patients with prostate cancer; (M-O) the expression levels of IGF1 in various subgroups of patients with prostate cancer; (P-R) the expression levels of CXCL12 in various subgroups of patients with prostate cancer. *, P<0.05; **, P<0.01; ***, P<0.001.
Validation of expression levels using TCGA and Oncomine databases
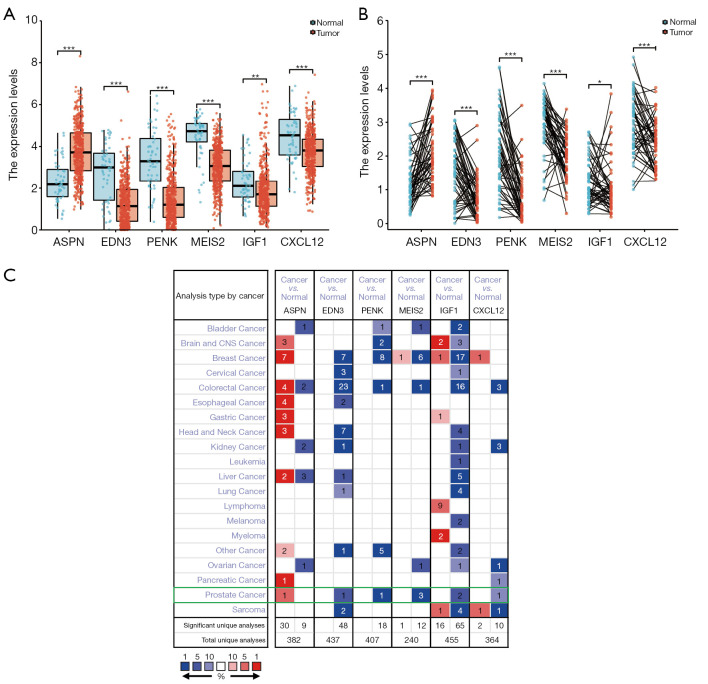
To confirm the expression levels of these survival-associated hub genes in patients with PCa, we extracted the related data from TCGA and Oncomine. The results from TCGA are presented in Figure 5A and 5B based on the ggplot2 package, and those from Oncomine are presented in Figure 5C, which were consistent with results based on GSE69233 and GSE46602. In both paired and unpaired tumor samples, it was observed that the expression of ASPN was higher than that in normal samples, whereas the other five hub genes showed opposite trends.
Figure 5.
The expression levels of hub genes based on TCGA and Oncomine databases. (A) The validation of hub genes in unpaired tumor tissues from TCGA database; (B) the confirmation of hub genes in paired tumor tissues from TCGA database; (C) the expression levels of hub genes in Oncomine database. *, P<0.05; **, P<0.01; ***, P<0.001.
Diagnostic value of the hub genes in patients with PCa
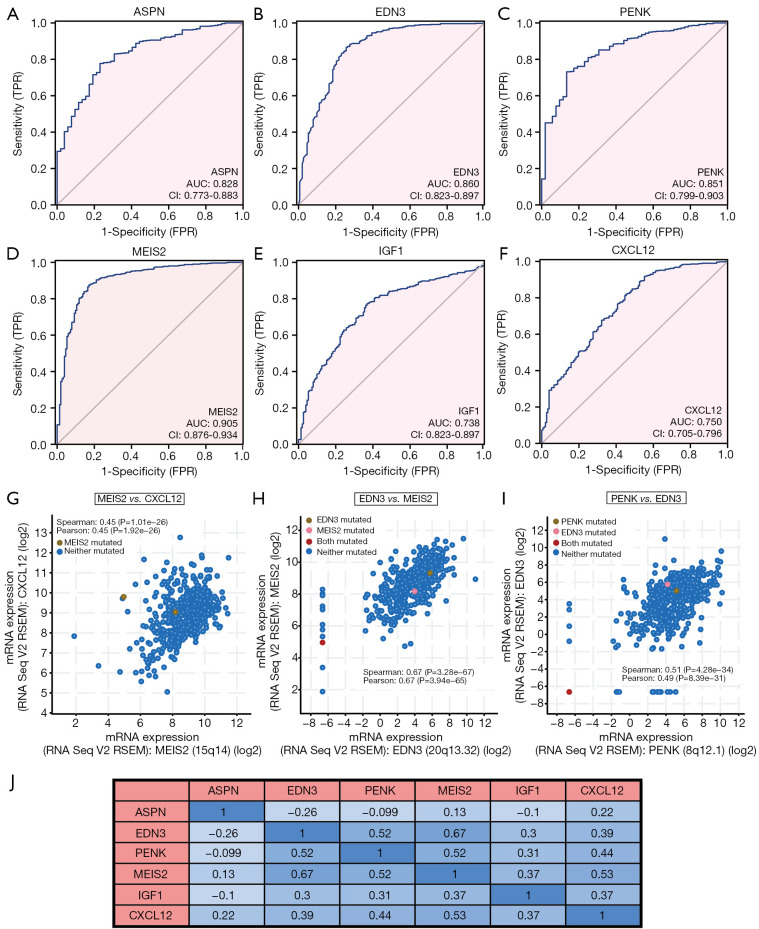
The ROC curves were generated to assess the diagnostic value of these hub genes in patients with PCa using the pROC package (Figure 6). The results showed that ASPN (AUC =0.828), EDN3 (AUC =0.86), PENK (AUC =0.851), MEIS2 (AUC =0.905), IGF1 (AUC =0.738), and CXCL12 (AUC =0.750) could distinguish PCa tissues from normal tissues. The results thus demonstrated that these genes are potential diagnostic indicators for patients with PCa.
Figure 6.
The diagnostic value of hub genes and co-expression analysis. (A-F) ROC curves of ASPN, EDN3, PENK, MEIS2, IGF1, and CXCL12; (G) co-expression analysis between MEIS2 and CXCL12; (H) co-expression analysis between EDN3 and MEIS2; (I) co-expression analysis between PENK and EDN3; (J) co-expression analysis between hub genes through GEPIA. AUC, area under curve; CI, confidence interval.
Co-expression analysis
We conducted co-expression analysis to search for the possible relationship among these six genes in PCa (Figure 6). One noticeable result was that the Spearman’s correlation coefficient for MEIS2 and CXCL12 was 0.53 with GEPIA, whereas it was 0.454 in the cBioPortal database (Figure 6G). We also found high correlation coefficients between EDN3 and MEIS2 (Spearman’s correlation =0.67). We validated this based on the cBioPortal database, which showed a Spearman’s correlation coefficient of 0.67 and a Pearson’s correlation coefficient of 0.67 (Figure 6H). There was an intermediate correlation between EDN3 and PENK through GEPIA (Spearman’s correlation =0.52), whereas this value was 0.508 in cBioPortal (Figure 6I). Regarding the association between PENK and MEIS2, there was also an intermediate correlation (Spearman’s correlation =0.52) in GEPIA, whereas this value was 0.497 in cBioPortal. Spearman’s correlation coefficient for PENK and CXCL12 was 0.44, which also indicated that there was an intermediate correlation between the two genes.
Identification of genetic alterations through cBioPortal
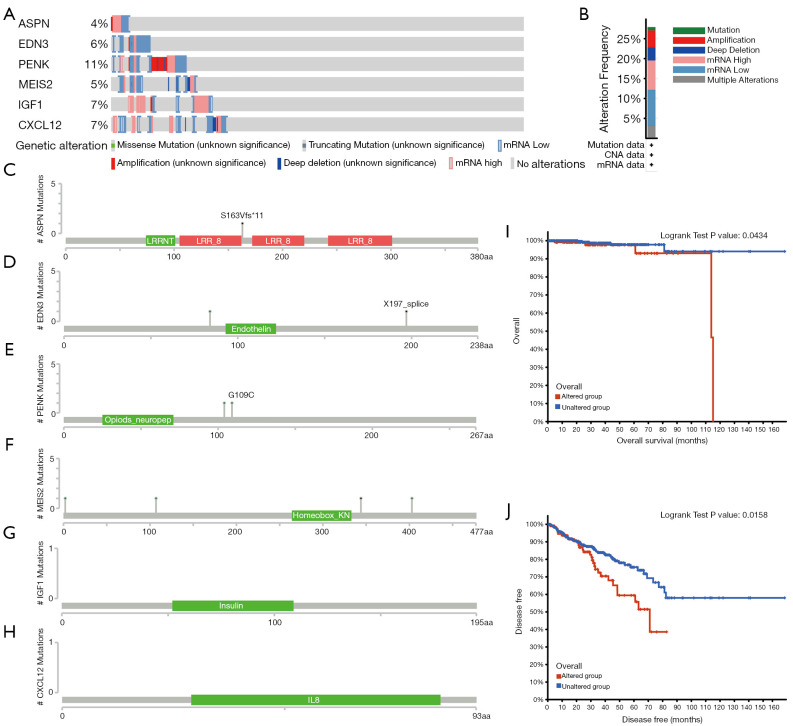
To analyze possible genetic alterations in the six hub genes and their associations with the prognosis of patients with PCa, we used the online website tool cBioPortal. Results showed that in the 499 patients with PCa, genetic alterations were found in 139 patients (28%), and ASPN, EDN3, PENK, MEIS2, IGF1, and CXCL12 were altered in 4%, 6%, 11%, 5%, 7%, and 7% of the queried PCa samples, respectively (Figure 7A). Moreover, frequencies of alterations are presented in Figure 7B. We also explored the mutation sites in these genes (Figure 7C-7H). The Kaplan-Meier plot also showed that genetic alterations in these genes were related to worse OS and disease specific survival (Figure 7I,7J).
Figure 7.
The alterations of hub genes in prostate cancer samples. (A) The alterations of ASPN, EDN3, PENK, MEIS2, IGF1, and CXCL12 in prostate cancer samples; (B) the alteration frequency in queried prostate cancer samples; (C-H) mutations of hub genes using cBioPortal; (I) genetic alterations of hub genes were associated with worse overall survival; (J) genetic alterations of hub genes were associated with worse disease-free survival (DFS).
GSEA shows the possible mechanism associated with the regulation of PCa development mediated by these genes
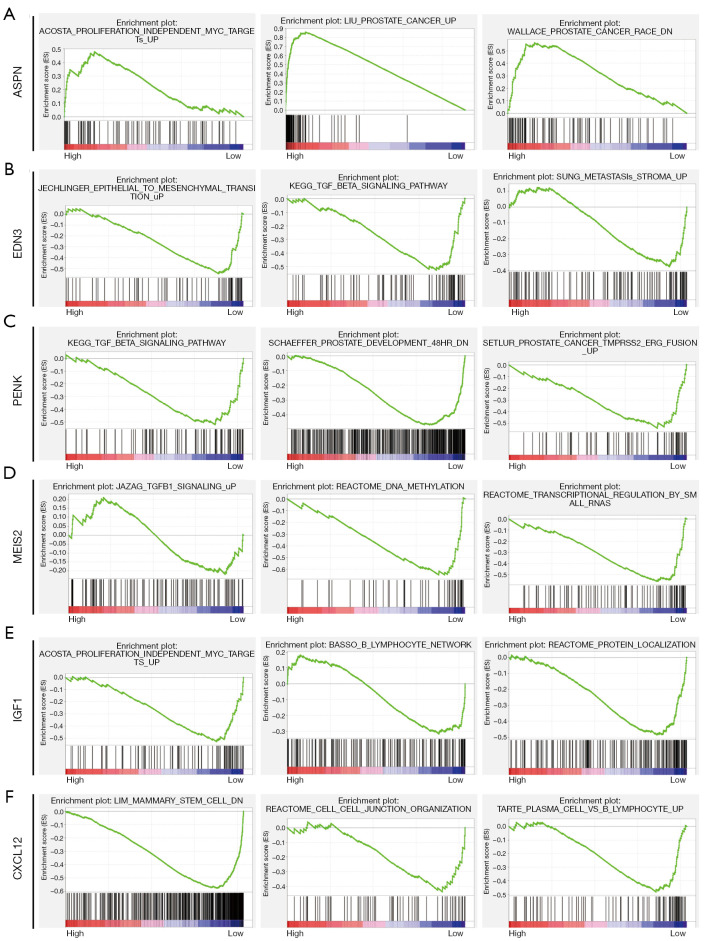
To further investigate the possible mechanism underlying the development of PCa, we conducted GSEA (Figure 8). Results showed that proliferation-independent MYC targets were enriched in the high-ASPN expression phenotype, whereas epithelial-mesenchymal transition (EMT) and transforming factor β (TGF-β) signaling pathways were enriched in the low-EDN3 expression phenotype. Moreover, the TGF-β signaling pathway was also enriched in the low-PENK expression phenotype, whereas TGF-B1 signaling was enriched in the low-MEIS2 expression phenotype. Whereas the B lymphocyte network was enriched in the low-IGF1 expression phenotype, plasma vs. B lymphocytes were enriched in the low-CXCL12 expression phenotype.
Figure 8.
Gene Set Enrichment Analysis contrasting high and low expression groups of hub genes: (A) ASPN; (B) EDN3; (C) PENK; (D) MEIS2; (E) IGF1; (F) CXCL12.
Association between immune cell infiltration and hub genes in patients with PCa
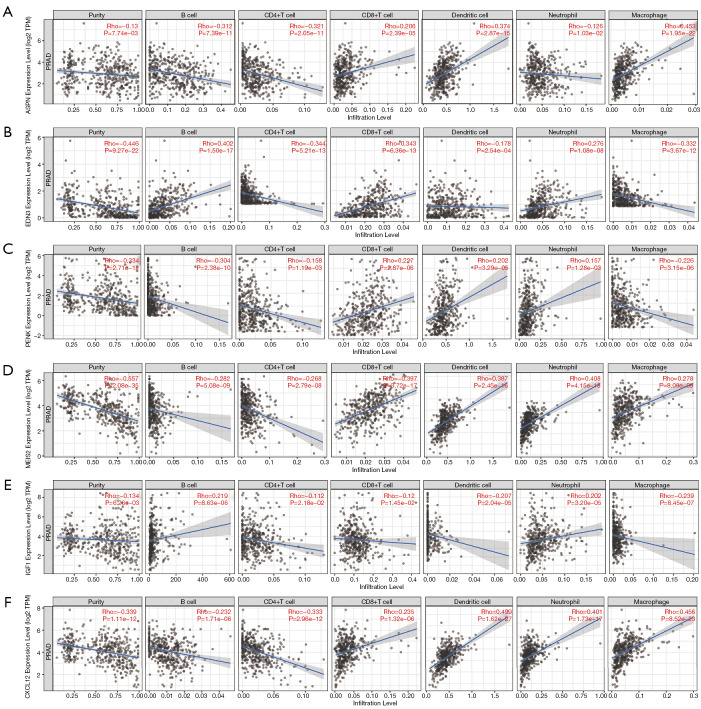
We next explored the relationship between the expression levels of these six hub genes and immune cell infiltration using the TIMER database (Figure 9). Results showed a positive association between the expression of ASPN and the infiltration CD8+ T cells, dendritic cells, and macrophages, whereas there was a negative association between the expression of ASPN and CD4+ T cells cells, B cells, and neutrophils. For EDN3, we found that it was positively related to CD8+ T cells (, B cells, and neutrophils, whereas it was negatively associated with CD4+ T cells, dendritic cells, and macrophages. PENK showed a positive relationship with CD8+ T cells, neutrophils (Rho =0.157, P=1.28e-03), and dendritic cells, whereas there was a negative relationship with B cells, CD4+ T cells, and macrophages. We also found a positive association between the expression of MEIS2 and CD8+ T cells (Rho =0.397, P=3.72e-17), dendritic cells, macrophages and neutrophils and a negative association with CD4+ T cells and B cells. There was an active connection between the expression of IGF1 and neutrophils and B cells, whereas there was a negative association with CD8+ T cells, CD4+ T cells, macrophages, and dendritic cells. CXCL12 was positively correlated with CD8+ T cells, dendritic cells, macrophages (Rho =0.456, P=8.52e-23), and neutrophils but negatively associated with CD4+ T cells and B cells.
Figure 9.
The correlation between (A) ASPN, (B) EDN3, (C) PENK, (D) MEIS2, (E) IGF1, or (F) CXCL12 and infiltration of immune cells.
Discussion
PCa is a common malignancy of men, and its incidence continues to increase in some countries (8). Therefore, an accurate and effective method for diagnosis and prognosis is essential. Although PSA has been widely used for the screening of PCa, it is controversial owing to over-diagnosis and over-treatment. As a result, we conducted bioinformatic analysis to search for possible new diagnostic and prognostic biomarkers for PCa in this study, which might be helpful for the accurate diagnosis and survival analysis of patients with PCa.
ASPN is upregulated in PCa compared to its levels in normal prostate tissues (9), which is consistent with our results. Functional analysis showed that ASPN was associated with collagen-containing extracellular matrix and extracellular matrix structural constituents. ASPN could promote cell proliferation in colorectal cancer (CRC) through TGF-β signaling, which is crucial for the EMT process in CRC (10). TGF-β signaling is closely associated with immunity, and particularly with CD4+ T cells, CD8+ T cells, natural killer cells, dendritic cells, and neutrophils (11). Next, we analyzed the relationship between the expression of ASPN and immune cell infiltration, and the result showed that its expression was significantly correlated with infiltration levels of several immune cells in PCa.
The possible role of EDN3 in PCa has not been reported to date. Our study first showed that EDN3 could be a possible biomarker for the diagnosis of PCa and that it is associated with the survival of patients with PCa. The protein encoded by this gene is a member of the endothelin family (12). Mutations in this gene are associated with Hirschsprung disease (13). EDN3 promotes melanoma cell survival through endothelin signaling (14,15). Functional analysis showed that EDN3 was associated with the positive regulation of blood circulation, negative regulation of epithelial proliferation, and regulation of cell proliferation. The expression of EDN3 is associated with cell proliferation in breast cancer and in some neural crest cells (16,17). Based on GSEA results, the EDN3-low expression phenotype was associated with TGF-β signaling and EMT. Then, through co-expression analysis, we found a moderate association between the expression of EDN3 and PENK in PCa, markers that were reported to have a possible cooperative relationship during the metastasis of breast cancer (18). Our study showed that EDN3 is downregulated in PCa and has the potential to be used as a diagnostic biomarker.
PENK, a negative regulator of cell proliferation and tissue organization, was downregulated in PCa in our study, which is consistent with results of a previous study (19). Moreover, the functional analysis showed that this gene is associated with response to xenobiotic stimulus and the regulation of cell proliferation. The results of GSEA also showed that the PENK-low expression phenotype was associated with TGF-β signaling in PCa. We also found a significant relationship between the expression of PENK and immune cell infiltration levels.
As a protein-coding gene, MEIS2 is associated with a series of diseases, including cardiac defects, mental retardation, and neuroblastoma (20-22). In neuroblastoma, MEIS2 is responsible for proliferation, and the depletion of MEIS2 causes M phase arrest and mitotic catastrophe (22). Moreover, in lung cancer MEIS2 promotes progression through TGF-β signaling (23). In addition, previous trials have shown that low transcriptional expression of MEIS2 is associated with poor biochemical recurrence-free survival for PCa, whereas our study showed that low transcriptional expression of MEIS2 is indicative of relatively shorter OS (24). MEIS2 transcriptional levels decrease gradually from benign prostate to PCa and to metastatic PCa tissue, which might suggest that MEIS2 is a tumor suppressor gene in PCa (25). Our functional analysis showed that MEIS2 is associated with eye development, positive regulation of cell cycle, and myoblast proliferation. We found a strong association between the expression of EDN3 and MEIS2 in PCa, which might indicate the cooperation of these two genes in the progression of PCa.
IGF1, encoding a protein that is similar to insulin in function and structure, could be a physiological regulator of glycogen synthesis (26). It was reported to be related to Laron syndrome, acromegaly, and breast cancer (27-29). IGF1 induces breast cancer cell proliferation via IGF1R. Our functional analysis showed that IGF1 is associated with epithelial cell proliferation and growth factor activity. It could thus be a possible diagnostic biomarker for PCa.
CXCL12 is associated with many cellular functions, such as immune surveillance, inflammation responses, tumor growth, and metastasis (30). Our functional analysis showed that it is associated with the regulation of epithelial cell proliferation and actin filament-based processes. It was previously found to induce the invasion and proliferation of ovarian cancer cells through the CXCR4 ligand (31). Our study found that CXCL12 is downregulated in PCa tissue samples and has diagnostic value for PCa.
We also found expression levels of these genes were associated with a series of clinical parameters (Figures S1-S3). Some of these parameters such as tumor stage, gleason scores and the serum levels of PSA are used as indicators of D’Amico classification system. All this information indicates the significance of these genes.
Conclusions
In conclusion, our study revealed six potential biomarkers, consisting of ASPN, EDN3, PENK, MEIS2, IGF1, and CXCL12, for PCa. All of them can be potential diagnostic indicators for this disease. Among them, ASPN, PENK, and MEIS2 show appealing potential to predict prognosis for patients with PCa. ASPN, EDN3, PENK, MEIS2, and IGF1 also showed close associations with clinical parameters. Moreover, we explored the relationship between EDN3 and PCa for the first time.
Supplementary
The article’s supplementary files as
Acknowledgments
We thank Editage for English language editing.
Funding: None.
Ethical Statement: The authors are accountable for all aspects of the work in ensuring that questions related to the accuracy or integrity of any part of the work are appropriately investigated and resolved. The study was conducted in accordance with the Declaration of Helsinki (as revised in 2013).
Footnotes
Reporting Checklist: The authors have completed the MDAR reporting checklist. Available at https://dx.doi.org/10.21037/tau-21-401
Conflicts of Interest: All authors have completed the ICMJE uniform disclosure form (available at https://dx.doi.org/10.21037/tau-21-401). The authors have no conflicts of interest to declare.
References
- 1.Litwin MS, Tan HJ. The Diagnosis and Treatment of Prostate Cancer: A Review. JAMA 2017;317:2532-42. 10.1001/jama.2017.7248 [DOI] [PubMed] [Google Scholar]
- 2.Parsons JK, Zahrieh D, Mohler JL, et al. Effect of a Behavioral Intervention to Increase Vegetable Consumption on Cancer Progression Among Men With Early-Stage Prostate Cancer: The MEAL Randomized Clinical Trial. JAMA 2020;323:140-8. 10.1001/jama.2019.20207 [DOI] [PMC free article] [PubMed] [Google Scholar]
- 3.Callender T, Emberton M, Morris S, et al. Polygenic risk-tailored screening for prostate cancer: A benefit-harm and cost-effectiveness modelling study. PLoS Med 2019;16:e1002998. 10.1371/journal.pmed.1002998 [DOI] [PMC free article] [PubMed] [Google Scholar]
- 4.Rishi D, Travis C. Association between African American race and clinical outcomes in men treated for low-risk prostate cancer with active surveillance. JAMA 2020;324:1747-54. 10.1001/jama.2020.17020 [DOI] [PMC free article] [PubMed] [Google Scholar]
- 5.Ritchie ME, Phipson B, Wu D, et al. limma powers differential expression analyses for RNA-sequencing and microarray studies. Nucleic Acids Res 2015;43:e47. 10.1093/nar/gkv007 [DOI] [PMC free article] [PubMed] [Google Scholar]
- 6.Yu G, Wang LG, Han Y, et al. clusterProfiler: an R package for comparing biological themes among gene clusters. OMICS 2012;16:284-7. 10.1089/omi.2011.0118 [DOI] [PMC free article] [PubMed] [Google Scholar]
- 7.Robin X, Turck N, Hainard A, et al. pROC: an open-source package for R and S+ to analyze and compare ROC curves. BMC Bioinformatics 2011;12:77. 10.1186/1471-2105-12-77 [DOI] [PMC free article] [PubMed] [Google Scholar]
- 8.Helgstrand JT, Røder MA, Klemann N, et al. Trends in incidence and 5-year mortality in men with newly diagnosed, metastatic prostate cancer-A population-based analysis of 2 national cohorts. Cancer 2018;124:2931-8. 10.1002/cncr.31384 [DOI] [PubMed] [Google Scholar]
- 9.Rochette A, Boufaied N, Scarlata E, et al. Asporin is a stromally expressed marker associated with prostate cancer progression. Br J Cancer 2017;116:775-84. 10.1038/bjc.2017.15 [DOI] [PMC free article] [PubMed] [Google Scholar]
- 10.Li H, Zhang Z, Chen L, et al. Cytoplasmic Asporin promotes cell migration by regulating TGF-β/Smad2/3 pathway and indicates a poor prognosis in colorectal cancer. Cell Death Dis 2019;10:109. 10.1038/s41419-019-1376-9 [DOI] [PMC free article] [PubMed] [Google Scholar]
- 11.Batlle E, Massagué J. Transforming Growth Factor-β Signaling in Immunity and Cancer. Immunity 2019;50:924-40. 10.1016/j.immuni.2019.03.024 [DOI] [PMC free article] [PubMed] [Google Scholar]
- 12.Naz S, Friedman TB. Growth factor and receptor malfunctions associated with human genetic deafness. Clin Genet 2020;97:138-55. 10.1111/cge.13641 [DOI] [PMC free article] [PubMed] [Google Scholar]
- 13.Gath R, Goessling A, Keller KM, et al. Analysis of the RET, GDNF, EDN3, and EDNRB genes in patients with intestinal neuronal dysplasia and Hirschsprung disease. Gut 2001;48:671-5. 10.1136/gut.48.5.671 [DOI] [PMC free article] [PubMed] [Google Scholar]
- 14.Saldana-Caboverde A, Kos L. Roles of endothelin signaling in melanocyte development and melanoma. Pigment Cell Melanoma Res 2010;23:160-70. 10.1111/j.1755-148X.2010.00678.x [DOI] [PMC free article] [PubMed] [Google Scholar]
- 15.Kim IS, Heilmann S, Kansler ER, et al. Microenvironment-derived factors driving metastatic plasticity in melanoma. Nat Commun 2017;8:14343. 10.1038/ncomms14343 [DOI] [PMC free article] [PubMed] [Google Scholar]
- 16.Wiesmann F, Veeck J, Galm O, et al. Frequent loss of endothelin-3 (EDN3) expression due to epigenetic inactivation in human breast cancer. Breast Cancer Res 2009;11:R34. 10.1186/bcr2319 [DOI] [PMC free article] [PubMed] [Google Scholar]
- 17.Lahav R, Ziller C, Dupin E, et al. Endothelin 3 promotes neural crest cell proliferation and mediates a vast increase in melanocyte number in culture. Proc Natl Acad Sci U S A 1996;93:3892-7. 10.1073/pnas.93.9.3892 [DOI] [PMC free article] [PubMed] [Google Scholar]
- 18.Salhia B, Kiefer J, Ross JT, et al. Integrated genomic and epigenomic analysis of breast cancer brain metastasis. PLoS One 2014;9:e85448. 10.1371/journal.pone.0085448 [DOI] [PMC free article] [PubMed] [Google Scholar]
- 19.Ashour N, Angulo JC, Andrés G, et al. A DNA hypermethylation profile reveals new potential biomarkers for prostate cancer diagnosis and prognosis. Prostate 2014;74:1171-82. 10.1002/pros.22833 [DOI] [PubMed] [Google Scholar]
- 20.Louw JJ, Corveleyn A, Jia Y, et al. MEIS2 involvement in cardiac development, cleft palate, and intellectual disability. Am J Med Genet A 2015;167A:1142-6. 10.1002/ajmg.a.36989 [DOI] [PubMed] [Google Scholar]
- 21.Fujita A, Isidor B, Piloquet H, et al. De novo MEIS2 mutation causes syndromic developmental delay with persistent gastro-esophageal reflux. J Hum Genet 2016;61:835-8. 10.1038/jhg.2016.54 [DOI] [PubMed] [Google Scholar]
- 22.Zha Y, Xia Y, Ding J, et al. MEIS2 is essential for neuroblastoma cell survival and proliferation by transcriptional control of M-phase progression. Cell Death Dis 2014;5:e1417. 10.1038/cddis.2014.370 [DOI] [PMC free article] [PubMed] [Google Scholar]
- 23.Halder SK, Cho YJ, Datta A, et al. Elucidating the mechanism of regulation of transforming growth factor β Type II receptor expression in human lung cancer cell lines. Neoplasia 2011;13:912-22. 10.1593/neo.11576 [DOI] [PMC free article] [PubMed] [Google Scholar]
- 24.Nørgaard M, Haldrup C, Bjerre MT, et al. Epigenetic silencing of MEIS2 in prostate cancer recurrence. Clin Epigenetics 2019;11:147. 10.1186/s13148-019-0742-x [DOI] [PMC free article] [PubMed] [Google Scholar]
- 25.Bhanvadia RR, VanOpstall C, Brechka H, et al. MEIS1 and MEIS2 Expression and Prostate Cancer Progression: A Role For HOXB13 Binding Partners in Metastatic Disease. Clin Cancer Res 2018;24:3668-80. 10.1158/1078-0432.CCR-17-3673 [DOI] [PMC free article] [PubMed] [Google Scholar]
- 26.Ge D, Dauchy RT, Liu S, et al. Insulin and IGF1 enhance IL-17-induced chemokine expression through a GSK3B-dependent mechanism: a new target for melatonin's anti-inflammatory action. J Pineal Res 2013;55:377-87. 10.1111/jpi.12084 [DOI] [PMC free article] [PubMed] [Google Scholar]
- 27.Nagaraj K, Lapkina-Gendler L, Sarfstein R, et al. Identification of thioredoxin-interacting protein (TXNIP) as a downstream target for IGF1 action. Proc Natl Acad Sci U S A 2018;115:1045-50. 10.1073/pnas.1715930115 [DOI] [PMC free article] [PubMed] [Google Scholar]
- 28.Mullan K, Sanabria C, Abram WP, et al. Long term effect of external pituitary irradiation on IGF1 levels in patients with acromegaly free of adjunctive treatment. Eur J Endocrinol 2009;161:547-51. 10.1530/EJE-09-0506 [DOI] [PubMed] [Google Scholar]
- 29.De Santi M, Annibalini G, Barbieri E, et al. Human IGF1 pro-forms induce breast cancer cell proliferation via the IGF1 receptor. Cell Oncol (Dordr) 2016;39:149-59. 10.1007/s13402-015-0263-3 [DOI] [PubMed] [Google Scholar]
- 30.Shim H, Oishi S, Fujii N. Chemokine receptor CXCR4 as a therapeutic target for neuroectodermal tumors. Semin Cancer Biol 2009;19:123-34. 10.1016/j.semcancer.2008.11.004 [DOI] [PMC free article] [PubMed] [Google Scholar]
- 31.Zheng N, Chen J, Li T, et al. Abortifacient metapristone (RU486 derivative) interrupts CXCL12/CXCR4 axis for ovarian metastatic chemoprevention. Mol Carcinog 2017;56:1896-908. 10.1002/mc.22645 [DOI] [PubMed] [Google Scholar]
Associated Data
This section collects any data citations, data availability statements, or supplementary materials included in this article.
Supplementary Materials
The article’s supplementary files as


