Abstract
Backgrounds
Globally, the high morbidity and mortality of gastric carcinoma (GC) have been one of the great challenges facing humanity. However, the early diagnosis of GC is still unknown. Matrilin-3 (MATN3) is a member of the extracellular matrix (ECM) protein family. Previous studies have reported a correlation between the expression of MATN3 and bone disease. However, the role of MATN3 in GC has not been reported in depth, which can have a possible far-reaching implication for GC.
Methods
We explored the diagnostic and prognostic value and pathway enrichment of MATN3 expression in GC. Limma package conducted by R was used to analysis the difference expression data of MATN3 from The Cancer Genome Atlas (TCGA). The receiver operating characteristic (ROC) curve analysis was used to estimate the diagnostic value of MATN3 expression. univariate and multivariate analysis were used to assess the prognostic value of MATN3, and gene set enrichment analysis (GSEA) to identify the enriched signaling pathways.
Results
MATN3 was found to be significantly higher in GC tissue samples. GC patients with high MATN3 expression had poor prognosis. Then, GSEA showed that the gene sets were correlated with signaling pathways including ECM receptor interaction, hypertrophic cardiomyopathy (HCM), and glycosaminoglycan biosynthesis chondroitin sulfate, among others.
Conclusions
The study suggests that MATN3 can serve as a potential diagnostic and prognostic biomarker for GC.
Keywords: Diagnosis, prognostic, matrilin-3 (MATN3), gastric carcinoma (GC)
Introduction
GC is one of the five most common cancers both in developed and developing regions and the 3rd leading cause of cancer death (1). In 2020, the number of new cases in GC was 27,600 and 11,010 estimated deaths, and the five-year survival rate was only 32% (2010–2016) (2). In developed countries, GC remains one of the leading causes of mortality cancers in the matures (3). Additionally, GC is one of the most common cancers, with morbidity and mortality rates corresponding to age in China. (4). Currently, early surgical resection results in a five-year survival rate of 85–95% in GC patients with stage I. Therefore, surgery remains the preferred treatment for GC (5). However, the feasibility of colonoscopy and serology-based prophylactic screening and the lack of obvious early manifestations restrict the early diagnosis of GC (6,7), which aggravates the proportion of GC prognosis. Consequently, early and precise diagnosis using GC biomarkers can help to the improvement of the prognosis of these patients.
The matrilin (MATN) family has 4 members. MATN3 is expressed mainly in cartilage (8) and is a new member of the extracellular matrix (ECM) protein family which have relation to the cartilage matrix protein and von Willebrand factor (9). Previous studies have reported that MATN3 was found in matrix formed by cultured chondrosarcoma cells and is involved in the development of cartilage and bone (10). Mutations in MATN3 have been associated with common skeletal diseases and rare chondrodysplasias (11). At present, MATN3 expression has rarely been reported in cancer patients and remains largely unclear. Therefore, the identification of reliable biomarkers is essential for the diagnosis and prognosis of GC.
The aim of this study was to assess the diagnostic and prognostic value of MATN3 expression in human GC based on data from the Cancer Genome Atlas (TCGA). Gene set enrichment analysis (GSEA) was used to further analyze the biological pathways of the MATN3 regulatory network associated with GC pathogenesis. We present the following article in accordance with the REMARK reporting checklist (available at https://dx.doi.org/10.21037/jgo-21-267).
Methods
RNA-sequencing data collection
The gene-sequenced expressed data included 407 cases and 32 normal samples, and the corresponding information of clinical data was downloaded from the TCGA Genome Data Commons (GDC) data portal (https://portal.gdc.cancer.gov/repository). The final RNA-Seq gene-expression data and clinical information data of 375 patients were retained and further analyzed (Table 1). The study was conducted in accordance with the Declaration of Helsinki (as revised in 2013).
Table 1. TCGA gastric cancer patient characteristics.
| Clinical characteristics | Total (375) | % |
|---|---|---|
| Age at diagnosis (y) | ||
| <49 | 26 | 7.01 |
| 50–59 | 86 | 23.18 |
| 60–69 | 109 | 29.38 |
| 70–79 | 121 | 32.61 |
| >80 | 29 | 7.82 |
| Stage classification | ||
| I | 53 | 15.06 |
| II | 111 | 31.53 |
| III | 150 | 42.61 |
| IV | 38 | 10.80 |
| Tumor (T) classification | ||
| T1 | 19 | 5.18 |
| T2 | 80 | 21.80 |
| T3 | 168 | 45.78 |
| T4 | 100 | 27.25 |
| Node (N) classification | ||
| N0 | 111 | 31.09 |
| N1 | 97 | 27.17 |
| N2 | 75 | 21.01 |
| N3 | 74 | 20.73 |
| Metastasis (M) classification | ||
| M0 | 330 | 92.96 |
| M1 | 25 | 7.04 |
| Grade (G) classification | ||
| G1 | 10 | 3.76 |
| G2 | 137 | 51.50 |
| G3 | 119 | 44.74 |
| Gender | ||
| Male | 241 | 64.27 |
| Female | 134 | 35.73 |
TCGA, The Cancer Genome Atlas.
GSEA
GSEA is a calculation method for determining whether an a priori definition of a set of the genes is a statistically significant and consistently different between two biological states and is designed to detect expression changes in a modest but functionally coordinated set of genes (12,13). Here, Gene expression datasets and phenotypic marker files were then generated and uploaded to GSEA the computer software. GSEA analyses were used to show the significant survival differences between the high- and low-MATN3 groups of TCGA patients. Gene alignments were performed 1,000 times for each group. Enriched pathways in each phenotype were identified by setting the nominal P value (NOM P val) <0.05 and the false discovery rate q-value (FDR q-val) <0.05.
Statistical analysis
All statistical analyzes were carried out using R (v.3.6.3). Wilcoxon signed rank test and logistic regression were used to assess the relationship between clinicopathological characteristics. Cox regression and Kaplan-Meier methods were used to analyze clinicopathological characteristics associated with overall survival (OS) in patients with TCGA. Subject work characteristic (ROC) curve analysis was performed using Wilson’s method and percentage outcomes in conjunction with the survival ROC package. The relationship between MATN3 expression and clinicopathological characteristics was analyzed using univariate logistic regression. The effect of MATN3 expression on survival was compared with other clinical characteristics (e.g., age, distant metastatic status, grading, lymph node status, staging) using univariate and multifactorial Cox analysis. The median was established as the MATN3 expression cutoff value, and patients were divided to two groups.
Results
Patient characteristics
Gene expression data for 407 patients were obtained by downloading from the TCGA website in May 2020. clinical data for 375 tumor patients was shown in Table 1. The age group of 70–79 accounted for the largest proportion (32.61%), followed by the 60–69 age group (29.38%), 50–59 age group (23.18%), >80 age group (7.82%), and <49 age group (7.01%). There were 19 cases (5.18%) in group T1, 80 cases (21.80%) in group T2, 168 cases (45.78%) in group T3 and 100 cases (27.17%) in group T4. N0 type tumors were the majority (31.09%, N=111), N1 type 27.17% [97], N2 type 21.73% [75] and N3 type 20.73% [74]. G1 GC cases accounted for 3.76% [10], G2 for 51.50% [137], and G3 for 44.74% [119]. Out of the 375 cases, 25 (7.04%) cases had distant metastasis. Two hundred and forty-one (64.27%) males and 134 females (35.73%) were composited for the gender composition.
MATN3 expression and its diagnostic value
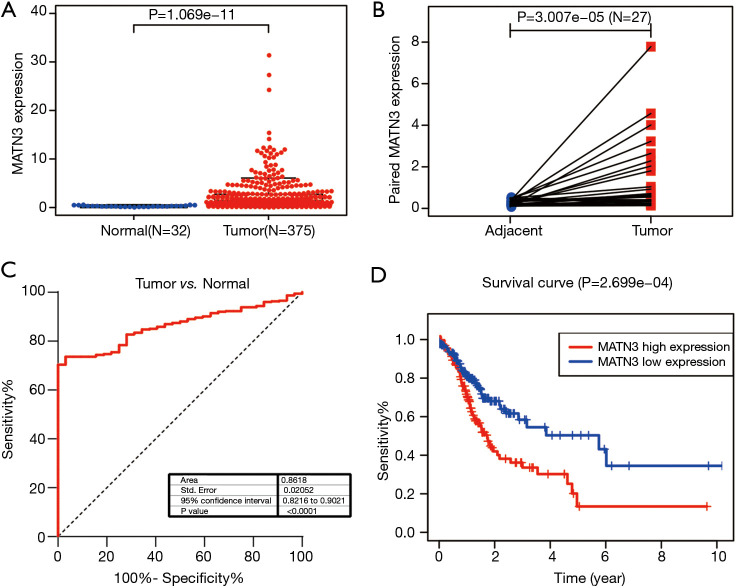
We analyzed the MATN3 expression data from 407 samples. As Figure 1A shows, the expression of MATN3 levels were significantly correlated with tumor type (P=1.069e-11). There were also significant differences in the expression of MATN3 in tumor versus paraneoplastic tissues for 27 paired composition (Figure 1B). To assess the diagnostic efficacy of MATN3, we performed ROC curve analysis on the expression data from tumor and normal samples. The area under the ROC curve was 0.8618 [95% confidence interval (CI): 0.8216–0.9021] (Figure 1C). According to Kaplan-Meier survival analysis, those with high MATN3 expression had a poorer prognosis in 375 patients (Figure 1D, P=2.699e-04).
Figure 1.
MATN3 expression level and its role in GC. (A) In the TCGA cohort, tumor patients had higher than normal levels of MATN3 expression. (B) MATN3 expression level was higher in tumor tissues than in paracancerous tissues. (C) ROC curves of MATN3 expression in normal gastric and tumor tissues. (D) Expression of MATN3 in the TCGA cohort and overall survival of gastric cancer patients. MATN3, matrilin-3; GC, gastric carcinoma; TCGA, The Cancer Genome Atlas; ROC, receiver operating characteristic.
MATN3 expression and clinicopathological parameters
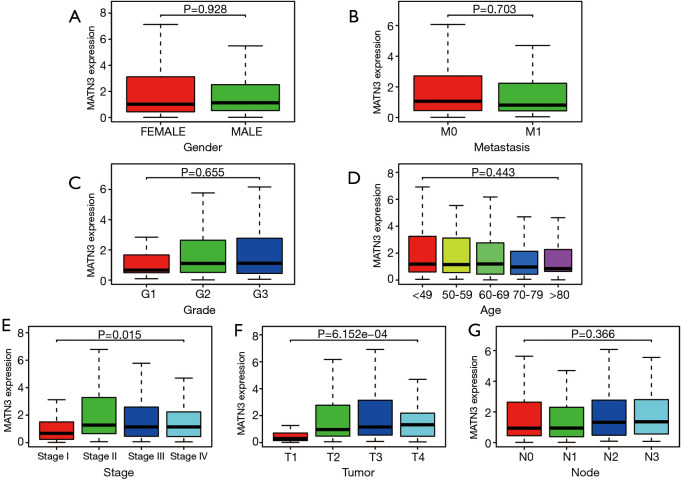
Then, we analyzed the clinicopathological data of 375 GC patients from TCGA, including clinical stage (stage), age at diagnosis (age), gender, histological grade, survival status, and survival time, as well as tumor, node, and metastasis (TNM) classification. As shown in Figure 2A-G), increased MATN3 expression was found to be significantly related to staging (P=0.015) and to T staging (P=6.152e-4).
Figure 2.
Association between MATN3 expression and clinicopathological characteristics, (A) gender, (B) distant metastases, (C) clinical grade, (D) age, (E) clinical stage, (F) tumor stage, (G) lymph node metastasis. MATN3, matrilin-3.
MATN3 expression was characterized as a classified dependent variable with poor prognosis of clinicopathology, confirmed by univariate logistic regression (Table 2). Increasing GC MATN3 expression was significantly associated with higher stage classification [ratio (OR) =2.679 II vs. I, OR =2.233 III vs. I, IV vs. I OR =2.353] and T type (T2 vs. T1 OR =4.363, T3 vs. T1 OR =6.154, T4 vs. T1 OR =6.261).
Table 2. Logistic regression of MATN3 expression# and clinical pathological characteristics.
| Clinical characteristics | Total (N) | OR | 95% CI | P value |
|---|---|---|---|---|
| Age at diagnosis (y) | ||||
| 50–59 vs. <49 | 112 | 0.941 | 0.386–2.269 | 0.892 |
| 60–69 vs. <49 | 135 | 0.906 | 0.379–2.137 | 0.821 |
| 70–79 vs. <49 | 147 | 0.789 | 0.333–1.847 | 0.585 |
| >80 vs. <49 | 55 | 0.605 | 0.204–1.751 | 0.356 |
| Stage classification | ||||
| II vs. I | 164 | 2.679 | 1.363–5.426 | 0.005* |
| III vs. I | 203 | 2.233 | 1.169–4.402 | 0.017* |
| IV vs. I | 91 | 2.353 | 1.004–5.634 | 0.017* |
| Tumor (T) classification | ||||
| T2 vs. T1 | 99 | 4.363 | 1.325–19.820 | 0.027* |
| T3 vs. T1 | 186 | 6.154 | 1.960–27.163 | 0.005* |
| T4 vs. T1 | 117 | 6.261 | 1.937–28.133 | 0.005* |
| Node (N) classification | ||||
| N1 vs. N0 | 207 | 0.982 | 0.568–1.696 | 0.948 |
| N2 vs. N0 | 185 | 1.297 | 0.721–2.340 | 0.386 |
| N3 vs. N0 | 184 | 1.41 | 0.782–2.556 | 0.255 |
| Metastasis (M) classification | ||||
| M1 vs. M0 | 355 | 0.776 | 0.335–1.756 | 0.554 |
| Grade (G) classification | ||||
| G2 vs. G1 | 145 | 1.522 | 0.416–6.177 | 0.529 |
| G3 vs. G1 | 228 | 1.514 | 0.421–6.059 | 0.53 |
| Gender | ||||
| Male vs. female | 375 | 1.088 | 0.713–1.662 | 0.695 |
#, categorical dependent variable, greater or less than the median expression level; *, P<0.05. MATN3, matrilin-3.
Multivariate analysis
Univariate analysis showed that high MATN3 expression was substantially correlated with poor OS [hazard ratio (HR) =1.424, 95% CI: 1.200–1.689, P=5.08e-05]. Other clinicopathological variables included age, advanced stage, and TNM classification associated with poor survival (Table 3).
Table 3. Univariate and multivariate analysis of the relationship between MATN3# expression and overall survival among gastric patients.
| Parameter | Univariate analysis | Multivariate analysis | |||||
|---|---|---|---|---|---|---|---|
| HR | 95% CI | P value | HR | 95% CI | P value | ||
| Age | 1.264 | 1.055–1.514 | 0.006* | 1.44 | 1.188–1.746 | 0* | |
| Gender | 1.484 | 0.980–2.247 | 0.062 | 1.478 | 0.966–2.261 | 0.071 | |
| Grade | 1.368 | 0.947–1.977 | 0.095 | 1.504 | 1.012–2.233 | 0.043* | |
| Stage | 1.535 | 1.221–1.931 | 0* | 1.564 | 0.991–2.468 | 0.055 | |
| Tumor (T) | 1.298 | 1.023–1.645 | 0.032* | 1.095 | 0.783–1.531 | 0.597 | |
| Metastasis (M) | 2.048 | 1.096–3.827 | 0.025* | 1.803 | 0.794–4.094 | 0.159 | |
| Node (N) | 1.313 | 1.041–1.658 | 0.022* | 0.967 | 0.674–1.385 | 0.853 | |
| MATN3 | 1.424 | 1.200–1.689 | 5.08E-05* | 1.091 | 1.051–1.133 | 5.66E-06* | |
#, categorical dependent variable, greater or less than the median expression level; *, P<0.05. MATN3, matrilin-3.
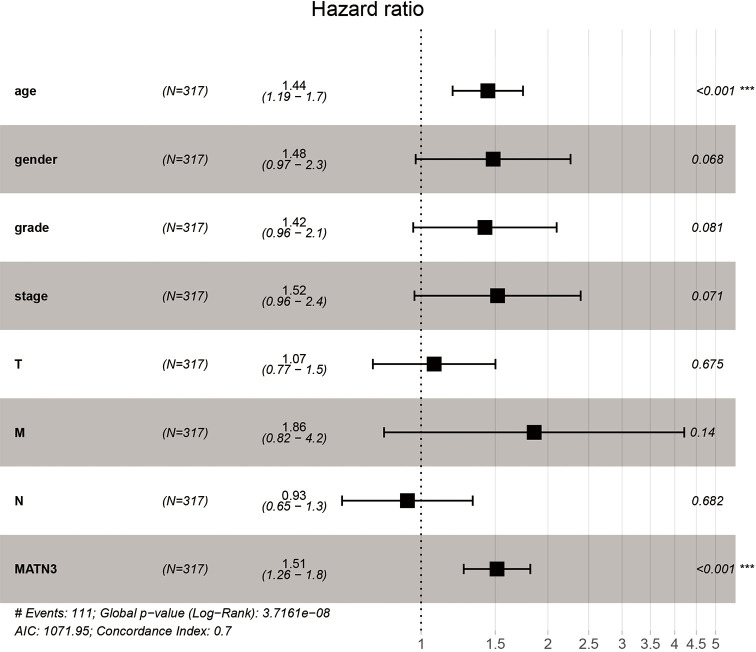
High MATN3 expression remained independently associated with OS was analyzed by multivariate Cox (HR =1.109, 95% CI: 1.051–1.133, P=5.66e-06) and age (HR =1.440, 95% CI: 1.188–1.746, P=0.000) among GC patients (Figure 3).
Figure 3.
Multivariate analysis of MATN3 expression and overall survival in patients with GC patients. MATN3, matrilin-3; GC, gastric carcinoma.
GSEA identified MATN3-related signaling pathways
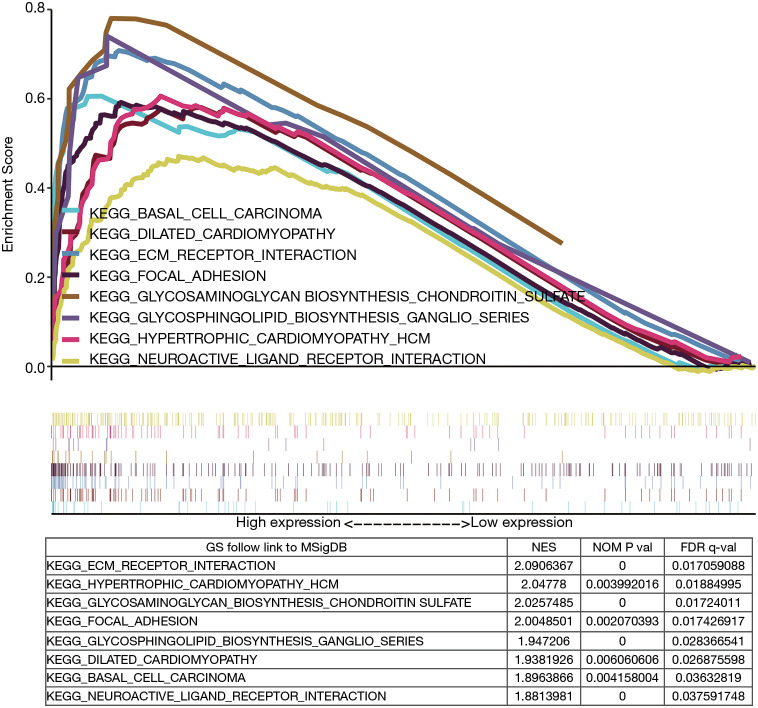
Finally, we used GSEA to recognize the activated signaling pathways in GC, using the Median expression level of MATN3 to classify patients. There was a significant difference (NOM P val =0.05, FDR q-val =0.05) in the degree of the enrichment of the MsigDB collection (v:c2.cp.kegg.v7.1.symbols.gmt). As shown in Figure 4, the gene sets were related to ECM receptor interaction, hypertrophic cardiomyopathy (HCM), glycosaminoglycan biosynthesis chondroitin sulfate, focal adhesion, glycosphingolipid biosynthesis ganglio series, dilated cardiomyopathy, basal cell carcinoma, and neuroactive ligand-receptor interaction.
Figure 4.
Enrichment plots from GSEA. GSEA, gene set enrichment analysis.
Discussion
MANT3, located on chromosome 2p24.1, is related to the cartilage matrix protein (matrilin-1) and von Willebrand factor (9,11). However, the role of MANT3 in human cancer has rarely been reported, especially in GC, which has prompted us to conduct further study. In this study, for the first time, we comprehensively analyzed the relationship between the mRNA profile of MANT3 and the diagnosis and prognosis of GC using multiple TCGA databases via bioinformatics and GSEA analysis.
In the present study, we found that MATN3 was significantly increased in GC tissue samples than in control and paired adjacent ones. This suggests that up-regulation of MATN3 expression may be associated with the occurrence of GC.
In addition, we examined the clinical diagnostic and prognostic value of MATN3 expression in GC patients. First, high MANT3 expression was found to be associated significantly with histological staging and T-staging. Second, Kaplan-Meier curves of OS showed that poor prognosis of gastric cancer patients was associated with high MATN3 expression. The area under the ROC curve indicated that upregulation of MATN3 expression had diagnostic value. Furthermore, univariate logistic analysis showed that MATN3 expressing correlated with clinical stage, T-type staging and other clinical outcomes. Univariate and multifactorial Cox analyses demonstrated that MATN3 expression could be a viable independent signifier of poor prognosis for patients with GC. Multifactorial Cox analysis showed that age was an independently risk factor for OS in patients with GC. Taken together, it is shown that high expression of MATN3 may be a potential diagnostic marker and a marker of poor prognosis in gastric cancer patients. MATN3 may also be a key target gene involved in the growth and metastasis of GC cells.
Furthermore, we observed that high MATN3 expression was associated with ECM receptor interaction, HCM, glycosaminoglycan biosynthesis chondroitin sulfate, focal adhesion, glycosphingolipid biosynthesis ganglio series, dilated cardiomyopathy, basal cell carcinoma, and neuroactive ligand-receptor interaction by GSEA. Previous studies have reported that ECM receptor interaction may be associated with breast cancer (14,15). HCM also causes more deaths and mortality (16). Glycosaminoglycan sulfate may play a role in lung fibrosis in certain cancer patients (17). Focal adhesion has been reported as an independent factor in cell migration, which is key to cancer dissemination (18).Guri et al. (19) have reported that glycosphingolipid promotes tumorigenesis in hepatocellular carcinoma (HCC). Dilated cardiomyopathy is a clinical diagnosis which can lead to fatal arrhythmias (20,21). Basal cell carcinoma is the single most frequent malignancy, and its occurrence is on the rise (22). Studies also demonstrated that neuroactive ligand-receptor interaction is related to GC (23) and glioblastoma (24). Two of the pathways listed above were not associated with cancer, but those linked to heart disease were associated with higher death rates.
Predicting protein function from mRNA is useful in some ways but not perfect (25). In our study, the association between MATN3 protein with MATN3 mRNA expression was not verified. Because of this, experiments and local clinical information will be conducted in the future.
In summary, MATN3 expressed could be a possible diagnostic and prognostic indicator of low survival in GC. Moreover, ECM receptor interaction, HCM, glycosaminoglycan biosynthesis chondroitin sulfate, focal adhesion, glycosphingolipid biosynthesis ganglio series, dilated cardiomyopathy, basal cell carcinoma, and neuroactive ligand-receptor interaction may be the pathways regulated by MANT3 in GC. Further studies should be conducted to confirm the biological impact of MATN3 expression.
Acknowledgments
Thank you to the anonymous reviewers for their valuable comments and suggestions that helped improve the quality of our manuscript. We would like to express our most sincere thanks to TCGA for providing data support.
Funding: The study was supported by the National Natural Science Foundation of China (81873949, 81671968), Medical Innovation Discipline of Zhejiang Province (Critical Care Medicine, Y2015), Major project co-founded by Zhejiang Province and Ministry of Science and Technology (WKJ-ZJ-1909), Major Science and Technology Project of Wenzhou Science and Technology Bureau (2018ZY002), Applied Research Fund of Wenzhou Science and Technology Bureau (ZG2020012), and Research of Emergency Project on Prevention and Control for COVID-19 of Wenzhou Science and Technology Bureau (ZY202001-2).
Ethical Statement: The authors are accountable for all aspects of the work in ensuring that questions related to the accuracy or integrity of any part of the work are appropriately investigated and resolved. The study was conducted in accordance with the Declaration of Helsinki (as revised in 2013). Institutional ethical approval and informed consent were waived.
Open Access Statement: This is an Open Access article distributed in accordance with the Creative Commons Attribution-NonCommercial-NoDerivs 4.0 International License (CC BY-NC-ND 4.0), which permits the non-commercial replication and distribution of the article with the strict proviso that no changes or edits are made and the original work is properly cited (including links to both the formal publication through the relevant DOI and the license). See: https://creativecommons.org/licenses/by-nc-nd/4.0/.
Reporting Checklist: The authors have completed the REMARK reporting checklist. Available at https://dx.doi.org/10.21037/jgo-21-267
Conflicts of Interest: All authors have completed the ICMJE uniform disclosure form (available at https://dx.doi.org/10.21037/jgo-21-267). The authors have no conflicts of interest to declare.
(English Language Editor: C. Betlazar-Maseh)
References
- 1.Bray F, Ferlay J, Soerjomataram I, et al. Global cancer statistics 2018: GLOBOCAN estimates of incidence and mortality worldwide for 36 cancers in 185 countries. CA Cancer J Clin 2018;68:394-424. 10.3322/caac.21492 [DOI] [PubMed] [Google Scholar]
- 2.Surveillance E, and End Results (SEER) Program (Available online: https://seer.cancer.gov) SEER*Stat Database: Incidence - SEER Research Data, 9 Registries, Nov 2019 Sub (1975-2017) - Linked To County Attributes - Time Dependent (1990-2017) Income/Rurality, 1969-2017 Counties, National Cancer Institute, DCCPS, Surveillance Research Program, released April 2020, based on the November 2019 submission.
- 3.Ganz PA. Current US Cancer Statistics: Alarming Trends in Young Adults? J Natl Cancer Inst 2019;111:1241-2. 10.1093/jnci/djz107 [DOI] [PMC free article] [PubMed] [Google Scholar]
- 4.Chen W, Zheng R, Baade PD, et al. Cancer statistics in China, 2015. CA Cancer J Clin 2016;66:115-32. 10.3322/caac.21338 [DOI] [PubMed] [Google Scholar]
- 5.Yang L, Zheng R, Wang N, et al. Incidence and mortality of stomach cancer in China, 2014. Chin J Cancer Res 2018;30:291-8. 10.21147/j.issn.1000-9604.2018.03.01 [DOI] [PMC free article] [PubMed] [Google Scholar]
- 6.Rawla P, Barsouk A. Epidemiology of gastric cancer: global trends, risk factors and prevention. Prz Gastroenterol 2019;14:26-38. 10.5114/pg.2018.80001 [DOI] [PMC free article] [PubMed] [Google Scholar]
- 7.Venerito M, Link A, Rokkas T, et al. Review: Gastric cancer-Clinical aspects. Helicobacter 2019;24Suppl 1:e12643. 10.1111/hel.12643 [DOI] [PubMed] [Google Scholar]
- 8.Deak F, Wagener R, Kiss I, et al. The matrilins: a novel family of oligomeric extracellular matrix proteins. Matrix Biol 1999;18:55-64. 10.1016/S0945-053X(98)00006-7 [DOI] [PubMed] [Google Scholar]
- 9.Wagener R, Kobbe B, Paulsson M. Primary structure of matrilin-3, a new member of a family of extracellular matrix proteins related to cartilage matrix protein (matrilin-1) and von Willebrand factor. FEBS Lett 1997;413:129-34. 10.1016/S0014-5793(97)00895-8 [DOI] [PubMed] [Google Scholar]
- 10.Klatt AR, Nitsche DP, Kobbe B, et al. Molecular structure and tissue distribution of matrilin-3, a filament-forming extracellular matrix protein expressed during skeletal development. J Biol Chem 2000;275:3999-4006. 10.1074/jbc.275.6.3999 [DOI] [PubMed] [Google Scholar]
- 11.Otten C, Hansen U, Talke A, et al. A matrilin-3 mutation associated with osteoarthritis does not affect collagen affinity but promotes the formation of wider cartilage collagen fibrils. Hum Mutat 2010;31:254-63. 10.1002/humu.21182 [DOI] [PubMed] [Google Scholar]
- 12.Mootha VK, Lindgren CM, Eriksson KF, et al. PGC-1alpha-responsive genes involved in oxidative phosphorylation are coordinately downregulated in human diabetes. Nat Genet 2003;34:267-73. 10.1038/ng1180 [DOI] [PubMed] [Google Scholar]
- 13.Subramanian A, Tamayo P, Mootha VK, et al. Gene set enrichment analysis: a knowledge-based approach for interpreting genome-wide expression profiles. Proc Natl Acad Sci U S A 2005;102:15545-50. 10.1073/pnas.0506580102 [DOI] [PMC free article] [PubMed] [Google Scholar]
- 14.Bao Y, Wang L, Shi L, et al. Transcriptome profiling revealed multiple genes and ECM-receptor interaction pathways that may be associated with breast cancer. Cell Mol Biol Lett 2019;24:38. 10.1186/s11658-019-0162-0 [DOI] [PMC free article] [PubMed] [Google Scholar]
- 15.Yeh MH, Tzeng YJ, Fu TY, et al. Extracellular Matrix-receptor Interaction Signaling Genes Associated with Inferior Breast Cancer Survival. Anticancer Res 2018;38:4593-605. 10.21873/anticanres.12764 [DOI] [PubMed] [Google Scholar]
- 16.Magnusson P, Gadler F, Liv P, et al. Causes of death and mortality in hypertrophic cardiomyopathy patients with implantable defibrillators in Sweden. J Cardiovasc Med (Hagerstown) 2016;17:478-84. 10.2459/JCM.0000000000000359 [DOI] [PubMed] [Google Scholar]
- 17.Lan Y, Li X, Liu Y, et al. Pingyangmycin inhibits glycosaminoglycan sulphation in both cancer cells and tumour tissues. J Cell Mol Med 2020;24:3419-30. 10.1111/jcmm.15017 [DOI] [PMC free article] [PubMed] [Google Scholar]
- 18.Paluch EK, Aspalter IM, Sixt M. Focal Adhesion-Independent Cell Migration. Annu Rev Cell Dev Biol 2016;32:469-90. 10.1146/annurev-cellbio-111315-125341 [DOI] [PubMed] [Google Scholar]
- 19.Guri Y, Colombi M, Dazert E, et al. mTORC2 Promotes Tumorigenesis via Lipid Synthesis. Cancer Cell 2017;32:807-23.e12. 10.1016/j.ccell.2017.11.011 [DOI] [PubMed] [Google Scholar]
- 20.Junttila MJ, Holmstrom L, Pylkas K, et al. Primary Myocardial Fibrosis as an Alternative Phenotype Pathway of Inherited Cardiac Structural Disorders. Circulation 2018;137:2716-26. 10.1161/CIRCULATIONAHA.117.032175 [DOI] [PubMed] [Google Scholar]
- 21.Schultheiss HP, Fairweather D, Caforio ALP, et al. Dilated cardiomyopathy. Nat Rev Dis Primers 2019;5:32. 10.1038/s41572-019-0084-1 [DOI] [PMC free article] [PubMed] [Google Scholar]
- 22.Rubin AI, Chen EH, Ratner D. Basal-cell carcinoma. N Engl J Med 2005;353:2262-9. 10.1056/NEJMra044151 [DOI] [PubMed] [Google Scholar]
- 23.Li H, Liu JW, Liu S, et al. Bioinformatics-Based Identification of Methylated-Differentially Expressed Genes and Related Pathways in Gastric Cancer. Dig Dis Sci 2017;62:3029-39. 10.1007/s10620-017-4740-6 [DOI] [PubMed] [Google Scholar]
- 24.Zhou L, Tang H, Wang F, et al. Bioinformatics analyses of significant genes, related pathways and candidate prognostic biomarkers in glioblastoma. Mol Med Rep 2018;18:4185-96. 10.3892/mmr.2018.9411 [DOI] [PMC free article] [PubMed] [Google Scholar]
- 25.Guo Y, Xiao P, Lei S, et al. How is mRNA expression predictive for protein expression? A correlation study on human circulating monocytes. Acta Biochim Biophys Sin (Shanghai) 2008;40:426-36. 10.1111/j.1745-7270.2008.00418.x [DOI] [PubMed] [Google Scholar]


