Abstract
Background
The N6-methyladenosine (m6A) plays an important role in epigenetic modification and tumor progression, but the modulations of m6A in hepatocellular carcinoma (HCC) have not been determined while the relationship between m6A regulation and immune cell infiltration remains unclear.
Methods
This study investigated the modification patterns of m6A by analyzing HCC samples from The Cancer Genome Atlas (TCGA) database and the Gene Expression Omnibus (GEO) dataset, and performed molecular typing based on the characteristics of immune cell infiltration. The m6Ascore was also constructed to quantify m6A modifications and predict the immunotherapy response and prognosis of HCC patients.
Results
Of the 364 samples, 31 (8.52%) were genetically altered in the m6A regulatory gene, with the highest frequency of mutations in HNRNPC, ZC3H13, and LRPPRC. Three distinct molecular subtypes of m6A were identified in 590 HCC samples, which were associated with different immune cell infiltrates: immunodepletion type, immune activation type, and immune immunity type. According to the construction of the m6Ascore system in the m6A genotype, HCC patients could be divided into high and low groups. The m6A modified pattern, characterized by immune immunity and immune failure, showed a lower score and a better prognosis. However, the immune-activated type of m6A had a higher score and a poorer prognosis. Further analysis showed that the m6Ascore was correlated with tumor mutation burden (TMB), and the higher the TMB, the worse the prognosis. m6Ascore was also correlated with the expression of cytotoxic T-lymphocyte-associated protein 4 (CTAL-4), and the higher the score, the higher the expression of HCC in patients.
Conclusions
HCC has a unique m6A modification pattern, and 3 different m6A subtypes help to classify HCC, provide knowledge of drug regimens for immunotherapy, and can be used to predict treatment response and prognosis.
Keywords: N6-methyladenosine (m6A), hepatocellular carcinoma (HCC), immune profiles, subtypes
Introduction
Hepatocellular carcinoma (HCC) is the most common type of primary liver cancer, accounting for 75–85% of cases. In 2020, more than 900,000 new cases of HCC were recorded globally, and its mortality rate ranks third among malignant tumors (1). Chronic viral hepatitis, alcoholic and nonalcoholic liver disease, carcinogens, and genetic factors are the main risk factors for HCC (2,3). In the past 10 years, breakthroughs in gene sequencing technology, especially second-generation sequencing technology, have promoted the study of tumor genes, providing powerful tools to elucidate the molecular mechanism of HCC occurrence and development, and also providing more options for the treatment of HCC (4,5). The rise of immunotherapies, such as immunomodulators, immune checkpoint inhibitors, and cellular immunotherapy, offer new therapeutic directions for the treatment of HCC.
As researchers deepen their understanding of the diversity and complexity of the tumor microenvironment (composed mainly of immune cells and extracellular matrix), a subset of immune cell subsets is being increasingly linked to tumor genesis and metastasis (6-8). Immune checkpoint inhibitors, anti-programmed cell death protein 1/programmed death-ligand 1 (PD-1/PD-L1), and anti-cytotoxic T-lymphocyte-associated protein 4 (CTLA-4) have been used to achieve success in the treatment of HCC patients, improving disease remission rates and control rates (9,10); however, low single-drug response rates remain a significant problem. The liver has unique immune characteristics, such as high immune cell infiltration, strong immunogenicity, and a variety of immune microenvironments, which account for the complex immune regulation mechanism of HCC to a certain extent (11). Additionally, HCC patient treatment is often complicated by cirrhosis, with immune drugs displaying varied pharmacokinetic characteristics in patients with cirrhosis. Based on these characteristics, HCC has been classified into different immunotypes to guide immunotherapy decisions.
There are many types of RNA modifications in eukaryotic messenger RNA (mRNA), which are widely involved in the various biological behaviors of RNA. The methylation of N6 adenosine (m6A) is the most abundant RNA modification in eukaryotic cells (12). It is controlled by three regulatory proteins: methyltransferase (“writer”), demethylase (“eraser”), and binding protein (“reader”). An increasing number of studies have shown that the alteration and abnormal expression of m6A regulatory genes are associated with the progression of malignant tumors and immune regulation (12-14). A recent study suggested that m6A modification modulates the tumor microenvironment and improves patient response to PD-1 therapy by blocking m6A-modified demethylation enzymes (15). In addition, several studies have also confirmed that m6A modification is involved in HCC proliferation, replication, invasion, and metastasis (16-19).
At present, the modification mode of the m6A regulatory gene in HCC is not completely understood, and there are few studies on the molecular typing of the m6A regulatory gene and HCC. The purpose of this study was thus to explore the modification mode of m6A in HCC, analyze its major components to conduct molecular typing of HCC, and build a scoring system for quantitative analysis of the modifications of M6a to evaluate their therapeutic response in HCC patients, in order to provide a theoretical basis for personalized treatment of HCC. We present the following article in accordance with the REMARK reporting checklist (available at https://dx.doi.org/10.21037/jgo-21-378).
Methods
HCC data set and preprocessing
We obtained RNA-sequencing (RNA-Seq) and mutation data for 374 tumors and 50 normal samples in the HCC cohort from The Cancer Genome Atlas (TCGA, https://cancer genomes.Nih.gov/) and downloaded copy number variation (CNV) data from the University of California, Santa Cruz (UCSC) website. The GSE14520 liver cancer data set was downloaded from Gene Expression Omnibus (GEO), containing 223 tumor samples. All RNA-Seq data were normalized using the Combat function of the SVA package in R. The 23 HCC-related m6A methylation-related genes were counted by an R package ‘ESTIMATE’ (https://www.r-project.org/); to obtain the CNV data, mutation status, gene types, and correlations between genes.
Survival analysis
Univariate Cox regression analysis and the Kaplan-Meier method were used to evaluate the prognostic effect of 23 HCC-associated m6A methylation genes. When the Kaplan-Meier method was used to plot survival curves, a log-rank P value <0.05 was considered statistically significant.
Consistent cluster analysis and differential gene analysis
The ConsensusClusterPlus software package was used to analyze the profiles of 23 m6A genes in HCC, including a total of 23 m6A regulators, 8 writers (METTL3, METTL14, RBM15, RBM15B, WTAP, KIAA1429, CBLL1, and ZC3H13), 2 erasers (ALKBH5 and FTO), and 13 readers (YTHDC1, YTHDC2, YTHDF1, YTHDF2, YTHDF3, IGF2BP1, IGF2BP2, IGF2BP3, HNRNPA2B1, HNRNPC, FMR1, LRPPRC, and ELAVL1). Meanwhile, the single sample gene set enrichment analysis (ssGSEA) algorithm was used to calculate the content of immune cells (28 kinds of immune cells) in tumor samples, and the infiltration of immune cells among different m6A types was compared. To identify the m6A-related genes, differences between the genotypes (TCGA and RNA-Seq expression matrices of GEO data sets) were analyzed and differentially expressed genes (DEGs) were obtained. Univariate Cox analysis with a P value <0.05 for filtering was then undertaken. The DEGs related to a patient’s prognosis were obtained, and the m6A phenotype based on DEGs was obtained via consistent clustering classification again based on the prognostic DEGs. At the same time, Gene Ontology (GO) and Kyoto Encyclopedia of Genes and Genomes (KEGG) used to analyze DEGs.
m6A score construction and analysis of immune-related markers
Principal component analysis (PCA) was performed on prognostic DEGs, major components 1 and 2 were extracted, and a new score (m6Ascore = PCA1 + PCA2) was set to be obtained, namely, the m6Ascore. The correlation between the m6Ascore and clinical PD-L1 and CTLA-4 subtypes, was analyzed.
Ethical statement
The study was conducted in accordance with the Declaration of Helsinki (as revised in 2013).
Statistical analysis
All RNA-Seq data were normalized by the ComBat function in the sva package. The Wilcoxon rank-sum test was used to compare the differences in gene expression between normal tissues and tumor tissues. The Kaplan-Meier method was used to plot the survival curve, and a log-rank test was performed to test its significance. A P value <0.05 was considered statistically significant. ConsensusClusterPlus software was used for cluster typing, and the ssGSEA algorithm was used to evaluate tumor-infiltrating immune cells. All statistical data were completed using the R language software package (https://www.r-project.org/), and a P value <0.05 was considered statistically significant.
Results
Overview of genetic variation of m6A in HCC
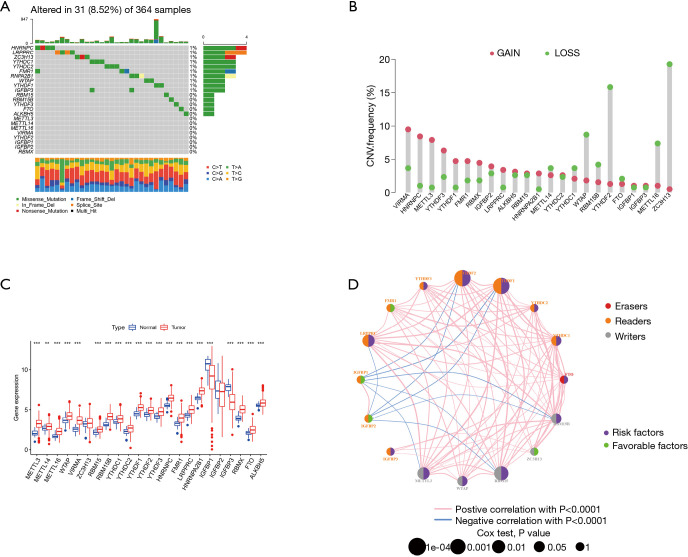
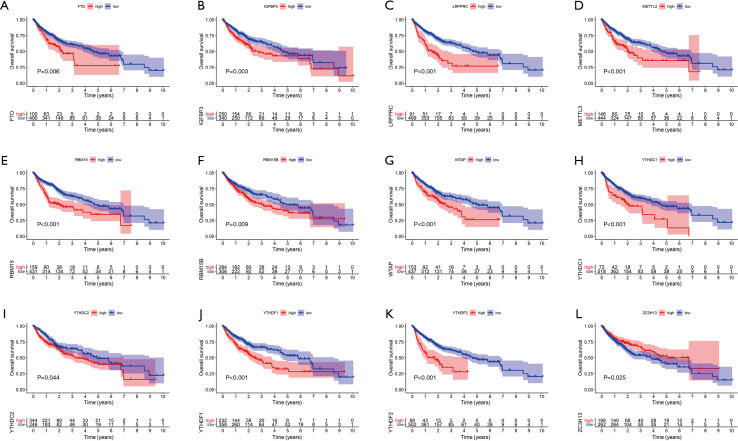
We first investigated the incidence of somatic mutations in 23 m6A regulatory genes found in HCC. Among the 364 samples, 31 samples (8.52%) had genetic changes in the m6A regulatory gene, mainly in missense mutations, splice-site mutations, and nonsense mutations. HNRNPC, ZC3H13, and LRPPRC had the highest mutation frequency, followed by YTHDC1 and YTHDC2 (Figure 1A). Further analysis of 23 m6A regulatory genes showed that m6A in HCC had extensive CNV mutations. VIRMA, HNRNPC, and METTL3 had extensive CNV amplification, whereas WTAP, YTHDF2, METTL16, and ZC3H13 had widespread CNV deletion (Figure 1B). The expression analysis of 23 m6A regulatory genes in normal liver tissue and tumor tissue showed no difference in VIRMA and IGFBP2 expression, low expression of IGFBP1 and IGFBP3 in tumor tissue, and high expression of the remaining 19 genes in tumor tissue (Figure 1C). To further study the interaction between the m6A regulators, a network map of survival and interaction between the m6A regulatory genes was constructed (Figure 1D). Survival analysis showed that the 12 m6A regulatory genes were closely related to the prognosis; FTO, IGFBP3, LRPPRC, EMTTL3, RBM15, WTAP, YTHDC1, YTHDC2, YTHDF1, and YTHDF2 high expression patients had a poorer prognosis, while patients with a high expression of ZC3H13 had better prognosis (Figure 2). The results showed that the m6A modification pattern was mediated simultaneously by erasers, readers, and writers. IGFBP1, IGFBP2, FMR1, and ZC3H13 were associated with protective factors, while 12 regulators, including YTHDF1 and YTHDF2, were associated with risk factors. These results indicate that there are significant differences and associations between the expression of m6A in genomes and the transcriptome between HCC and normal tissues. They also indicate that m6A affects the prognosis of HCC patients. In conclusion, the alteration and genetic variation of m6A play an important role in regulating the occurrence, progression, and prognosis of HCC.
Figure 1.
Genetic alteration of the m6A modulation gene in HCC. (A) In all, 31 of 364 HCC patients experienced modulations of 23 m6A genetic alterations with a frequency of 8.52%. These alterations mainly included missense mutation, splice site mutation, and nonsense mutation. (B) CNV mutation frequency of the 23 m6A regulatory genes. This column represents the frequency of change. Deletion frequency is represented by green dots, while amplification frequency is represented by pink dots. (C) Expression of the 23 m6A regulatory genes in normal tissues and HCC tissues. (D) Expression interaction of the 23 m6A regulatory genes in HCC. The lines connecting the m6A regulatory genes show how they are correlated with each other, with positive associations in red and negative associations in blue. The size of each circle represents the prognostic effect of each regulatory gene and is scaled by P value. The color of the circle’s left half represents the modification type of m6A (erasers, readers, writers), while the circle’s right half represents survival factors affecting the patients. Green represents protective factors, and purple represents risk factors. m6A, N6-methyladenosine; HCC, hepatocellular carcinoma; CNV, copy number variation.
Figure 2.
The prognostic role of 23 m6A regulatory genes in HCC. Twelve genes were strongly associated with HCC prognosis: (A) FTO, (B) IGFBP3, (C) LRPPRC, (D) METTL3, (E) RBM15, (F) RBM15B, (G) WTAB, (H) YTHDC1, (I) YTHDC2, (J) YTHDF1, (K) YTHDF2, and (L) ZC3H13. m6A, N6-methyladenosine; HCC, hepatocellular carcinoma.
Analysis of m6A methylation modification patterns in HCC
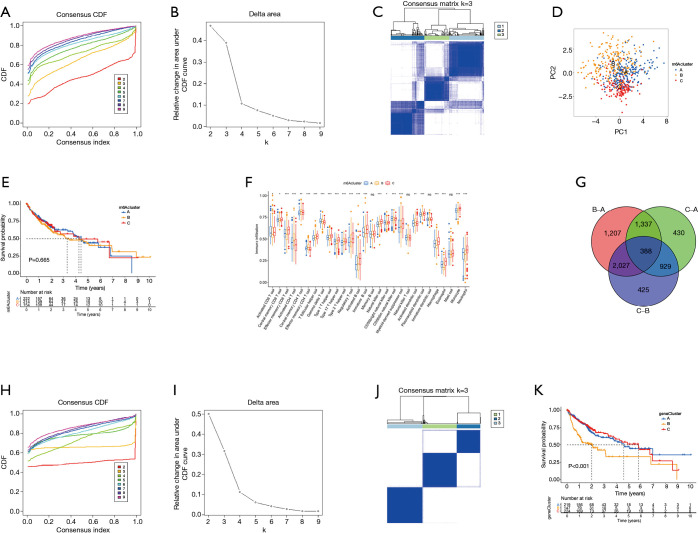
TCGA data and the GSE14520 data set were analyzed through clustering clustering consistency analysis, and further analyzed the modification pattern of m6A in HCC. After K-means clustering, three clusters with different m6A modification patterns, m6Acluster A–C (Figure 3A-3D) were finally identified. Subsequently, survival analysis of the three m6Acluster groups showed no significant difference in prognosis among HCC patients (P=0.665; Figure 3E). We further analyzed the number of immune cells in HCC and compared the differences in the number of immune cells among the three types of m6Aclusters. The results showed that the contents of memory B cells, natural killer T cells, mature dendritic cells, and mast cells were not significantly different among the 28 types of immune cells. Three types of m6Aclusters were significantly correlated with the concentration of the other 24 types of immune cells. T cell subsets were decreased in m6Aclusters A–B, but macrophages in m6Acluster A were significantly increased. The activated CD8+ T cells, central memory CD8+ T cells, and effector memory CD8+ T cells were more abundant in the m6Acluster C. However, the levels of activated CD4+ T cells, central memory CD4+ T cells, and effector memory CD4+ T cells were relatively low (Figure 3F). Therefore, it was concluded that m6Acluster A is a type of immune failure characterized by T cell subset depletion and macrophage enrichment, that m6Acluster B is a type of immune immunity characterized by a lack of T cell infiltration, and that m6Acluster C, on the other hand, is immune-activated and characterized by T cell enrichment. Based on these results, it was hypothesized that these three m6Aclusters may be involved in regulating immunity and affecting the prognosis of HCC patients. Gene analysis between m6Acluster groups was then performed, and 388 DEGs were obtained by univariate Cox analysis (Figure 3G). Concordant clustering was performed again, and three gene cluster types (including gene cluster A–C) were identified. Survival analysis showed significant differences in prognosis (P<0.001; Figure 3H-3K), which confirmed the study’s assumption.
Figure 3.
Genotyping based on m6A methylation regulatory genes. (A,B) The CDF curve and area under the curve in consistency cluster analysis. (C) The consensus fraction matrix of all samples when k=3. The higher the consensus score between two samples, the more likely they are to be grouped into the same cluster in different iterations. (D) A two-dimensional scaling map of the components of the m6A regulatory gene by PCA algorithm. Each dot represents a sample, and the different colors represent three subtypes. (E) Prognostic analysis based on the three m6A regulatory genotypes. (F) Analysis of the three m6A subtypes and immune infiltrating cells. (G) Three DEGs of the m6A subtype are shown in the Venn diagram. (H,I) The CDF curve and the area under the curve in the DEGs concordant cluster analysis of prognosis. (J) The consensus fraction matrix of all samples when k=3. (K) Prognostic analysis based on DEGs classification. m6A, N6-methyladenosine; CDF, cumulative distribution function; PCA, principal component analysis; DEGs differentially expressed genes.
Analysis of DEGs enrichment function and clinical correlation
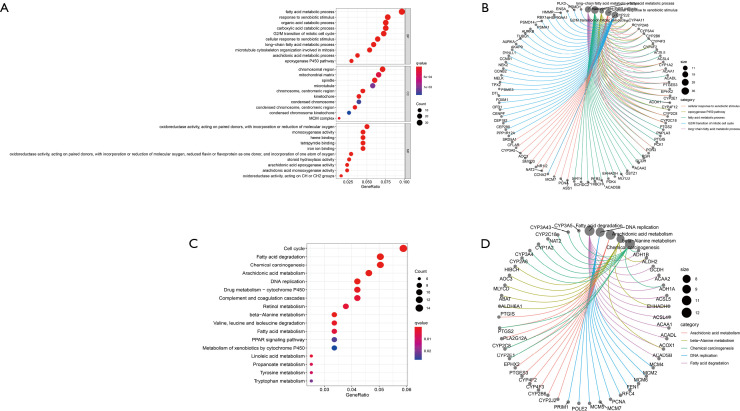
The potential function of DEGs was analyzed using the GO and KEGG pathway. The first five biological processes (BPs), including the fatty acid metabolic process, the G2/M transition of the mitotic cell cycle, and the carboxylic acid catabolic process, were revealed by enrichment function analysis, the organic acid catabolic process, and response to xenobiotics. The first five cell components (CCs) included chromosomes, centromeric regions, microtubule spindle mitochondrial matrices, and chromosomal regions, while the defined molecular function (MF) included the activation of oxidoreductase. KEGG pathway analysis showed that DEGs are part of the cell cycle, DNA replication, and substance metabolism (Figure 4). Cluster analysis was also performed based on DEGs, and these subgroups were shown to have different clinicopathological characteristics. Gene cluster A patients were more likely to be male, younger, and have a favorable prognosis. Patients with gene cluster C had early clinical staging and a relatively good prognosis (Figure 5A). These results suggest that the screened DEGs play a regulatory role in substance metabolism and cell cycle and are closely related to clinicopathological characteristics.
Figure 4.
Analysis of DEGs enrichment function. (A) Bubble diagram of the result of the concentration function. (B) Circus diagram to enrich the results of the function. The red and blue dots indicate the Q value, and the radius of the dots indicates the gene count. (C) Bubble diagram of KEGG pathway analysis results. (D) Circus diagram of KEGG pathway analysis results. The red and blue dots indicate the Q value, and the radius of the dots indicates the gene count. DEG, differentially expressed gene; KEGG, Kyoto Encyclopedia of Genes and Genomes; BP, biological process; CC, cell component; MF, molecular function.
Figure 5.
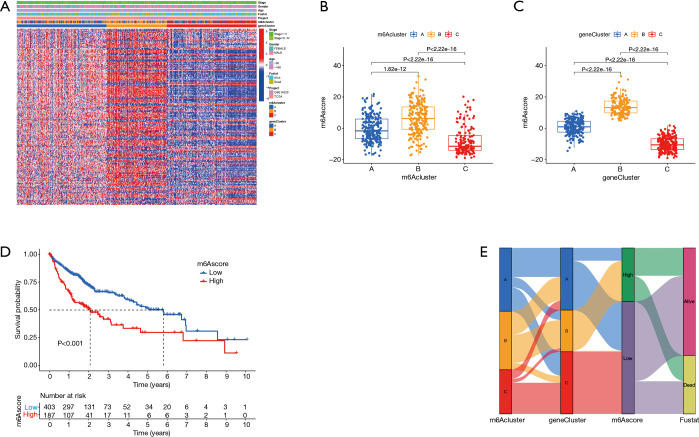
m6Ascore construction. (A) Correlation analysis between DEGs typing and clinical features and patients were divided into different genomic subtypes. The TNM stage, age, sex, prognosis, molecular subtype, and gene cluster were used as patient annotations. (B) Correlation between the m6Acluster and m6Ascore. (C) Correlation analysis between gene clusters A and the m6Ascore. (D) Prognostic analysis of low and high m6Ascore. (E) Sankey plots of different molecular subtypes (A-C), m6A gene clusters, and m6Ascore. m6A, N6-methyladenosine; DEGs, differentially expressed genes; TNM, tumor-node-metastasis.
Construction of an m6Ascore and its clinical significance
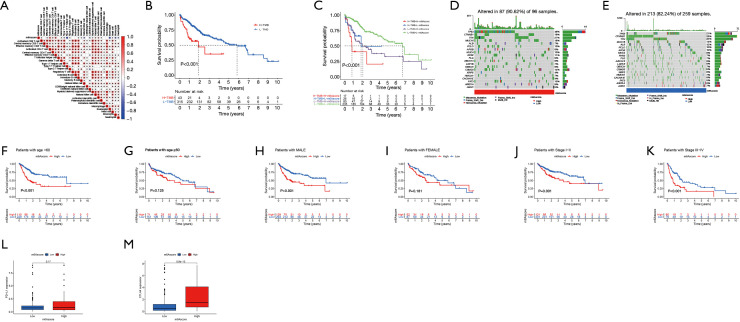
This study found that m6A modification has a regulatory effect on prognosis, metabolism, and immune infiltration. However, these findings were based on the HCC population, and it is not yet possible to accurately predict the modification pattern of m6A methylation in a single HCC patient. Therefore, PCA was performed based on DEGs, and a set m6Ascore (m6Ascore = PCA1 + PCA2) was used to quantify the modification pattern of m6A in a single HCC patient, while the treatment response and prognosis of the patient were predicted. m6Aclusters and gene clusters were associated with an m6Ascore, and patients with higher scores had a poorer prognosis than those with lower scores (P<0.001). Gene cluster A was associated with a higher m6Ascore and better prognosis. Conversely, gene cluster C had a low m6Ascore and poor prognosis (Figure 5B-5E). In terms of immune cells, the activated CD4+ T cells and effector memory CD4+ T cells were positively correlated with the m6Ascore, while the T helper 17 cells and eosinophils were significantly negatively correlated with the m6Ascore (Figure 6A,6B). In addition, analyses incorporating patient age, gender, tumor clinical stage, and tumor mutation load showed that m6Ascore was a reliable predictor of patient prognosis and that TP53 and CSMD3 had higher mutations in patients with high m6Ascores scores. On the other hand, we found higher expression of CTLA4 in patients with high m6Ascore (Figure 6B-6M).
Figure 6.
Clinical significance of the m6Ascore. (A) Correlation analysis between the m6Ascore and 28 kinds of immune cells. (B-E) Correlation and prognostic analysis of the m6Ascore and tumor mutation load. (F-K) Analysis of the prognostic ability of an m6Ascore to age, sex, and TNM stage. (L) Correlation analysis of the m6Ascore and PD-L1 expression. (M) Correlation analysis between the m6Ascore and CTLA-4 expression. m6A, N6-methyladenosine; TNM, tumor-node-metastasis; PD-L1, programmed death-ligand 1; CTLA, cytotoxic T-lymphocyte-associated protein 4; TMB, tumor mutation burden.
Discussion
Based on TCGA database and GSE dataset, this study first analyzed the modification pattern of the m6A modulator gene in HCC, its expression in HCC, and its influence on the biological behavior of HCC. The study showed that the mutation frequency of the m6A regulatory gene in HCC was higher (8.52%), which was greater than the 0.02–8.07% mutation rate presently reported (20). Furthermore, the increased frequency of the m6A regulatory gene mutation was associated with increased gene expression. HCC’s m6A regulator features a higher frequency of CNV. Moreover, the expression of VIRMA, HNRNPC, and METTL3 were elevated with the increase of CNV. Hu et al.’s study reported that higher levels of HNPNPC were detected in HCC tissues compared with adjacent tissues; the knockdown of HNRNPC could inhibit the proliferation, migration, and invasion of HCC cells (21); and high expression of METTL3 or YTHDF1 was associated with a poor prognosis for HCC patients (19). In summary, it was found that m6A RNA modification regulates certain signaling pathways through methyltransferase, demethylase, and reader effectors, thereby affecting the differential gene expression between HCC and normal tissues, genomic CNV, and genetic mutations, and affecting the prognosis of HCC patients.
An increasing number of studies have shown that m6A regulatory genes play a role in immunity (13), but the overall tumor microenvironment characteristics mediated by integrated m6A regulatory genes are yet to be fully understood. At present, the formulation of a treatment plan for HCC patients is mainly based on pathological classification analysis and the staging plans of various factors. With the expansion of research, many HCC molecular subtypes have been found to be significantly correlated with the prognosis of HCC, which lays a foundation for the selection of corresponding molecular targeted drugs for different types of patients. The identification of different m6A modification patterns based on the immune microenvironment is helpful for the formulation of precision therapy. Previous studies have shown that the tumor microenvironment plays an important role in regulating tumor progression and the efficacy of immunotherapy (22). In this study, based on the infiltrated immune cells and immune scores, three HCC tumor microenvironment-related phenotypes were identified: immunodepletion, immune activation, and immune immunity. The immunodepletion type is characterized by T cell depletion and macrophage enrichment. Transforming growth factor-β (TGF-β) induces T cell failure and promotes M2 macrophage formation, which in turn suppresses the host immune response (23,24), suggesting that this type is more aggressive and that the combination of TGF-β inhibitors and immune checkpoint inhibitors can potentially enhance efficacy in these patients. Immune-activated types are characterized by T cell enrichment and a high number of CD4 and CD8 cell infiltrates, indicating that HCC patients would benefit more from immunotherapy. Sia et al. found that these patients had a lower rate of tumor recurrence and a better survival rate (25). The opposite of the immunoactivated type is the immune immunity type, which is characterized by mutations in the CTNNB1 gene and a lack of T cell infiltration. Furthermore, activation of the CTNNB1 pathway is associated with T cell rejection (26), suggesting that these types of patients may not be suitable for immunotherapy.
In addition, GO and KEGG analysis of DEGs identified from different m6A modification modes showed that the selected DEG was involved in the regulation of substance metabolism and the cell cycle, suggesting that there may be a close relationship between the modification modes of the m6A regulator and HCC metabolism. Studies have shown that the uptake of exogenous fatty acids can promote the growth and proliferation of HCC cells and that an abnormally high expression of fatty acid transporters on the cell membrane surface of HCC can enhance the uptake of fatty acids and induce epithelial-mesenchymal transformation, further promoting the progression of HCC (27-29). It has been established that the tumor microenvironment alters the metabolism of cancer cells and promotes tumor development while enhancing the heterogeneity of cancer (30,31). However, the regulatory role of m6A is still unclear and needs further study.
In this study, we further established an m6Ascore quantification system to define different m6A modification patterns and to provide a reference for individual assessment and treatment strategies. The results showed that the m6A-modified mode, characterized by immune immunity and immune depletion, displayed a lower score and a better prognosis, whereas the immune-activated type of m6A had a higher score and a poorer prognosis. It was observed that the m6A score was associated with tumor mutation burden (TMB), and the higher the TMB, the worse the prognosis. TP53 and CTNNB1 were associated with higher TMB. Studies have shown that the TP53 gene has a high mutation frequency in HCC, and these mutations have immunogenicity in HCC patients. The TP53 mutant type has a higher TMB than does the wild type, and there may an association between the TP53 mutation and immune response (32). Studies have reported that CTNNB1 mutation is related to immune rejection, and patients in whom CTNNB1 mutant chemokines are downregulated, tend to be treated with anti-PD-1 (33). The study of Yarchoan found that the immune response rate of HCC has a linear relationship with TMB, and the larger the TMB, the higher the PD-1 inhibitor efficiency (34). In addition, we observed that the m6Ascore was also correlated with the tumor-node-metastasis (TNM) stage, age, and sex, and had a certain prognostic ability. The m6Ascore was also correlated with the expression of CTAL-4, and the higher the score, the higher the expression of HCC patients. These findings suggest that the m6A modification model can be used clinically to help determine immune phenotypes and guide treatment regimens while predicting prognosis in patients with HCC. This study was a retrospective analysis and used information sourced from databases, which introduced a few limitations; also, more data from HCC patients receiving immunotherapy is needed to further verify this study’s findings. In addition, the included pathological features were limited, and more indicators should be included to improve the accuracy of classification and prediction.
Conclusions
In this study, we evaluated m6A modification patterns in HCC based on 23 m6A regulatory genes and classified them according to the characteristics of immune cell infiltration in a tumor microenvironment. This study improves the understanding of the regulatory role of the m6A regulatory gene in HCC and has important reference value for guiding personalized immunotherapy and improving the prognosis of HCC.
Acknowledgments
Funding: None.
Ethical Statement: The authors are accountable for all aspects of the work in ensuring that questions related to the accuracy or integrity of any part of the work are appropriately investigated and resolved. The study was conducted in accordance with the Declaration of Helsinki (as revised in 2013). Institutional ethical approval and informed consent were waived.
Open Access Statement: This is an Open Access article distributed in accordance with the Creative Commons Attribution-NonCommercial-NoDerivs 4.0 International License (CC BY-NC-ND 4.0), which permits the non-commercial replication and distribution of the article with the strict proviso that no changes or edits are made and the original work is properly cited (including links to both the formal publication through the relevant DOI and the license). See: https://creativecommons.org/licenses/by-nc-nd/4.0/.
Reporting Checklist: The authors have completed the REMARK reporting checklist. Available at https://dx.doi.org/10.21037/jgo-21-378
Conflicts of Interest: All authors have completed the ICMJE uniform disclosure form (available at https://dx.doi.org/10.21037/jgo-21-378). The authors have no conflicts of interest to declare.
(English Language Editors: J. Collie and J. Gray)
References
- 1.Sung H, Ferlay J, Siegel RL, et al. Global cancer statistics 2020: GLOBOCAN estimates of incidence and mortality worldwide for 36 cancers in 185 countries. CA Cancer J Clin 2021;71:209-49. 10.3322/caac.21660 [DOI] [PubMed] [Google Scholar]
- 2.Forner A, Llovet JM, Bruix J. Hepatocellular carcinoma. Lancet 2012;379:1245-55. 10.1016/S0140-6736(11)61347-0 [DOI] [PubMed] [Google Scholar]
- 3.Mittal S, El-Serag HB. Epidemiology of hepatocellular carcinoma: consider the population. J Clin Gastroenterol 2013;47Suppl:S2-6. 10.1097/MCG.0b013e3182872f29 [DOI] [PMC free article] [PubMed] [Google Scholar]
- 4.Zucman-Rossi J, Villanueva A, Nault JC, et al. Genetic landscape and biomarkers of hepatocellular carcinoma. Gastroenterology 2015;149:1226-1239.e4. 10.1053/j.gastro.2015.05.061 [DOI] [PubMed] [Google Scholar]
- 5.Llovet JM, Zucman-Rossi J, Pikarsky E, et al. Hepatocellular carcinoma. Nat Rev Dis Primers 2016;2:16018. 10.1038/nrdp.2016.18 [DOI] [PubMed] [Google Scholar]
- 6.Fridman WH, Zitvogel L, Sautès-Fridman C, et al. The immune contexture in cancer prognosis and treatment. Nat Rev Clin Oncol 2017;14:717-34. 10.1038/nrclinonc.2017.101 [DOI] [PubMed] [Google Scholar]
- 7.Mahajan UM, Langhoff E, Goni E, et al. Immune cell and stromal signature associated with progression-free survival of patients with resected pancreatic ductal adenocarcinoma. Gastroenterology 2018;155:1625-1639.e2. 10.1053/j.gastro.2018.08.009 [DOI] [PubMed] [Google Scholar]
- 8.Sun Q, Zhang B, Hu Q, et al. The impact of cancer-associated fibroblasts on major hallmarks of pancreatic cancer. Theranostics 2018;8:5072-87. 10.7150/thno.26546 [DOI] [PMC free article] [PubMed] [Google Scholar]
- 9.Sangro B, Gomez-Martin C, de la Mata M, et al. A clinical trial of CTLA-4 blockade with tremelimumab in patients with hepatocellular carcinoma and chronic hepatitis C. J Hepatol 2013;59:81-8. 10.1016/j.jhep.2013.02.022 [DOI] [PubMed] [Google Scholar]
- 10.El-Khoueiry AB, Sangro B, Yau T, et al. Nivolumab in patients with advanced hepatocellular carcinoma (CheckMate 040): an open-label, non-comparative, phase 1/2 dose escalation and expansion trial. Lancet 2017;389:2492-502. 10.1016/S0140-6736(17)31046-2 [DOI] [PMC free article] [PubMed] [Google Scholar]
- 11.Rizvi S, Wang J, El-Khoueiry AB. Liver cancer immunity. Hepatology 2021;73Suppl 1:86-103. 10.1002/hep.31416 [DOI] [PMC free article] [PubMed] [Google Scholar]
- 12.Cao G, Li HB, Yin Z, et al. Recent advances in dynamic m6A RNA modification. Open Biol 2016;6:160003. 10.1098/rsob.160003 [DOI] [PMC free article] [PubMed] [Google Scholar]
- 13.Shulman Z, Stern-Ginossar N.The RNA modification N6-methyladenosine as a novel regulator of the immune system. Nat Immunol 2020;21:501-12. 10.1038/s41590-020-0650-4 [DOI] [PubMed] [Google Scholar]
- 14.Wang Y, Wang Y, Luo W, et al. Roles of long non-coding RNAs and emerging RNA-binding proteins in innate antiviral responses. Theranostics 2020;10:9407-24. 10.7150/thno.48520 [DOI] [PMC free article] [PubMed] [Google Scholar]
- 15.Yang S, Wei J, Cui YH, et al. m6A mRNA demethylase FTO regulates melanoma tumorigenicity and response to anti-PD-1 blockade. Nat Commun 2019;10:2782. 10.1038/s41467-019-10669-0 [DOI] [PMC free article] [PubMed] [Google Scholar]
- 16.Chen M, Wei L, Law CT, et al. RNA N6-methyladenosine methyltransferase-like 3 promotes liver cancer progression through YTHDF2-dependent posttranscriptional silencing of SOCS2. Hepatology 2018;67:2254-70. 10.1002/hep.29683 [DOI] [PubMed] [Google Scholar]
- 17.Chen Y, Peng C, Chen J, et al. WTAP facilitates progression of hepatocellular carcinoma via m6A-HuR-dependent epigenetic silencing of ETS1. Mol Cancer 2019;18:127. 10.1186/s12943-019-1053-8 [DOI] [PMC free article] [PubMed] [Google Scholar]
- 18.Cheng X, Li M, Rao X, et al. KIAA1429 regulates the migration and invasion of hepatocellular carcinoma by altering m6A modification of ID2 mRNA. Onco Targets Ther 2019;12:3421-8. 10.2147/OTT.S180954 [DOI] [PMC free article] [PubMed] [Google Scholar]
- 19.Zhou Y, Yin Z, Hou B, et al. Expression profiles and prognostic significance of RNA N6-methyladenosine-related genes in patients with hepatocellular carcinoma: evidence from independent datasets. Cancer Manag Res 2019;11:3921-31. 10.2147/CMAR.S191565 [DOI] [PMC free article] [PubMed] [Google Scholar]
- 20.Li Y, Xiao J, Bai J, et al. Molecular characterization and clinical relevance of m6A regulators across 33 cancer types. Mol Cancer 2019;18:137. 10.1186/s12943-019-1066-3 [DOI] [PMC free article] [PubMed] [Google Scholar]
- 21.Hu J, Cai D, Zhao Z, et al. Suppression of heterogeneous nuclear ribonucleoprotein C inhibit hepatocellular carcinoma proliferation, migration, and invasion via Ras/MAPK signaling pathway. Front Oncol 2021;11:659676. 10.3389/fonc.2021.659676 [DOI] [PMC free article] [PubMed] [Google Scholar]
- 22.Galon J, Bruni D. Approaches to treat immune hot, altered and cold tumours with combination immunotherapies. Nat Rev Drug Discov 2019;18:197-218. 10.1038/s41573-018-0007-y [DOI] [PubMed] [Google Scholar]
- 23.Stephen TL, Rutkowski MR, Allegrezza MJ, et al. Transforming growth factor β-mediated suppression of antitumor T cells requires FoxP1 transcription factor expression. Immunity 2014;41:427-39. 10.1016/j.immuni.2014.08.012 [DOI] [PMC free article] [PubMed] [Google Scholar]
- 24.Park BV, Freeman ZT, Ghasemzadeh A, et al. TGFβ1-mediated SMAD3 enhances PD-1 expression on antigen-specific T cells in cancer. Cancer Discov 2016;6:1366-81. 10.1158/2159-8290.CD-15-1347 [DOI] [PMC free article] [PubMed] [Google Scholar]
- 25.Sia D, Jiao Y, Martinez-Quetglas I, et al. Identification of an immune-specific class of hepatocellular carcinoma, based on molecular features. Gastroenterology 2017;153:812-26. 10.1053/j.gastro.2017.06.007 [DOI] [PubMed] [Google Scholar]
- 26.Fan J, Gao Q. Research advances in molecular classification for precision diagnosis and treatment of hepatocellular carcinoma. Chinese Journal of Digestive Surgery 2020;19:28-31. [Google Scholar]
- 27.Krammer J, Digel M, Ehehalt F, et al. Overexpression of CD36 and acyl-CoA synthetases FATP2, FATP4 and ACSL1 increases fatty acid uptake in human hepatoma cells. Int J Med Sci 2011;8:599-614. 10.7150/ijms.8.599 [DOI] [PMC free article] [PubMed] [Google Scholar]
- 28.Nath A, Li I, Roberts LR, et al. Elevated free fatty acid uptake via CD36 promotes epithelial-mesenchymal transition in hepatocellular carcinoma. Sci Rep 2015;5:14752. 10.1038/srep14752 [DOI] [PMC free article] [PubMed] [Google Scholar]
- 29.Cao D, Song X, Che L, et al. Both de novo synthetized and exogenous fatty acids support the growth of hepatocellular carcinoma cells. Liver Int 2017;37:80-9. 10.1111/liv.13183 [DOI] [PMC free article] [PubMed] [Google Scholar]
- 30.Cantor JR, Sabatini DM. Cancer cell metabolism: one hallmark, many faces. Cancer Discov 2012;2:881-98. 10.1158/2159-8290.CD-12-0345 [DOI] [PMC free article] [PubMed] [Google Scholar]
- 31.De Matteis S, Ragusa A, Marisi G, et al. Aberrant metabolism in hepatocellular carcinoma provides diagnostic and therapeutic opportunities. Oxid Med Cell Longev 2018;2018:7512159. 10.1155/2018/7512159 [DOI] [PMC free article] [PubMed] [Google Scholar]
- 32.Shi M, Wang Y, Tang W, et al. Identification of TP53 mutation associated-immunotype and prediction of survival in patients with hepatocellular carcinoma. Ann Transl Med 2020;8:321. 10.21037/atm.2020.02.98 [DOI] [PMC free article] [PubMed] [Google Scholar]
- 33.Xiao X, Mo H, Tu K.CTNNB1 mutation suppresses infiltration of immune cells in hepatocellular carcinoma through miRNA-mediated regulation of chemokine expression. Int Immunopharmacol 2020;89:107043. 10.1016/j.intimp.2020.107043 [DOI] [PubMed] [Google Scholar]
- 34.Yarchoan M, Hopkins A, Jaffee EM. Tumor mutational burden and response rate to PD-1 inhibition. N Engl J Med 2017;377:2500-1. 10.1056/NEJMc1713444 [DOI] [PMC free article] [PubMed] [Google Scholar]


