Abstract
Background
N6-methyladenosine (m6A) RNA methylation regulators play crucial role in tumorigenicity and progression. However, their biological significance in primary glioblastomas (GBM) has not been fully elucidated.
Methods
In the present study, we evaluated the 22 m6A RNA regulators using the integrated data of primary GBM samples from The Cancer Genome Atlas and Chinese Glioma Genome Atlas databases. The different m6A modification patterns and m6A-related gene signature in primary GBM were distinguished by using principal component analysis. Single-sample gene set enrichment analysis was introduced to assess the relative level of immune infiltration. Gene set variation analysis was performed to calculate the enrichment score of the signaling pathways for different clusters. An m6A scoring scheme was established to evaluate the m6A modification pattern in individual tumors in order to predict prognosis and evaluate tumor microenvironment (TME) cell infiltration, immune response, and chemotherapy effect in primary GBM.
Results
Two distinct m6A modification subgroups associated with different clinical features and biological pathways were identified among the 371 primary GBM. Based on 132 prognostic m6A phenotype-related differentially expressed genes (DEGs) between 2 m6A cluster subgroups, an m6A scoring model was constructed to assess the m6A modification pattern in individual tumors. The high-m6A score group was associated with better prognosis and immune response and worse chemotherapy effect.
Conclusions
The findings of the present study indicate the potential role of m6A modification in primary GBM, which will help enhance our understanding of TME characteristics, predict clinical prognosis, and provide important insight into effective immunotherapy and chemotherapy.
Keywords: N6-methyladenosine (m6A), primary glioblastomas (GBM), tumor microenvironment (TME), immunotherapy, chemotherapy
Introduction
Gliomas are the most common and devastating malignant primary tumor of the brain (1,2). The World Health Organization (WHO) classification system classifies gliomas into grades I–IV (3,4). Lower-grade gliomas (LGG) have a grade of II or III (3). However, most LGG will gradually evolve into the deadliest type of glioma, glioblastoma (GBM; grade IV), and eventually lead to death (5). Therefore, new therapeutic and prognostic targets of primary GBM are urgently needed.
N6-methyladenosine (m6A) modification, which is widely observed in mRNAs and non-coding RNAs, play an important role in RNA splicing, export, stability, and translation (6,7). The m6A modification of RNA is mainly controlled by the following 3 regulatory proteins: methyltransferase complex (writer), demethyltransferase (eraser), and recognition protein (reader) (7). m6A RNA modification has been reported to be involved in tumorigenesis, progression, and immunity modulation of various cancers (8-10). A comprehensive understanding of the extensive role of m6A RNA methylation regulators in primary GBM will promote the effectiveness of precise treatment. Although some researchers have begun to explore the role of m6A RNA methylation regulators in glioma (11,12), we are interested in further exploring their important role in primary GBM due to the differences in genetic heterogeneity between different WHO grades of glioma and between primary and recurrent GBM (13,14).
Recent research reports have uncovered the relationship between m6A modification and tumor microenvironment (TME) (15), immune response (16,17), and chemotherapy (18). m6A mRNA is crucial in the development or function of immune cells. Moreover, the TME infiltrating immune cells are significantly involved in the hallmark capabilities of tumor cells and hinder tumor-targeted therapy and immunotherapy (15). The study found that METTL3/14 (m6A RNA methyltransferases) can regulate immune responses to anti- therapy (17). METTL3 mediates gemcitabine, 5-fluorouracil, and cisplatin resistance in non-small-cell lung cancer and pancreatic cancer (19,20). Therefore, it is important to find reliable biomarkers that can identify subsets of primary GBM patients with potential sensitivity to immunotherapy and chemotherapy.
In the present study, we systematically analyzed the 22 m6A RNA methylation regulators using the integrated data of primary GBM samples from The Cancer Genome Atlas (TCGA) (n=153) and Chinese Glioma Genome Atlas (CGGA) (n=218) databases. Utilizing consensus clustering analysis based on the gene expression of 22 m6A RNA methylation regulators, 2 distinct m6A modification subgroups were identified. We comprehensively assessed the relationship between m6A modification patterns and immune infiltration. Furthermore, we identified m6A-related differentially expressed genes (DEGs) between 2 m6A modification subgroups, and their biological functions were investigated. Finally, we constructed a scoring model to quantify the m6A modification patterns of individual primary GBM and predict patients’ clinical outcome, immune response, and chemotherapeutic efficacy.
We present the following article in accordance with the MDAR reporting checklist (available at https://dx.doi.org/10.21037/atm-21-3139).
Methods
Data acquisition
GBM RNA expression profile and corresponding clinical data were obtained from TCGA (https://portal.gdc.cancer.gov/). The expression data and clinical information of the two CGGA cohorts (including CGGAseq1 and CGGAseq2) were downloaded from the CGGA website (http://www.cgga.org.cn/). The inclusion criteria for glioma patients were as follows: (I) glioma patients with overall survival (OS) information; (II) patients with WHO grade IV; and (III) patients with primary GBM (not recurrent nor secondary). Finally, we obtained 153,218 primary GBM patients from TCGA and CGGA databases, respectively. For the 3 RNA-seq cohorts, the fragments per kilobase of transcript per million data values will be converted to transcripts per kilobase million values according to the algorithm described in the previous study (21). The “SVA” R package was used to remove the batch effects among TCGA, CGGA datasets (22). The study was conducted in accordance with the Declaration of Helsinki (as revised in 2013).
Consensus clustering of m6A regulators
We first selected 23 m6A RNA methylation regulators from previously published articles (23). The expression level of VIRMA was not included in the CGGA cohorts, therefore it was excluded in the subsequent analysis. The remaining 22 m6A regulators included 7 writers (METTL3, METTL14, METTL16, WTAP, ZC3H13, RBM15, RBM15B), 2 erasers (ALKBH5, FTO), and 13 readers (YTHDC1, YTHDC2, YTHDF1, YTHDF2, YTHDF3, HNRNPC, FMR1, LRPPRC, HNRNPA2B1, IGFBP1, IGFBP2, IGFBP3, RBMX). Based on the expression of the 22 m6A modulators, patients were classified into 2 groups according to the results of optimal k-means clustering (“kmeans” function in R) and cumulative distribution function (CDF). Cluster analysis was performed using the ConsensusClusterPlus R package with cycle computation 1,000 times to ensure stability and reliability (24). Principal component analysis (PCA) was carried out using “princomp” in R package to validate the molecular subtype. The OS between different clusters was calculated using the Kaplan-Meier method.
Immune infiltration analysis and function analysis of m6A cluster subgroups based on single-sample gene set enrichment analysis (ssGSEA)
To investigate the immune infiltration landscape of primary GBM, ssGSEA was introduced to assess the level of immune infiltration. The enrichment scores representing relative immunocyte abundance were normalized to unity distribution from 0 to 1. Gene set variation analysis (GSVA) was performed with “gsva” in R package to calculate the enrichment score of the pathways for different clusters (25). The Kyoto Encyclopedia of Genes and Genomes (KEGG) pathway gene set and HALLMARKS pathway gene set were download from the MSigDB database. Functional enrichment analysis was performed based on Gene Ontology (GO) and KEGG databases.
Identification of DEGs in 2 m6A cluster subgroups
DEGs between 2 m6A cluster subgroups were screened out individually using the limma package. The threshold for the expression of DEGs was false discovery rate (FDR) <0.05 and | logFC (fold change) | >1. Furthermore, univariate Cox analysis was performed to identified prognostic DEGs.
Construction of the m6A score
We established an m6A scoring scheme to quantify the level of m6A modification in individual patients by PCA. The expression profile of prognostic DEGs was then collated for PCA, and principal component (PC) 1 and PC 2 were extracted as signature scores. Based on a previous study, we adopted the following formula to define the m6A score: m6A score =∑ (PC1i + PC2i), where “i” is the expression of m6A phenotype-related prognostic DEGs (26).
Immune response prediction
To explore the role of m6A score in predicting immunotherapeutic benefits, we used an immunophenoscore from The Cancer Immunome Atlas (https://tcia.at/). Immunophenoscore is a superior predictor of response to anti-cytotoxic T-lymphocyte antigen-4 (CTLA-4) and anti-PD-1 antibodies in 2 independent validation cohorts (27). Furthermore, we compared the expression of some common immune checkpoints among high- and low-m6A score groups, such as programmed cell death-ligand 1 (PD-L1), programmed cell death-ligand 2 (PD-L2), CD47, Signal regulatory protein alpha (SIRPα), Lymphocyte Activating 3 (LAG-3), T-cell immunoglobulin and mucin domain-containing protein 3 (Tim-3), and T-cell immunoglobulin and ITIM domain (TIGIT).
Evaluation of chemotherapeutic drug sensitivity
To predict the half-inhibitory concentration (IC50) of gemcitabine chemotherapy drugs in the high- and low-m6A score groups of primary GBM patients, we used the “pRRophetic” package in R. The pRRophetic package can be used for the prediction of clinical chemotherapeutic response from gene expression microarray data by creating statistical models from the gene expression and drug sensitivity data from cell lines in the Cancer Genome Project (28).
Statistical analysis
The statistical analysis and visualization of this study were obtained by R 3.6.1 with the SVA, ConsensusClusterPlus, gsva, princomp, limma, pRRophetic packages. The statistical methods are based on the recommended methods built into the respective software packages for different data types. Kaplan-Meier survival curves were drawn and compared between subgroups using the survival package. All tests were bilateral, and statistical significance was defined as P<0.05.
Results
Correlation of m6A regulators with prognosis in primary GBM
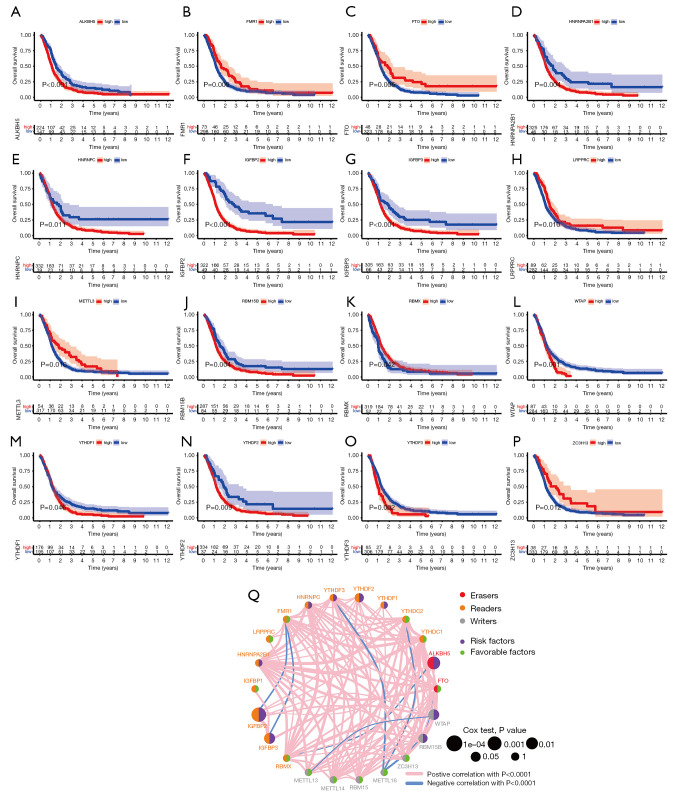
To evaluate the effect of m6A regulators on primary GBM patients, we performed Kaplan-Meier survival analysis using the data from TCGA and CGGA database. As shown in Figure 1A-1P, we found that m6A regulatory genes had an effect on patient survival. Of these, ALKBH5, HNRNPA2B1, HNRNPC, IGFBP2, IGFBP3, RBM15B, WTAP, YTHDF1, YTHDF2, and YTHDF3 were remarkably correlated to worse prognosis in patients with primary GBM. On the contrary, FMR1, FTO, LRPPRC, METTL3, RBMX, and ZC3H13 were associated with better prognosis. The prognostic network showed the interaction and correlation between the 22 m6A regulators (Figure 1Q).
Figure 1.
Screening of prognostic N6-methyladenosine (m6A) regulatory genes using the data from The Cancer Genome Atlas (TCGA) and Chinese Glioma Genome Atlas (CGGA) databases. (A-P) Kaplan-Meier survival analysis of 16 prognostic m6A regulatory genes (ALKBH5, FMR1, FTO, HNRNPA2B1, HNRNPC, IGFBP2, IGFBP3, LRPPRC, METTL3, RBM15B, RBMX, WTAP, YTHDF1, YTHDF2, YTHDF3, ZC3H13); (Q) prognostic network of 22 m6A regulatory genes.
Identification of 2 clusters of primary GBM with different clinical characteristics following consensus clustering of m6A regulators
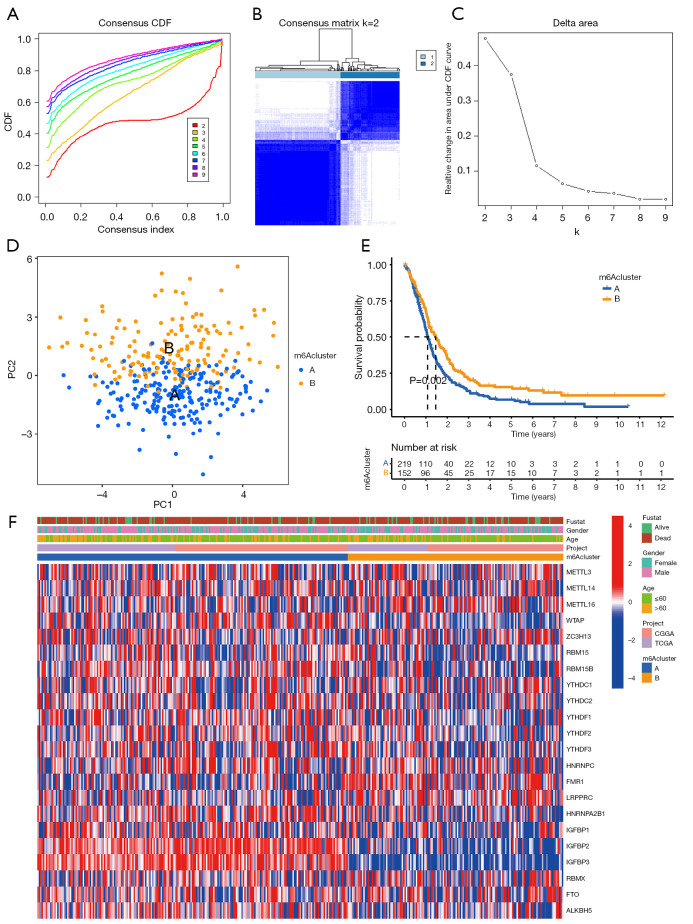
Next, consensus cluster analysis was performed based on the expression profiles of 22 m6A RNA regulators in the TCGA and CGGA datasets. Due to the expression similarity of m6A regulators, the consensus clustering analysis would classify the samples into different clusters. After comparing the relative change in the area under the CDF curve, consensus heatmap, and the area under the CDF curve, k=2 was found to be most optimal, with clustering stability datasets increasing from k=2 to 9 (Figure 2A-2C).
Figure 2.
Consensus clustering of N6-methyladenosine (m6A) genes. (A) Consensus clustering cumulative distribution function (CDF) k=2–9. (B) Consensus clustering matrix for k=2. (C) Relative change in area under CDF curve for k=2–9. (D) Principal components analysis (PCA) for the transcriptome profiles of 2 m6A subtypes, showing a significant difference in transcriptome between different cluster subgroups. Primary glioblastomas (GBM) in the m6A cluster A subgroup are in blue. (E) Kaplan-Meier overall survival curves for 371 primary GBM patients of different clusters. (F) Heatmap of 2 clusters defined by 22 m6A regulatory genes.
A total of 371 primary GBM samples from TCGA and CGGA datasets were then divided into 2 groups (219 samples in 1 group labeled as “m6A cluster A” and 152 samples in another group labeled as “m6A cluster B”). PCA was performed to elucidate the difference in transcriptional profiles between the m6A cluster A and m6A cluster B subgroups. The results indicated that most of the expressions of the m6A regulators expressions mostly showed clear distinction and significant differences in the 2 cluster subgroups (Figure 2D).
The Kaplan-Meier survival analysis revealed that the m6A cluster B subgroup had a better prognosis than the m6A cluster A subgroup (Figure 2E). To assess the roles of each of the 22 key m6A RNA regulators in primary GBM, we designed a heatmap to visualize the associations between the expression levels of the 22 m6A regulators and clinical characteristics, including age, sex, and survival status (Figure 2F).
Functional annotation
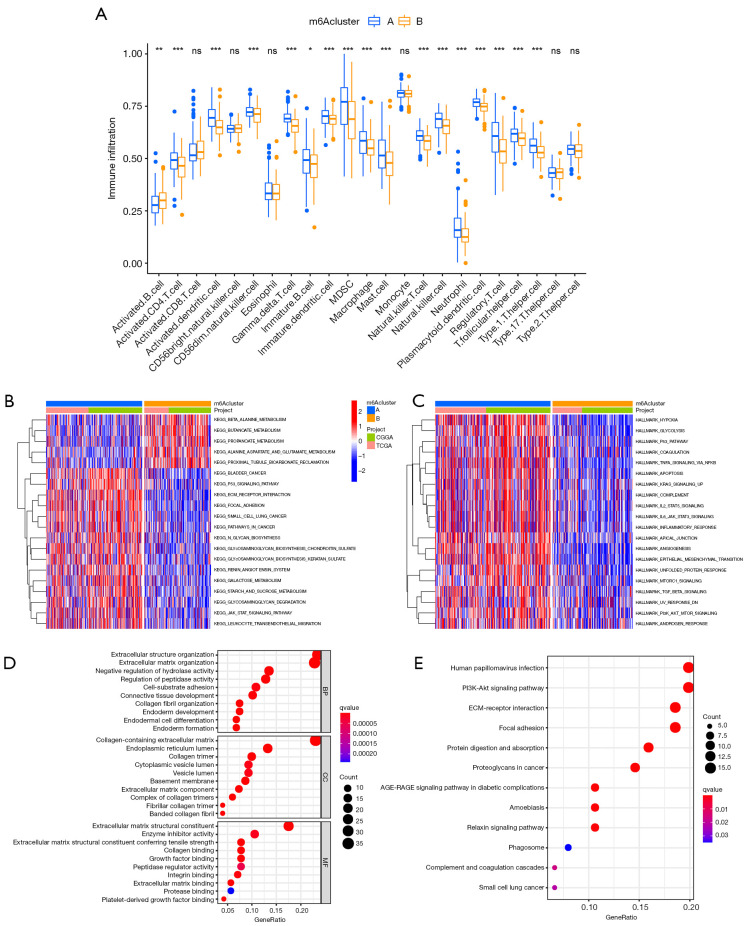
The findings indicated that the consensus clustering results were associated with primary GBM patient outcomes. To better understand the association between primary GBM malignancy and the 22 m6A regulators, we assessed the infiltration of immune cells between the m6A cluster A and m6A cluster B subgroups. As is shown in Figure 3A, immune cells, including activated B cells, activated CD4 T cells, activated dendritic cells, CD56dim natural killer (NK) cells, gamma delta T cells, immature B cells, immature dendritic cells, MDSCs, macrophages, mast cells, NK T cells, NK cells, neutrophils, plasmacytoid dendritic cells, regulatory T cells, T follicular helper cells, and type 1 helper T cells have different immune cell infiltration.
Figure 3.
Interaction and correlation between clusters. (A) Comparison of immune infiltration level of primary glioblastoma patients between N6-methyladenosine (m6A) cluster A and B groups, based on single-sample gene set enrichment analysis algorithm. Data are presented as mean ± SD; ns P>0.05, *P<0.05, **P<0.01, ***P < 0.001. (B,C) Differences in Kyoto Encyclopedia of Genes (KEGG) and HALLMARKS pathways between2 subgroups. (D,E) The Gene Ontology and KEGG analysis of 132 prognostic DEGs between m6A cluster A and m6A cluster B.
Although primary GBM patients were classified into 2 m6A modification phenotypes according to the consensus clustering algorithms based on m6A regulator expression, the underlying patterns of gene expression within these phenotypes remain unclear. Furthermore, we analyzed DEGs between 2 m6A cluster subgroups, which could be considered m6A-related genes. We then annotated their function through GSVA, GO function analysis, and KEGG pathway analysis for biological processes (Figure 3B-3E). The results indicated that m6A phenotype-related DEGs are enriched in immune-related biological processes, including IL2/STAT5, IL6/JAK/STAT3, and the P53 signaling pathway and PI3K-Akt signaling pathway, which are involved in the complex function of the tumor.
Identification of 3 clusters of primary GBM with different clinical characteristics following consensus clustering of 132 prognostic DEGs
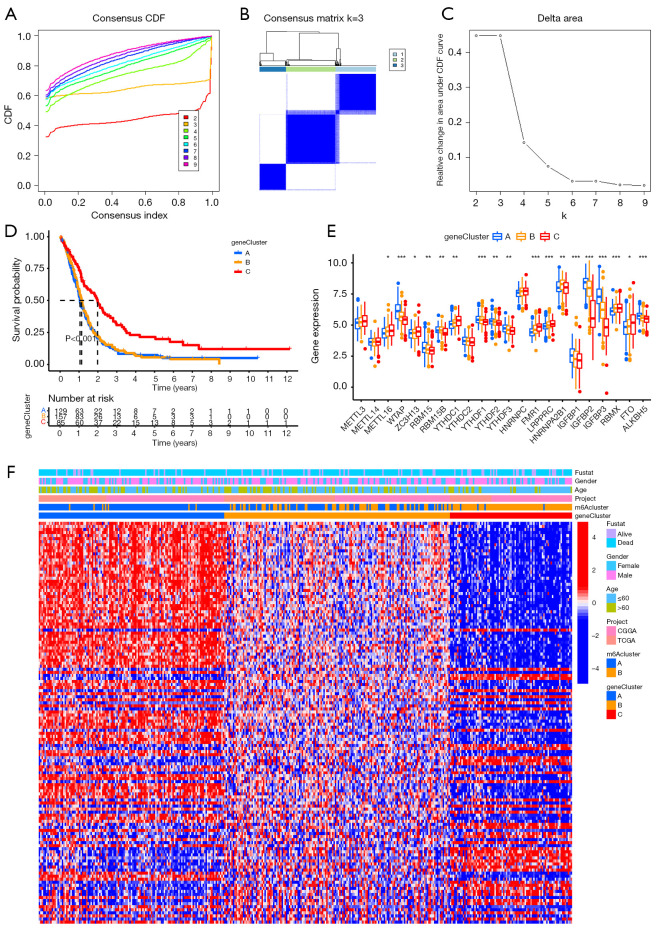
We further screened out prognostic DEGs by survival analysis and obtained 132 genes. Considering that prognostic 132 m6A phenotype-related genes were associated with the prognosis of primary GBM patients and were involved in the critical malignancy-related biological regulatory network, we further performed consensus clustering analysis based on their expressions. According to a comprehensive assessment of CDF curve, consensus heatmap and the area under the CDF curve, we obtained 3 stable transcriptomic phenotypes (Figure 4A-4C).
Figure 4.
Consensus clustering of 132 prognostic differentially expressed genes (DEGs) between N6-methyladenosine (m6A) cluster A and m6A cluster B. (A) Consensus clustering cumulative distribution function k=2–9. (B) Consensus clustering matrix for k=3. (C) Relative change in area under CDF curve for k=2–9. (D) Kaplan-Meier overall survival curves for 371 primary glioblastoma patients of different clusters. (E) Differential expression of 22 m6A regulatory genes in 3 gene clusters. (F) Heatmap showing the correlation between the expression levels of the DEGs derived from 2 m6A clusters and sex, age, m6A clusters and gene clusters. *P<0.05, **P<0.01, and ***P<0.001.
Primary GBM samples from TCGA and CGGA datasets were classified into 3 gene cluster groups (129 samples labeled as “gene cluster A”, 157 samples labeled as “gene cluster B”, and 85 samples labeled as “gene cluster C”) through consensus cluster analysis. The Kaplan-Meier survival curve demonstrated that gene cluster C subgroup had a better prognosis than the other 2 subgroups (Figure 4D). All m6A regulators had remarkable differences in expression among the 3 gene cluster groups, except for METTL3, METTL14, YTHDC2, and HNRNPC (Figure 4E), which verified the diversity of m6A modification modes in primary GBM. We also designed a heatmap to visualize the correlation between the expression levels of the DEGs derived from 2 m6A clusters and sex, age, m6A clusters, and gene clusters (Figure 4F).
Construction of the m6A score and exploration of its clinical relevance
These findings only confirm that m6A modification affects patients’ prognosis and the regulation of immune infiltration. These analyses are based on patient populations only and cannot precisely predict the pattern of m6A methylation in individual tumors. Therefore, we developed an m6A score scoring scheme based on the identified m6A phenotype-related signature genes to quantify the m6A modification pattern of individual primary GBM.
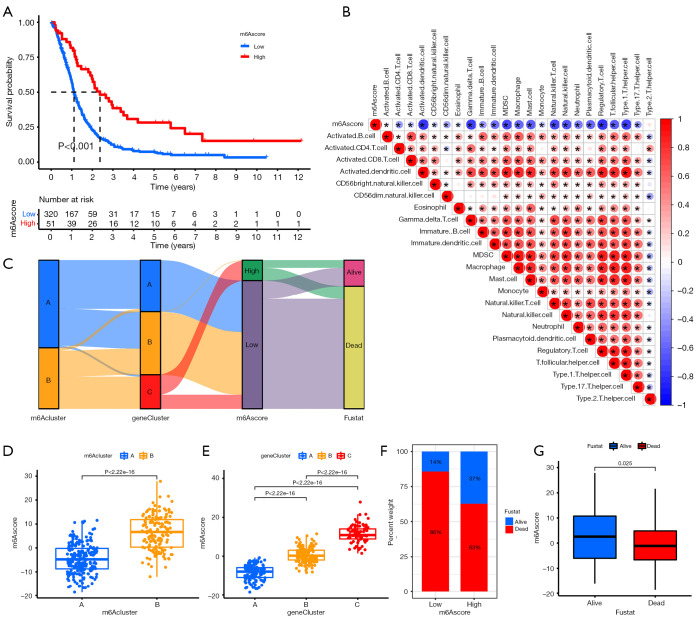
As shown in Figure 5A, patients in the high-m6A score group exhibited significantly longer survival time than those in the low-m6A score group. We further analyzed the relationship between m6A score and immune cells and found that m6A score was negatively correlated with immune cells (Figure 5B). Sankey diagram showed the complex connections between m6A cluster, m6A phenotype-related gene cluster, m6A score, and prognosis (Figure 5C). The findings indicated that m6A cluster A was linked to gene cluster B and gene cluster C. Furthermore, gene cluster B and gene cluster C were linked to a lower m6A score, which has a worse prognosis. Figure 5D-5G shows the relationship between m6A cluster, gene cluster, prognosis, and m6A score in detail.
Figure 5.
Prognostic signature was related to immune cells and clinical prognosis. (A) Kaplan-Meier curves showing the overall survival probability between N6-methyladenosine (m6A) score groups. (B) Sankey diagram showing the association of m6A score groups with m6A clusters, gene clusters, and survival outcome. (C) Correlation analysis of m6A score and immune cells. (D) m6A score difference between gene cluster A, gene cluster B, and gene cluster C. (E) m6A score difference between m6A cluster A and m6A cluster B. (F,G) Association of m6A score with survival outcome.
Role of m6A score in predicting immunotherapeutic benefits
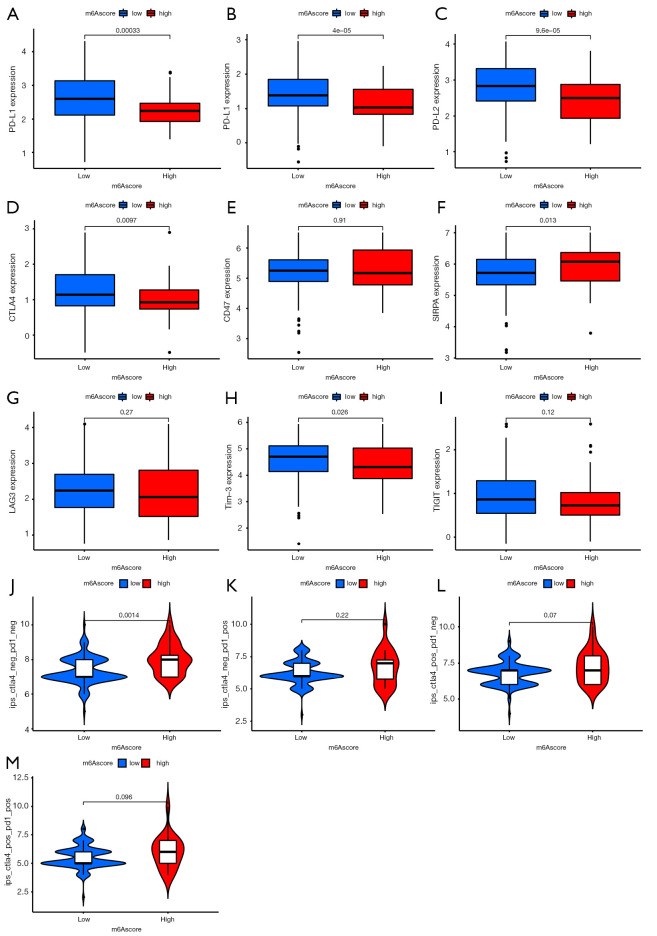
Immune checkpoint inhibitors, such as PD-1/PD-L1 and CTLA-4 inhibitors, have been approved for clinical use in tumors. Other co-inhibitory immune checkpoint molecules have been identified, such as PD-L2, CD47, SIRPα, LAG-3, Tim-3, and TIGIT, which are widely used to evaluate immune response. Our analysis showed that PD-1/PD-L1, PD-L2, CTLA-4, and Tim-3 were downregulated in the high-m6A score group, whereas SIRPα was upregulated (Figure 6A-6I). There was no significant difference in the expression of CD47, LAG-3, and TIGIT between the 2 groups.
Figure 6.
Prediction of immunotherapy effect. (A-I) Expression level of immune checkpoint molecules, including programmed cell death protein (PD)-1, programmed cell death-ligand 1 (PD-L1), programmed cell death-ligand 2 (PD-L2), cytotoxic T-lymphocyte antigen-4 (CTLA-4), CD47, Signal regulatory protein alpha (SIRPα), Lymphocyte Activating 3 (LAG-3), T-cell immunoglobulin and mucin domain-containing protein 3 (Tim-3), and T-cell immunoglobulin and ITIM domain (TIGIT), in high- and low- N6-methyladenosine (m6A) score group patients. (J-M) Immune response of high- and low-m6A score groups associated with CTLA-4 and PD-1.
Immunophenoscore is a superior predictor of response to anti-CTLA-4 and anti-PD-1 antibodies, which could identify determinants of tumor immunogenicity (27). We found that the CTLA-4-negative and PD-1-negative groups had a high immunophenoscore, resulting in better immunotherapeutic benefits (Figure 6J). In the other groups, there was no significant difference in immunophenoscore (Figure 6K-6M).
Role of m6A score in predicting chemotherapeutic effect
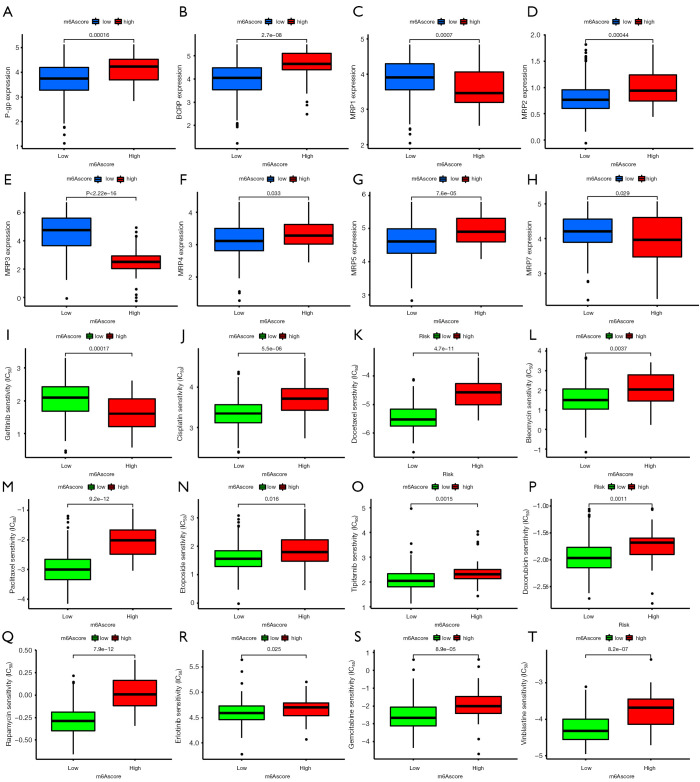
ATP binding cassette (ABC) transporters, such as P-glycoprotein (P-gp), breast cancer resistance protein (BCRP), and multidrug resistance-associated proteins (MRPs) play important roles in drug or multidrug resistance in various cancers. We compared their expression levels in the high- and low-m6A score groups. P-gp and BCRP were overexpressed in the high group, whereas the MRP family showed a complex expression pattern (Figure 7A-7H).
Figure 7.
Prediction of chemotherapeutic effect. (A-H) Expression level of drug resistance-related genes, including P-glycoprotein, breast cancer resistance protein, and multidrug resistance-associated protein (MPR)1, MPR2, MPR3, MPR4, MPR5, and MRP7, in high- and low-N6 methyladenosine score group patients. (I-T) Sensitivity analysis of 12 common chemotherapy drugs in patients in the high- and low-m6A score groups.
According to the pRRophetic algorithm, we predicted the IC50 of 12 common chemotherapeutic agents (gefitinib, cisplatin, docetaxel, bleomycin, paclitaxel, etoposide, tipifarnib, doxorubicin, rapamycin, erlotinib, gemcitabine, vinblastine) in high- and low-m6A score patients, and found that almost all drugs had a higher IC50 in high-m6A score patients, except for gefitinib (Figure 7I-7T). This indicates that the low-m6A score patients were more sensitive to these 11 drugs.
Discussion
In the current study, we evaluated the prognostic value of m6A RNA regulators in primary GBM using the data from TCGA and CGGA databases. In particular, consensus clustering of 22 m6A RNA regulators classified primary GBM patients into the following 2 subgroups: m6A cluster A and m6A cluster B. m6A cluster subgroups influence OS, tumor immune cell infiltration, and key signaling pathways. Moreover, we developed an m6A scoring scheme to quantify the level of m6A modification in individual patients by PCA based on 132 prognostic m6A phenotype-related DEGs between the 2 m6A cluster subgroups. The m6A score could be used to predict clinical prognosis, immunotherapeutic benefits, and chemotherapy effect.
Compelling evidence has shown that m6A modification is involved in the TME, tumor progression, and therapy responses (29-31). Although many studies have demonstrated the epigenetic regulatory role of m6A regulatory factor in tumor development and progression, the tumor promotion and tumor inhibition mediated by integrated m6A RNA methylation regulators factor have not been comprehensively understood. Therefore, the identification of different m6A modification patterns in tumors will provide insight into the role of m6A RNA methylation in tumor pathogenesis, and facilitate more effective immunotherapy or chemotherapy.
Most LGG will progress to GBM with a very poor prognosis within months (32). Some researchers have explored the value of m6A methylation regulators in GBM (12). Considering the huge pathological differences between primary GBM and secondary or recurrent GBM, we specifically analyzed the value of m6A methylation regulators in primary GBM (14,33,34).
In the present study, we identified 2 distinct m6A methylation modification patterns characterized by different clinical outcome, which were correlated with different immune phenotypes and signaling pathways. Previous studies have shown that the TME contexture is involved in facilitating immunosuppression and limiting anti-cancer immune responses (35). m6A modification can also modulate tumor immune response. For example, METTL3 deficiency-mediated m6A modification suppresses macrophage activation (36).
To quantify the m6A modification pattern of individual primary GBM, we established an m6A scoring scheme for precise therapeutic strategies. As a result, the high-m6A score group had a better outcome, while the low-m6A score group demonstrated poor prognosis. Further analyses showed that m6A score was significantly associated with the expression level of immune checkpoint molecules, including PD-1, PD-L1, PD-L2, CTLA-4, SIRPα, and Tim-3, implying that m6A modification could affect the efficacy of immunotherapy. However, the expressions of LAG-3, CD47, and TIGIT were also compared between high- and low-m6A score groups, and did not show significant differences. PD-1/PD-L1 serves as the major immune checkpoint due to its efficacy in highly aggressive tumors through the negative regulation of T-cell-mediated immune response (37). Activation of the PD-1/PD-L1 axis is a key factor in the immunosuppression of the TME. Specifically, PD-1/PD-L1 signaling reduced T-cell activation, cytotoxicity, and proliferation, and increased Tregs survival (38). Similarly, CTLA-4 was found to be inherently expressed in immune cells, leading to attenuated immune responses (39). Tim-3 is associated with dysfunctional/failing T cells, and blocking Tim-3 can improve the function of these cells (40). In summary, the high-m6A score group, which had good prognosis, had low expressions of common immune checkpoint molecules, such as PD-1, PD-L1, CTLA-4, and Tim-3, which demonstrated relatively weak immunosuppression.
We also compared the protein expression levels of several common multidrug resistance-associated ABC transporter families in the 2 groups. The ABC transporter superfamily consists of 7 (A–G) subfamilies with a total of 48 members, and their overexpression is an important cause of multidrug resistance to chemotherapy (41). Among them, P-gp, BCRP, and MRPs are the recognized molecules that contribute to the development of multidrug resistance (42,43). In the present study, P-gp and BCRP were highly expressed in the high-m6A score group, while the expression of the MRP family was more complex. MRP2, MRP4, and MRP5 were highly expressed in the high-m6A score group, whereas MRP1, MRP3, and MRP7 had low expression. As these genes associated with multidrug resistance were expressed differently in the high- and low-m6A score groups, this model may be useful for evaluating chemotherapeutic drug response. We further applied the m6A score model to the prediction of chemotherapy response and found that there were significant differences in the IC50 of chemotherapy drugs between the high- and low-m6A score groups. Among the 12 common chemotherapeutic agents (gefitinib, cisplatin, docetaxel, bleomycin, paclitaxel, etoposide, tipifarnib, doxorubicin, rapamycin, erlotinib, gemcitabine, vinblastine), the high-m6A score group was more sensitive to gefitinib, while for most of the other chemotherapy drugs, the low-m6A score group showed higher sensitivity. Unfortunately, using pRRophetic package, we did not obtain the results of temozolomide, the first-line chemotherapy drug for glioma. ABC transporters perform the function of multidrug resistance by expelling chemotherapy drugs inside the cells. P-gp has a wide spectrum of specific substrates, and can produce cross-resistance to different cytotoxic drugs, such as paclitaxel and doxorubicin (44,45). BCRP also has a variety of substrates, including doxorubicin (46). In the case of the MRP family, MRP1 and MRP7 expel intracellular doxorubicin and reduce its potency (47). The high-m6A score group was more sensitive to gefitinib, while for most of the other chemotherapy drugs, the low-m6A score group showed higher sensitivity. The high-m6A score group had a high expression of P-gp and BCRP, and a low expression of MRP1 and MRP7, which exhibited the characteristics of resistance to doxorubicin. Therefore, the effect of the high- and low-m6A score groups on IC50 of chemotherapy drugs may be the result of multiple factors
In conclusion, we evaluated the m6A modification patterns of 371 primary GBM patients based on 22 m6A regulators. Moreover, we developed an m6A scoring scheme to evaluate the m6A modification pattern in individual tumors, which will help improve our understanding of the characteristics of TME cell infiltration, and predict clinical prognosis, and provide important insight into immunotherapeutic benefits and chemotherapy effect.
Supplementary
The article’s supplementary files as
Acknowledgments
Funding: This work was supported by the National Natural Science Foundation of China (grant number: 81400943).
Ethical Statement: The authors are accountable for all aspects of the work in ensuring that questions related to the accuracy or integrity of any part of the work are appropriately investigated and resolved. The study was conducted in accordance with the Declaration of Helsinki (as revised in 2013).
Reporting Checklist: The authors have completed the MDAR reporting checklist. Available at https://dx.doi.org/10.21037/atm-21-3139
Conflicts of Interest: All authors have completed the ICMJE uniform disclosure form (available at https://dx.doi.org/10.21037/atm-21-3139). The authors report that this work was supported by the National Natural Science Foundation of China (grant number: 81400943). The authors have no other conflicts of interest to declare.
(English Language Editor: R. Scott)
References
- 1.Lefranc F, Le Rhun E, Kiss R, et al. Glioblastoma quo vadis: Will migration and invasiveness reemerge as therapeutic targets? Cancer Treat Rev 2018;68:145-54. 10.1016/j.ctrv.2018.06.017 [DOI] [PubMed] [Google Scholar]
- 2.Mair MJ, Geurts M, van den Bent MJ, et al. A basic review on systemic treatment options in WHO grade II-III gliomas. Cancer Treat Rev 2021;92:102124. 10.1016/j.ctrv.2020.102124 [DOI] [PubMed] [Google Scholar]
- 3.Cancer Genome Atlas Research Network ; Brat DJ, Verhaak RG, et al. Comprehensive, Integrative Genomic Analysis of Diffuse Lower-Grade Gliomas. N Engl J Med 2015;372:2481-98. 10.1056/NEJMoa1402121 [DOI] [PMC free article] [PubMed] [Google Scholar]
- 4.Wesseling P, Capper D. WHO 2016 Classification of gliomas. Neuropathol Appl Neurobiol 2018;44:139-50. 10.1111/nan.12432 [DOI] [PubMed] [Google Scholar]
- 5.Carrillo JA, Kesari S. Is re-radiation for glioblastoma after progression associated with increased survival: to treat or not to treat? Transl Cancer Res 2019;8:4-6. 10.21037/tcr.2018.10.22 [DOI] [PMC free article] [PubMed] [Google Scholar]
- 6.Song P, Yang F, Jin H, et al. The regulation of protein translation and its implications for cancer. Signal Transduct Target Ther 2021;6:68. 10.1038/s41392-020-00444-9 [DOI] [PMC free article] [PubMed] [Google Scholar]
- 7.Zaccara S, Ries RJ, Jaffrey SR. Reading, writing and erasing mRNA methylation. Nat Rev Mol Cell Biol 2019;20:608-24. 10.1038/s41580-019-0168-5 [DOI] [PubMed] [Google Scholar]
- 8.Jiang X, Liu B, Nie Z, et al. The role of m6A modification in the biological functions and diseases. Signal Transduct Target Ther 2021;6:74. 10.1038/s41392-020-00450-x [DOI] [PMC free article] [PubMed] [Google Scholar]
- 9.Uddin MB, Wang Z, Yang C. The m6A RNA methylation regulates oncogenic signaling pathways driving cell malignant transformation and carcinogenesis. Mol Cancer 2021;20:61. 10.1186/s12943-021-01356-0 [DOI] [PMC free article] [PubMed] [Google Scholar]
- 10.Geng Y, Guan R, Hong W, et al. Identification of m6A-related genes and m6A RNA methylation regulators in pancreatic cancer and their association with survival. Ann Transl Med 2020;8:387. 10.21037/atm.2020.03.98 [DOI] [PMC free article] [PubMed] [Google Scholar]
- 11.Lin S, Xu H, Zhang A, et al. Prognosis Analysis and Validation of m6A Signature and Tumor Immune Microenvironment in Glioma. Front Oncol 2020;10:541401. 10.3389/fonc.2020.541401 [DOI] [PMC free article] [PubMed] [Google Scholar]
- 12.Du J, Hou K, Mi S, et al. Malignant Evaluation and Clinical Prognostic Values of m6A RNA Methylation Regulators in Glioblastoma. Front Oncol 2020;10:208. 10.3389/fonc.2020.00208 [DOI] [PMC free article] [PubMed] [Google Scholar]
- 13.Orzan F, De Bacco F, Crisafulli G, et al. Genetic Evolution of Glioblastoma Stem-Like Cells From Primary to Recurrent Tumor. Stem Cells 2017;35:2218-28. 10.1002/stem.2703 [DOI] [PubMed] [Google Scholar]
- 14.Bao Z, Wang Y, Wang Q, et al. Intratumor heterogeneity, microenvironment, and mechanisms of drug resistance in glioma recurrence and evolution. Front Med 2021. [Epub ahead of print]. doi: . 10.1007/s11684-020-0760-2 [DOI] [PubMed] [Google Scholar]
- 15.Li M, Zha X, Wang S. The role of N6-methyladenosine mRNA in the tumor microenvironment. Biochim Biophys Acta Rev Cancer 2021;1875:188522. 10.1016/j.bbcan.2021.188522 [DOI] [PubMed] [Google Scholar]
- 16.Zhou Z, Zhang J, Xu C, et al. An integrated model of N6-methyladenosine regulators to predict tumor aggressiveness and immune evasion in pancreatic cancer. EBioMedicine 2021;65:103271. 10.1016/j.ebiom.2021.103271 [DOI] [PMC free article] [PubMed] [Google Scholar]
- 17.Wang L, Hui H, Agrawal K, et al. m6 A RNA methyltransferases METTL3/14 regulate immune responses to anti-PD-1 therapy. EMBO J 2020;39:e104514. 10.15252/embj.2020104514 [DOI] [PMC free article] [PubMed] [Google Scholar]
- 18.Gu J, Zhan Y, Zhuo L, et al. Biological functions of m6A methyltransferases. Cell Biosci 2021;11:15. 10.1186/s13578-020-00513-0 [DOI] [PMC free article] [PubMed] [Google Scholar]
- 19.Jin D, Guo J, Wu Y, et al. m6A mRNA methylation initiated by METTL3 directly promotes YAP translation and increases YAP activity by regulating the MALAT1-miR-1914-3p-YAP axis to induce NSCLC drug resistance and metastasis. J Hematol Oncol 2019;12:135. 10.1186/s13045-019-0830-6 [DOI] [PMC free article] [PubMed] [Google Scholar] [Retracted]
- 20.Taketo K, Konno M, Asai A, et al. The epitranscriptome m6A writer METTL3 promotes chemo- and radioresistance in pancreatic cancer cells. Int J Oncol 2018;52:621-9. [DOI] [PubMed] [Google Scholar]
- 21.Wagner GP, Kin K, Lynch VJ. Measurement of mRNA abundance using RNA-seq data: RPKM measure is inconsistent among samples. Theory Biosci 2012;131:281-5. 10.1007/s12064-012-0162-3 [DOI] [PubMed] [Google Scholar]
- 22.Leek JT, Johnson WE, Parker HS, et al. The sva package for removing batch effects and other unwanted variation in high-throughput experiments. Bioinformatics 2012;28:882-3. 10.1093/bioinformatics/bts034 [DOI] [PMC free article] [PubMed] [Google Scholar]
- 23.Zhang B, Gu Y, Jiang G. Expression and Prognostic Characteristics of m6 A RNA Methylation Regulators in Breast Cancer. Front Genet 2020;11:604597. 10.3389/fgene.2020.604597 [DOI] [PMC free article] [PubMed] [Google Scholar]
- 24.Wilkerson MD, Hayes DN. ConsensusClusterPlus: a class discovery tool with confidence assessments and item tracking. Bioinformatics 2010;26:1572-3. 10.1093/bioinformatics/btq170 [DOI] [PMC free article] [PubMed] [Google Scholar]
- 25.Subramanian A, Tamayo P, Mootha VK, et al. Gene set enrichment analysis: a knowledge-based approach for interpreting genome-wide expression profiles. Proc Natl Acad Sci U S A 2005;102:15545-50. 10.1073/pnas.0506580102 [DOI] [PMC free article] [PubMed] [Google Scholar]
- 26.Chong W, Shang L, Liu J, et al. m6A regulator-based methylation modification patterns characterized by distinct tumor microenvironment immune profiles in colon cancer. Theranostics 2021;11:2201-17. 10.7150/thno.52717 [DOI] [PMC free article] [PubMed] [Google Scholar]
- 27.Charoentong P, Finotello F, Angelova M, et al. Pan-cancer Immunogenomic Analyses Reveal Genotype-Immunophenotype Relationships and Predictors of Response to Checkpoint Blockade. Cell Rep 2017;18:248-62. 10.1016/j.celrep.2016.12.019 [DOI] [PubMed] [Google Scholar]
- 28.Geeleher P, Cox N, Huang RS. pRRophetic: an R package for prediction of clinical chemotherapeutic response from tumor gene expression levels. PLoS One 2014;9:e107468. 10.1371/journal.pone.0107468 [DOI] [PMC free article] [PubMed] [Google Scholar]
- 29.Gu Y, Wu X, Zhang J, et al. The evolving landscape of N6-methyladenosine modification in the tumor microenvironment. Mol Ther 2021;29:1703-15. 10.1016/j.ymthe.2021.04.009 [DOI] [PMC free article] [PubMed] [Google Scholar]
- 30.Lou X, Wang JJ, Wei YQ, et al. Emerging role of RNA modification N6-methyladenosine in immune evasion. Cell Death Dis 2021;12:300. 10.1038/s41419-021-03585-z [DOI] [PMC free article] [PubMed] [Google Scholar]
- 31.Li H, Wu H, Wang Q, et al. Dual effects of N6-methyladenosine on cancer progression and immunotherapy. Mol Ther Nucleic Acids 2021;24:25-39. 10.1016/j.omtn.2021.02.001 [DOI] [PMC free article] [PubMed] [Google Scholar]
- 32.Cancer Genome Atlas Research Network . Comprehensive genomic characterization defines human glioblastoma genes and core pathways. Nature 2008;455:1061-8. 10.1038/nature07385 [DOI] [PMC free article] [PubMed] [Google Scholar]
- 33.de Paula LB, Primo FL, Tedesco AC. Nanomedicine associated with photodynamic therapy for glioblastoma treatment. Biophys Rev 2017;9:761-73. 10.1007/s12551-017-0293-3 [DOI] [PMC free article] [PubMed] [Google Scholar]
- 34.D'Alessio A, Proietti G, Sica G, et al. Pathological and Molecular Features of Glioblastoma and Its Peritumoral Tissue. Cancers (Basel) 2019;11:469. 10.3390/cancers11040469 [DOI] [PMC free article] [PubMed] [Google Scholar]
- 35.DePeaux K, Delgoffe GM. Metabolic barriers to cancer immunotherapy. Nat Rev Immunol 2021. [Epub ahead of print]. doi: . 10.1038/s41577-021-00541-y [DOI] [PMC free article] [PubMed] [Google Scholar]
- 36.Tong J, Wang X, Liu Y, et al. Pooled CRISPR screening identifies m6A as a positive regulator of macrophage activation. Sci Adv 2021;7:eabd4742. 10.1126/sciadv.abd4742 [DOI] [PMC free article] [PubMed] [Google Scholar]
- 37.Maghrouni A, Givari M, Jalili-Nik M, et al. Targeting the PD-1/PD-L1 pathway in glioblastoma multiforme: Preclinical evidence and clinical interventions. Int Immunopharmacol 2021;93:107403. 10.1016/j.intimp.2021.107403 [DOI] [PubMed] [Google Scholar]
- 38.Persico P, Lorenzi E, Dipasquale A, et al. Checkpoint Inhibitors as High-Grade Gliomas Treatment: State of the Art and Future Perspectives. J Clin Med 2021;10:1367. 10.3390/jcm10071367 [DOI] [PMC free article] [PubMed] [Google Scholar]
- 39.Youssef G, Dietrich J. Ipilimumab: an investigational immunotherapy for glioblastoma. Expert Opin Investig Drugs 2020;29:1187-93. 10.1080/13543784.2020.1826436 [DOI] [PubMed] [Google Scholar]
- 40.Shen S, Chen L, Liu J, et al. Current state and future of co-inhibitory immune checkpoints for the treatment of glioblastoma. Cancer Biol Med 2020;17:555-68. 10.20892/j.issn.2095-3941.2020.0027 [DOI] [PMC free article] [PubMed] [Google Scholar]
- 41.Muriithi W, Macharia LW, Heming CP, et al. ABC transporters and the hallmarks of cancer: roles in cancer aggressiveness beyond multidrug resistance. Cancer Biol Med 2020;17:253-69. 10.20892/j.issn.2095-3941.2019.0284 [DOI] [PMC free article] [PubMed] [Google Scholar]
- 42.Ceballos MP, Rigalli JP, Ceré LI, et al. ABC Transporters: Regulation and Association with Multidrug Resistance in Hepatocellular Carcinoma and Colorectal Carcinoma. Curr Med Chem 2019;26:1224-50. 10.2174/0929867325666180105103637 [DOI] [PubMed] [Google Scholar]
- 43.Gil-Martins E, Barbosa DJ, Silva V, et al. Dysfunction of ABC transporters at the blood-brain barrier: Role in neurological disorders. Pharmacol Ther 2020;213:107554. 10.1016/j.pharmthera.2020.107554 [DOI] [PubMed] [Google Scholar]
- 44.Joshi P, Vishwakarma RA, Bharate SB. Natural alkaloids as P-gp inhibitors for multidrug resistance reversal in cancer. Eur J Med Chem 2017;138:273-92. 10.1016/j.ejmech.2017.06.047 [DOI] [PubMed] [Google Scholar]
- 45.Genovese I, Ilari A, Assaraf YG, et al. Not only P-glycoprotein: Amplification of the ABCB1-containing chromosome region 7q21 confers multidrug resistance upon cancer cells by coordinated overexpression of an assortment of resistance-related proteins. Drug Resist Updat 2017;32:23-46. 10.1016/j.drup.2017.10.003 [DOI] [PubMed] [Google Scholar]
- 46.Mao Q, Unadkat JD. Role of the breast cancer resistance protein (ABCG2) in drug transport. AAPS J 2005;7:E118-33. 10.1208/aapsj070112 [DOI] [PMC free article] [PubMed] [Google Scholar]
- 47.Lei Y, Liu K, University DM. Advances in research on antineoplastic agents' multidrug resistance mediated by efflux transporters. Drug Evaluation Research 2018;41:14-22. [Google Scholar]
Associated Data
This section collects any data citations, data availability statements, or supplementary materials included in this article.
Supplementary Materials
The article’s supplementary files as


