Abstract
What is already known about this topic?
Previous studies have mainly focused on the relationship between temperature and mortality from stroke, but analysis on the effects on years of life lost (YLL) is limited.
What is added by this report?
YLLs were used as the health outcome, and cold and hot weather were found to be significantly associated with an increase in YLLs from stroke and for different groups, with a stronger effect found to be associated with low temperature.
What are the implications for public health practice?
These findings could help identify vulnerable regions and populations that have a more serious temperature-related burden and to guide the practical and effective measures for stroke control from a YLL perspective.
Keywords: temperature, stroke, years of life lost
Although numerous studies suggested non-optimal temperatures may lead to increased stroke mortality, the evidence concerning the effect of ambient temperature on years of life lost (YLLs) due to stroke is still scarce (1). Data on daily mortality, years of life lost, meteorological factors, and air pollution from 93 cities within 30 provincial-level administrative divisions (PLADs) between 2013 and 2016 was collected. We applied a two-stage analytic strategy to assess the association between temperature and YLLs. We used a distributed lag non-linear model (DLNM) with a Gaussian link to evaluate the city-specific association between ambient temperature and YLLs from stroke, and then we applied a multivariate meta-analysis to obtain the pooled effects at regional and national levels. Inverse “J” shaped associations between temperature and YLLs from stroke were found. At the national level, we observed 19.77 (95% CI: 11.16, 28.40), 15.34 (95% CI: 7.77, 22.91), 5.47 (95% CI: 2.57, 8.37), and 2.99 (95% CI: 0.49, 5.49) of YLLs were associated with the effects of extreme cold, mild cold, extreme heat, and mild heat relative to the optimum temperature, respectively. In addition, 10.91% (95% CI: 5.67%, 16.15%) of YLLs could be attributed to non-optimum temperatures, and for each deceased person, a national-averaged 1.39 YLLs (95% CI: 0.72, 2.06) were caused by non-optimum temperature. This study suggested both cold and hot weather would lead to significant life lost for stroke patients and regional adaptation policies and interventions should be considered.
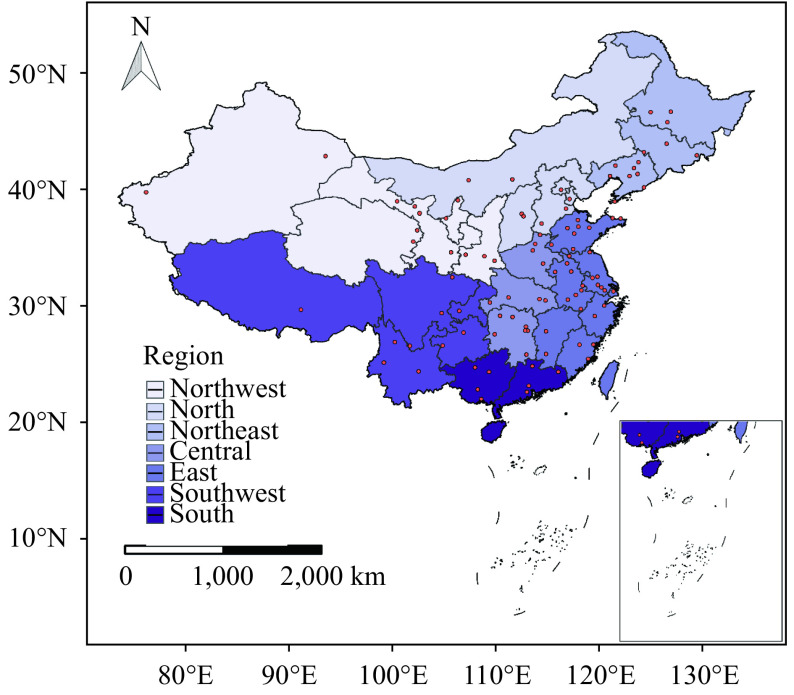
We initially obtained the mortality and YLL data for 100 representative cities from the China Cause of Death Reporting System (CDRS) between January 1, 2013 and December 31, 2016. After checking the daily mortality and YLLs distribution in each city, we finally selected 93 cities as our study sites. Based on the climate types and administrative regions (2), the study sites were divided into seven regions ( Supplementary Figure S1 available in http://weekly.chinacdc.cn/): north, northeast, northwest, east, central, south, and southwest. And according to initial diagnosis coded by 10th International Classification of Diseases (ICD-10), stroke was extracted from the system (I60-I64).
Figure S1.
The spatial distribution of 93 study cities from 30 provincial-level administrative divisions in China used to explore the associations between ambient temperature and years of life lost due to stroke.
We obtained daily mean temperature (°C) and relative humidity (%) of the selected cities from China Meteorological Data Sharing Service System ( http://data.cma.cn/). Also, daily concentrations of fine particulate matter with an aerodynamic diameter ≤2.5 μm (PM2.5), ozone (O3), sulfur dioxide (SO2), nitrogen dioxide (NO2) was collected from the National Real-time Publishing Platform for Air Quality ( http://106.37.208.233:20035).
We conducted a two-stage analysis to assess the associations between ambient temperature and YLL of stroke. At the first stage, we estimated city-specific temperature-YLL associations. Since the daily YLL obeys a normal distribution (3), we used a DLNM with a Gaussian link to evaluate the nonlinear and delayed effects of ambient temperature on YLLs due to stroke. To capture the nonlinear relationship between temperature and YLLs, we fitted the exposure-response relationship through a natural cubic B-spline function with three placed knots at 10th, 75th, and 90th percentiles of city-specific temperature distribution. A B-spline with three knots at equally-spaced log scales was applied for the space of lags, with a maximum set of 21 days in according with previous studies (4). Some confounding factors, including relative humidity, PM2.5, day of the week, public holidays, and long-term trend and seasonality were also controlled in the model. At the second stage, we obtained the regional and national effects within 21 lags between temperature and YLLs by using the best linear unbiased prediction (BLUP) approach. The minimum YLL temperature (MYLLT) corresponds to the minimum risk of YLL across the temperature range, based on the overall temperature-risk curve. On this basis, we further calculated the effects of extreme cold, mild cold, extreme heat, and mild heat on YLL risk and the attributable YLL fraction and attributable life expectancy loss per death. The detailed methods concerning the attributable burden analyses and sensitivity analyses were provided in the Supplementary Material (available in weekly.chinacdc.cn). We used R (Version 3.3.2, R Foundation for Statistical Computing, Vienna, Austria) to conduct all the analyses, “dlnm” package was used to fit DLNM model, and “mvmeta” package was used to conduct meta-analysis. P<0.05 (two-tailed) was considered statistically significant.
A total of 1,317,503 deaths due to stroke with 16,793,014 years of life lost were recorded in the 93 cities from January 1, 2013 to December 31, 2016. In Table 1, we observed that the daily death and YLL from stroke varied across study regions, with highest daily deaths and YLL in the northeast. The lowest daily stroke death counts and YLLs were found in the northwest, corresponding to 7 deaths and 97.7 years, respectively. In addition, the daily average temperature ranged from 8.6 °C in the northeast to 22.0 °C in the south.
Table 1. Summary statistics for daily deaths, years of life lost from stroke and ambient temperature in in seven regions of China, 2013–2016.
| Variables | Northwest | North | Northeast | East | Central | Southwest | South | Nationwide |
| Abbreviations: YLL=years of life lost; SD=standard deviation. | ||||||||
| Daily YLL of stroke | ||||||||
| Mean | 97.7 | 158 | 218 | 153 | 145 | 172 | 114 | 155 |
| SD | 111 | 122 | 160 | 128 | 117 | 230 | 75 | 143 |
| Minimum | 2.9 | 2.9 | 2.4 | 2.9 | 2.4 | 2.4 | 2.9 | 2.4 |
| 25th percentile | 22.4 | 62.9 | 108 | 58.6 | 71.5 | 46.8 | 55 | 59.1 |
| Median | 50.9 | 119 | 168 | 213 | 121 | 92.1 | 102 | 116 |
| 75th percentile | 129 | 230 | 277 | 121 | 184 | 150 | 160 | 202 |
| Maximum | 697 | 736 | 1,070 | 1,180 | 1,530 | 1,490 | 540 | 1,530 |
| Daily mortality of stroke | ||||||||
| Mean | 7 | 14 | 15 | 14 | 12 | 13.6 | 9 | 12 |
| SD | 8 | 11 | 11 | 11 | 9 | 18.9 | 6 | 11 |
| Minimum | 1 | 1 | 1 | 1 | 1 | 1 | 1 | 1 |
| 25th percentile | 2 | 5 | 8 | 5 | 6 | 4 | 4 | 5 |
| Median | 4 | 10 | 12 | 10 | 10 | 7 | 8 | 9 |
| 75th percentile | 9 | 19 | 19 | 19 | 14 | 11 | 13 | 16 |
| Maximum | 91 | 95 | 70 | 95 | 112 | 136 | 37 | 136 |
| Daily temperature (°C) | ||||||||
| Mean | 11.5 | 12.4 | 8.6 | 16.2 | 17.3 | 16.9 | 22.0 | 15.0 |
| SD | 10.7 | 11.2 | 13.2 | 9.4 | 8.8 | 7.2 | 6.6 | 10.6 |
| Minimum | −22.4 | −23.9 | −26.4 | −20.4 | −9.5 | −8.1 | 1.7 | −26.4 |
| 25th percentile | 2.9 | 2.3 | 2.5 | 8.4 | 9.8 | 11.7 | 16.8 | 7.6 |
| Median | 12.7 | 14 | 10.4 | 17.5 | 18.4 | 17.5 | 23.8 | 16.8 |
| 75th percentile | 20.3 | 22.3 | 20.6 | 24.0 | 24.6 | 22.2 | 27.5 | 23.5 |
| Maximum | 35.1 | 33.4 | 30.8 | 36.5 | 35.8 | 36.2 | 33.5 | 36.5 |
We observed the optimum temperature that caused the lowest YLL risk ranged from 16.7 °C in central region to 28.7 °C in the south region in Table 2. In general, the estimated effects of cold weather were stronger than that of high temperature. Specifically, extremely cold weather was significantly associated with YLLs due to stroke, with the strongest magnitude of effects in the northeast, corresponding to 53.73 (95% CI: 8.91, 98.55) years of life lost relative to the reference temperature.
Table 2. Estimated cumulative effects (lag0-21) on YLL under different patterns of temperature relative to the YLL at the reference temperature.
| Variables | Overall YLL | OT (°C) |
Extreme cold *
(years, 95% CI) |
Mild cold *
(years, 95% CI) |
Mild heat *
(years, 95% CI) |
Extreme heat *
(years, 95% CI) |
| Abbreviations: YLL=years of life lost; OT=optimum temperature. The reference temperature was set at the temperature with lowest YLL.
* Extreme cold, mild cold, extreme hot, and mild hot temperature were defined as 2.5th, 25th, 97.5th and 75th percentile of temperature distribution, respectively, compared with the reference temperature (minimum YLL temperature). | ||||||
| Overall region | 16,793,014.0 | 25.6 | 19.77 (11.16, 28.40) | 15.34 (7.77, 22.91) | 2.99 (0.49, 5.49) | 5.47 (2.57, 8.37) |
| Northeast | 3,562,080.8 | 23.2 | 53.73 (8.91, 98.55) | 30.15 (−5.48, 65.77) | 23.96 (4.88, 43.04) | 21.16 (0.45, 41.88) |
| Northwest | 979,861.7 | 17.0 | 12.51 (−22.04, 47.05) | 14.57 (−18.83, 47.97) | 1.13 (−17.55, 19.80) | 10.53 (−5.84, 26.90) |
| North | 1,573,462.6 | 24.9 | 41.67 (3.70, 79.64) | 46.61 (7.83, 85.39) | 11.95 (−4.68, 28.) | 11.39 (−0.07, 22.85) |
| Central | 2,380,406.4 | 16.7 | 22.28 (−16.52, 61.07) | 15.58 (−17.04, 48.20) | 0.01 (−0.56, 0.59) | 17.09 (−2.79, 36.97) |
| East | 5,413,438.8 | 25.2 | 21.80 (8.38, 35.23) | 7.38 (−5.65, 20.41) | 1.69 (−3.35, 6.72) | 18.90 (9.89, 27.90) |
| Southwest | 1,786,702.7 | 27.7 | 54.18 (9.90, 29.19) | 16.54 (7.86, 25.21) | 3.34 (0.01, 6.68) | 4.41 (2.31, 6.51) |
| South | 1,097,060.8 | 28.7 | 84.98 (22.29, 147.68) | 32.24 (−1.88, 66.37) | 3.99 (−11.59, 19.57) | 2.24 (−8.18, 12.66) |
| Subtype | ||||||
| Hemorrhagic stroke | 9,852,444.0 | 28.2 | 11.62 (4.51, 18.73) | 10.53 (4.08, 16.97) | 3.13 (0.13, 6.12) | 0.36 (−0.60, 1.32) |
| Ischemic stroke | 6,028,666.0 | 22.4 | 7.55 (3.50, 11.60) | 4.63 (1.18, 8.08) | 0.03 (−0.20, 0.25) | 6.33 (3.64, 9.01) |
| Sex | ||||||
| Male | 10,033,788.0 | 26.0 | 13.05 (6.87, 19.24) | 10.57 (5.32, 15.81) | 2.09 (−0.02, 4.21) | 2.43 (0.71, 4.17) |
| Female | 6,759,226.0 | 25.1 | 5.53 (0.92, 10.15) | 4.19 (0.04, 8.34) | 0.84 (−0.53, 2.21) | 2.45 (0.76, 4.13) |
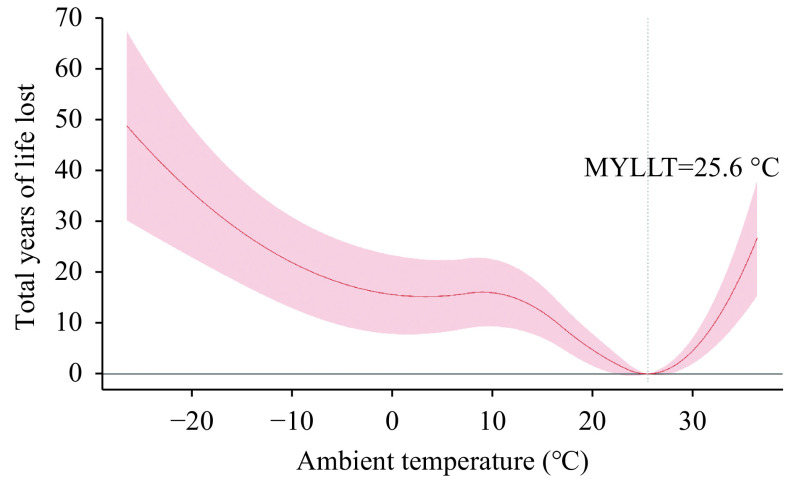
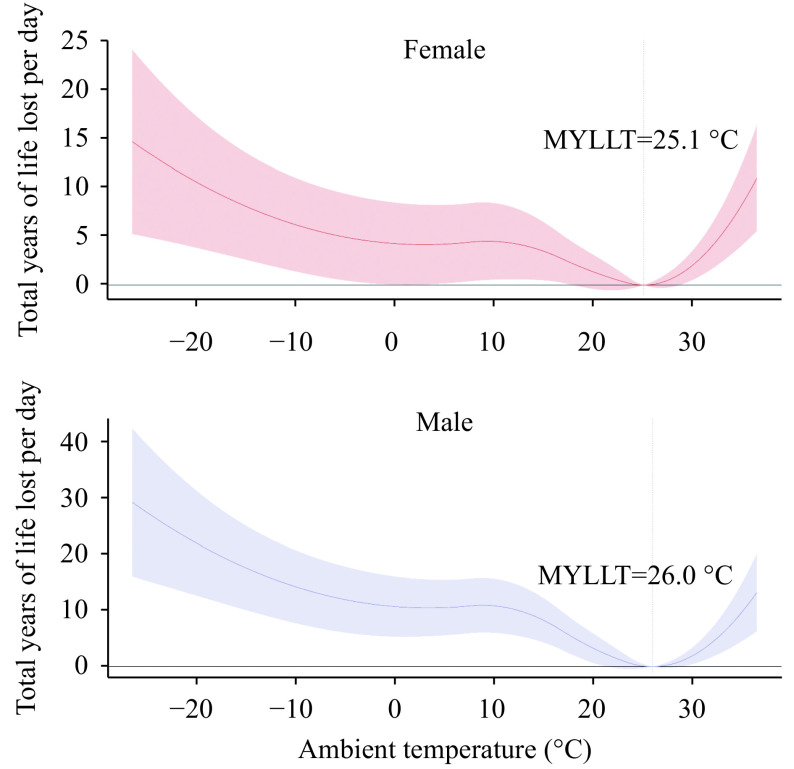
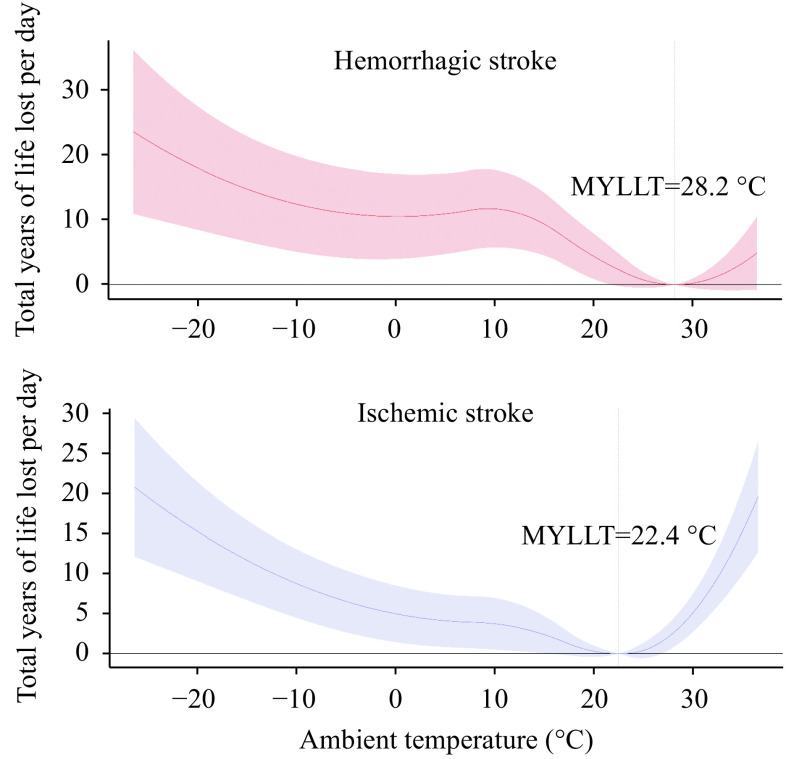
Figure 1 show the BLUP on exposure-response curves of the cumulative effects of temperature on YLLs from stroke at the national level in China, 2013–2016. We observed an inverse “J” shaped association, with increasing YLLs for moving up and down from the minimum YLL temperature. Furthermore, we found consistent curves stratified by sex, regions, and subtypes of stroke ( Supplementary Figures S2–S4 available in http://weekly.chinacdc.cn/), particularly in the terms of the general shape.
Figure 1.
Exposure-response curve of the cumulative effects of temperature on years of life lost from stroke at the national level in China (93 cities), 2013–2016.
Abbreviation: MYLLT=The minimum years of life lost temperature.
Figure S2.
The associations between ambient temperature and years of life lost due to mortality from stroke by sex in China, 2013–2016.
Abbreviation: MYLLT=The minimum years of life lost temperature.
Figure S3.
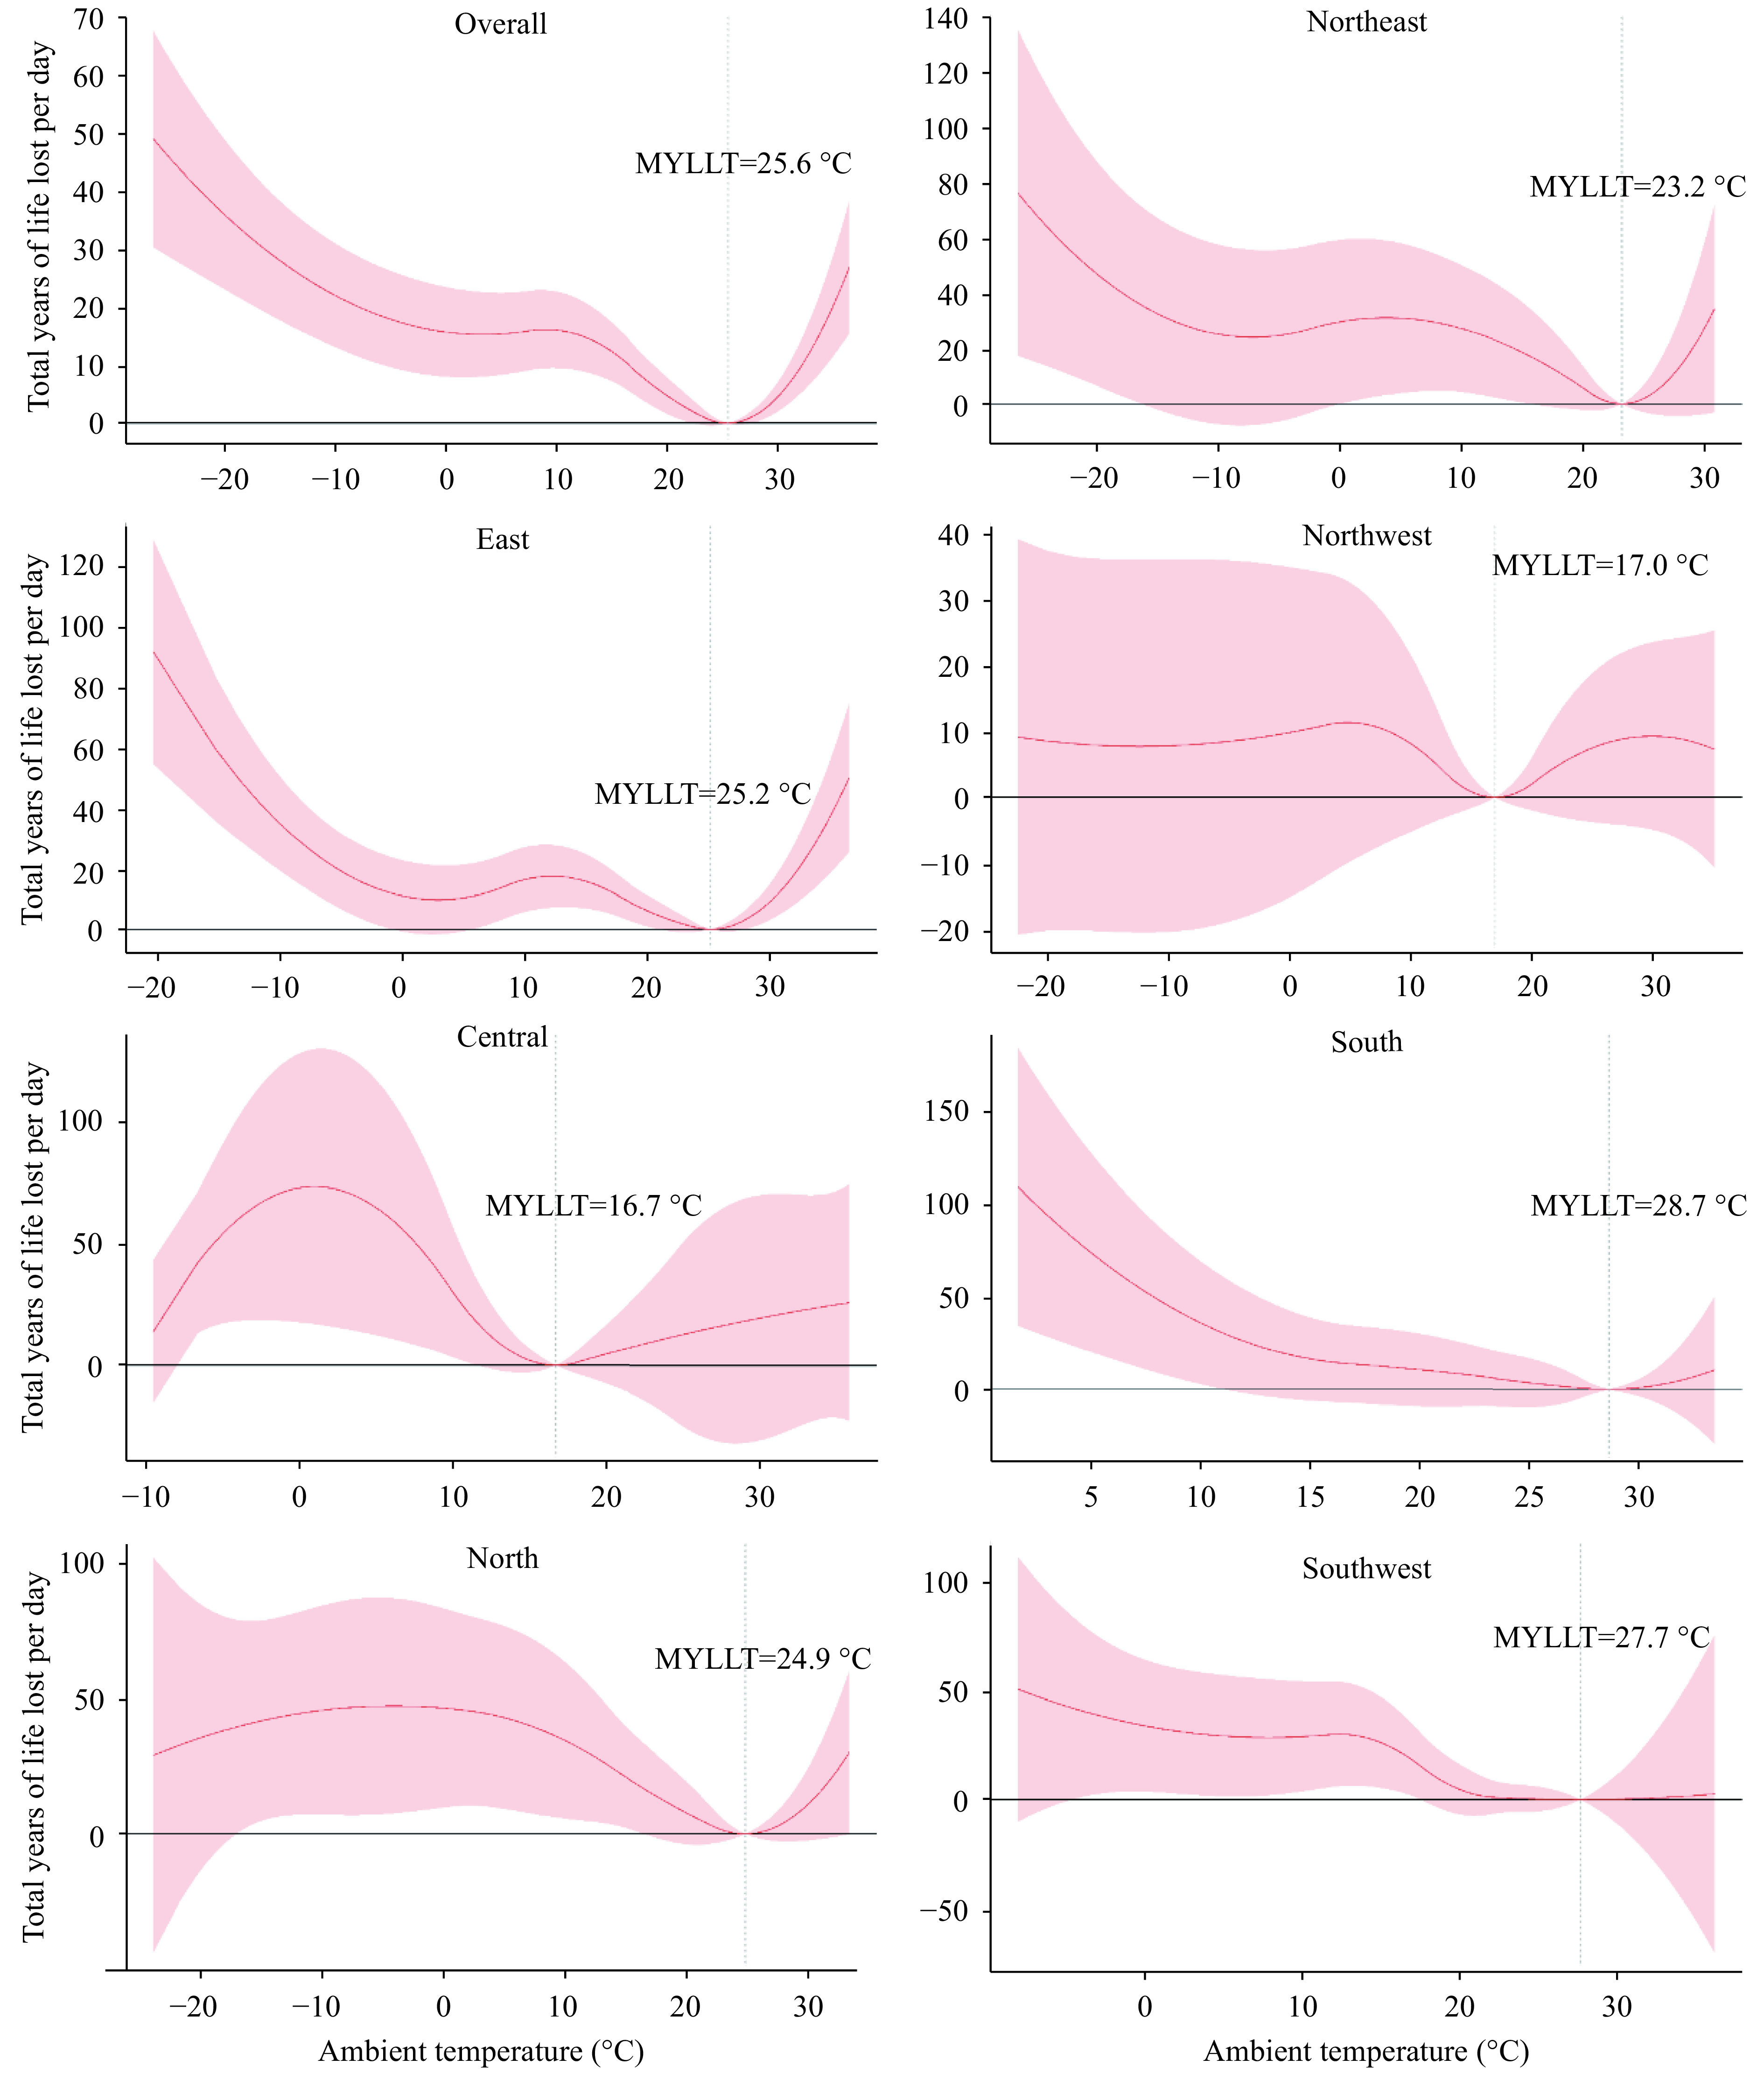
The associations between ambient temperature and years of life lost due to mortality from stroke by regions in China, 2013–2016.
Abbreviations: MYLLT=The minimum years of life lost temperature.
Figure S4.
The associations between ambient temperature and years of life lost due to mortality from hemorrhagic stroke and ischemic stroke in China, 2013–2016.
Abbreviation: MYLLT=The minimum years of life lost temperature.
In attribution burden analysis (Supplementary Table S1 available in http://weekly.chinacdc.cn/), we observed that at the national level, the total fraction of YLLs by non-optimum temperature was 10.91% (95% CI: 5.67, 16.15), in which cold temperature (10.84%, 95% CI: 5.69, 15.99) accounted for a significantly higher contribution. The national-pooled life expectancy loss per death due to non-optimum temperature was 1.39 years (95% CI: 0.72, 2.06), with a significantly higher contribution of cold weather (1.38, 95% CI: 0.72, 2.04) than that of hot weather (0.01, 95% CI: −0.00, 0.02). The life expectancy loss caused by cold temperature was higher than that of hot temperature in all the regions, and the highest estimate occurred in the north region (2.19, 95% CI: 0.31, 4.07).
Table S1. The fractions of years of life lost and life expectancy loss caused by hot, cold and overall temperature across the seven regions.
| Region | Attributable fraction (%, 95% CI) | Attributable life expectancy loss (years, 95% CI) | |||||
| Hot | Cold | Non-optimum | Hot | Cold | Non-optimum | ||
| * The estimated value is statistically significant. | |||||||
| North | 0.10 (−0.14, 0.35) | 16.85 (2.36, 31.35) * | 16.96 (2.21, 31.70) * | 0.01 (−0.02, 0.05) | 2.19 (0.31, 4.07) * | 2.20 (0.29, 4.11) * | |
| Northeast | 0.16 (−0.16, 0.47) | 8.59 (−0.70, 17.87) | 8.75 (−0.85, 18.34) | 0.02 (−0.02, 0.07) | 1.26 (−0.10, 2.61) | 1.28 (−0.12, 2.68) | |
| Northwest | 1.72 (−1.07, 4.50) | 5.79 (−8.56, 20.14) | 7.51 (−9.63, 24.64) | 0.24 (−0.15, 0.62) | 0.80 (−1.18, 2.77) | 1.03 (−1.32, 3.38) | |
| East | 0.55 (0.15, 0.94) * | 4.88 (0.35, 9.40) * | 5.42 (0.50, 10.35) * | 0.06 (0.02, 0.11) * | 0.56 (0.04, 1.08) * | 0.62 (0.06, 1.19) * | |
| Central | 2.40 (−8.21, 13.02) | 8.30 (−2.51, 19.12) | 10.71 (−10.72, 32.14) | 0.31 (−1.07, 1.69) | 1.08 (−0.33, 2.48) | 1.39 (−1.39, 4.17) | |
| South | 0.07 (−0.37, 0.50) | 8.68 (−4.60, 21.97) | 8.75 (−4.97, 22.47) | 0.01 (−0.05, 0.06) | 1.08 (−0.57, 2.73) | 1.09 (−0.62, 2.79) | |
| Southwest | 9.36×10⁻⁵ (−2.89×10⁻³, 3.08×10⁻³) | 12.91 (1.10, 24.71) * | 12.91 (1.10, 24.71) * | 1.19×10⁻⁵ (−3.69×10⁻⁴, 3.92×10⁻⁴) | 1.64 (0.14, 3.15) * | 1.64 (0.14, 3.15) * | |
| Nationwide | 0.07 (−0.02, 0.16) | 10.84 (5.69, 15.99) * | 10.91 (5.67, 16.15) * | 1.47×10⁻² (3.60×10⁻³, 2.58×10⁻²) | 1.38 (0.72, 2.04) * | 1.39 (0.72, 2.06) * | |
DISCUSSION
Our present study explored the associations between ambient temperature and daily YLL due to stroke in 93 Chinese cities. We found cold and hot weather were significantly associated with an increase in years of life lost from stroke and for different groups, with stronger effects in low temperature. The present study could provide ample evidence to planning and policy-making in stroke control and climate governance.
A large body of epidemiological studies have documented the link between temperature and mortality due to stroke and its subtypes, however the relevant research about association of temperature with YLL from stroke within China was still scarce. Previous studies have provided similar findings, applying the YLL as the outcome measurement. Luan et al. reported that both cold and hot temperature were significantly associated with increasing YLL of cardiovascular diseases in which the effects of low temperature took such a large share (5). A recent study conducted in three largest English cities found that there was an increased risk in YLL with the increment and decline of the temperature from the thresholds (6).
The non-linear relationships between temperature and YLLs from stroke that emphasized the adverse health effects of both low and high temperatures were found in present study. Furthermore, there was biologically plausible evidence for these associations. The effects induced by cold temperature were in association to increasing the level of inflammatory response, and oxidative stress in brain and variation of the blood pressure and autonomic nervous system (7-8). In addition, high outdoor temperature was associated with increasing cardiac output and heart rates, dehydration, hypotension, and vasodilatation, which would lead to microvascular thrombosis in brain and elevate the mortality of stroke (9). In addition, compared with the heat exposure, the effects from low temperatures on stroke tended to be stronger, which might be explained by the variation in autonomic nervous system and thermogenesis, and fluctuation in blood pressure in cold days (7).
We also found that the temperature-related effects could variy across geographical regions. For example, in south region, where the mean temperatures reached 8.4 °C or below (2.5th percentile of the temperature distribution in south region), we observed the strongest YLL (84.98, 95% CI: 22.29, 147.68) for extreme cold temperature, while in northwest region the corresponding number declined to be nonsignificant (12.51, 95% CI: –22.04, 47.05). The observed differences in the estimated effects of temperature across regions might be explained by the discrepancy in climate condition, population susceptibility, and socioeconomic status (10). In addition, central heating capacity might be another important region-level characteristic to explain the observed differences across different regions.
We further assess the attributable fraction of YLLs and life expectancy loss per death relative to the reference temperature at the regional and national level. The attributable burden analysis reported that the effects of non-optimum temperature constituted 10.91% of YLLs due to stroke and 1.39 years potential gain in life expectancy per death would achieve by attaining the optimum temperature rom the national perspective. As stroke was the leading cause of death with remarkably high prevalence in China, our study would provide guiding and fundamental advice to improve existing preventive strategies for stroke and reduce the ambient temperature-related burden.
This study was subject to at least some limitations. First, we used monitoring temperature data as the real exposure for the population due to the unavailability of the individual exposure, which may cause exposure misclassification. Second, this study was an ecological study in essence without adjustment for the unmeasurable individual-level covariates. Third, due to mortality data unavailability, the included cities were mainly distributed in the east and central regions but fewer in the northwest, which could lead to a low representativeness of the data and uncertainty to draw a nationwide conclusion. Finally, the coding errors and misclassification may inevitably occur in the nationwide registry-based YLL data, though this process was under strict quality control.
In summary, this nationwide analysis elaborated non-linear associations between ambient temperature and YLLs from stroke in China, with evident adverse health effects due to both cold and hot temperatures. Reducing exposure to ambient non-optimum temperature could lead to a substantial benefit in life expectancy. Our findings could help identify the vulnerable regions and populations that bore more serious temperature-related burdens and to guide the practical and effective measures for stroke control.
Conflicts of Interest: No conflicts of interest.
Funding Statement
The National Key R&D Program of China (2018YFA0606200), the National Natural Science Foundation of China (82041021), and Bill & Melinda Gates Foundation (INV-006371)
Contributor Information
Lijun Wang, Email: wanglijun@ncncd.chinacdc.cn.
Hualiang Lin, Email: linhualiang@mail.sysu.edu.cn.
References
- 1.Li GX, Guo Q, Liu Y, Li YX, Pan XC Projected temperature-related years of life lost from stroke due to global warming in a temperate climate city, Asia: disease burden caused by future climate change. Stroke. 2018;49(4):828–34. doi: 10.1161/strokeaha.117.020042. [DOI] [PubMed] [Google Scholar]
- 2.Luan GJ, Yin P, Wang LJ, Zhou MG The temperature–mortality relationship: an analysis from 31 Chinese provincial capital cities. Int J Environ Health Res. 2018;28(2):192–201. doi: 10.1080/09603123.2018.1453056. [DOI] [PubMed] [Google Scholar]
- 3.Qi JL, Ruan ZL, Qian ZM, Yin P, Yang Y, Acharya BK, et al Potential gains in life expectancy by attaining daily ambient fine particulate matter pollution standards in mainland China: a modeling study based on nationwide data. PLoS Med. 2020;17(1):e1003027. doi: 10.1371/journal.pmed.1003027. [DOI] [PMC free article] [PubMed] [Google Scholar]
- 4.Gasparrini A, Guo YM, Hashizume M, Lavigne E, Zanobetti A, Schwartz J, et al Mortality risk attributable to high and low ambient temperature: a multicountry observational study. Lancet. 2015;386(9991):369–75. doi: 10.1016/s0140-6736(14)62114-0. [DOI] [PMC free article] [PubMed] [Google Scholar]
- 5.Luan GJ, Yin P, Li TT, Wang LJ, Zhou MG The years of life lost on cardiovascular disease attributable to ambient temperature in China. Sci Rep. 2017;7(1):13531. doi: 10.1038/s41598-017-13225-2. [DOI] [PMC free article] [PubMed] [Google Scholar]
- 6.Arbuthnott K, Hajat S, Heaviside C, Vardoulakis S Years of life lost and mortality due to heat and cold in the three largest English cities. Environ Int. 2020;144:105966. doi: 10.1016/j.envint.2020.105966. [DOI] [PubMed] [Google Scholar]
- 7.Cai J, Meng X, Wang CC, Chen RJ, Zhou J, Xu XH, et al The cold effects on circulatory inflammation, thrombosis and vasoconstriction in type 2 diabetic patients. Sci Total Environ. 2016;568:271–7. doi: 10.1016/j.scitotenv.2016.06.030. [DOI] [PubMed] [Google Scholar]
- 8.Croughwell N, Smith LR, Quill T, Newman M, Greeley W, Kern F, et al The effect of temperature on cerebral metabolism and blood flow in adults during cardiopulmonary bypass. J Thorac Cardiovasc Surg. 1992;103(3):549–54. doi: 10.1016/S0022-5223(19)34997-9. [DOI] [PubMed] [Google Scholar]
- 9.Epstein Y, Yanovich R Heatstroke. N Engl J Med. 2019;380(25):2449–59. doi: 10.1056/NEJMra1810762. [DOI] [PubMed] [Google Scholar]
- 10.Guo YM, Gasparrini A, Armstrong B, Li SS, Tawatsupa B, Tobias A, et al Global variation in the effects of ambient temperature on mortality: a systematic evaluation. Epidemiology. 2014;25(6):781–9. doi: 10.1097/EDE.0000000000000165. [DOI] [PMC free article] [PubMed] [Google Scholar]


