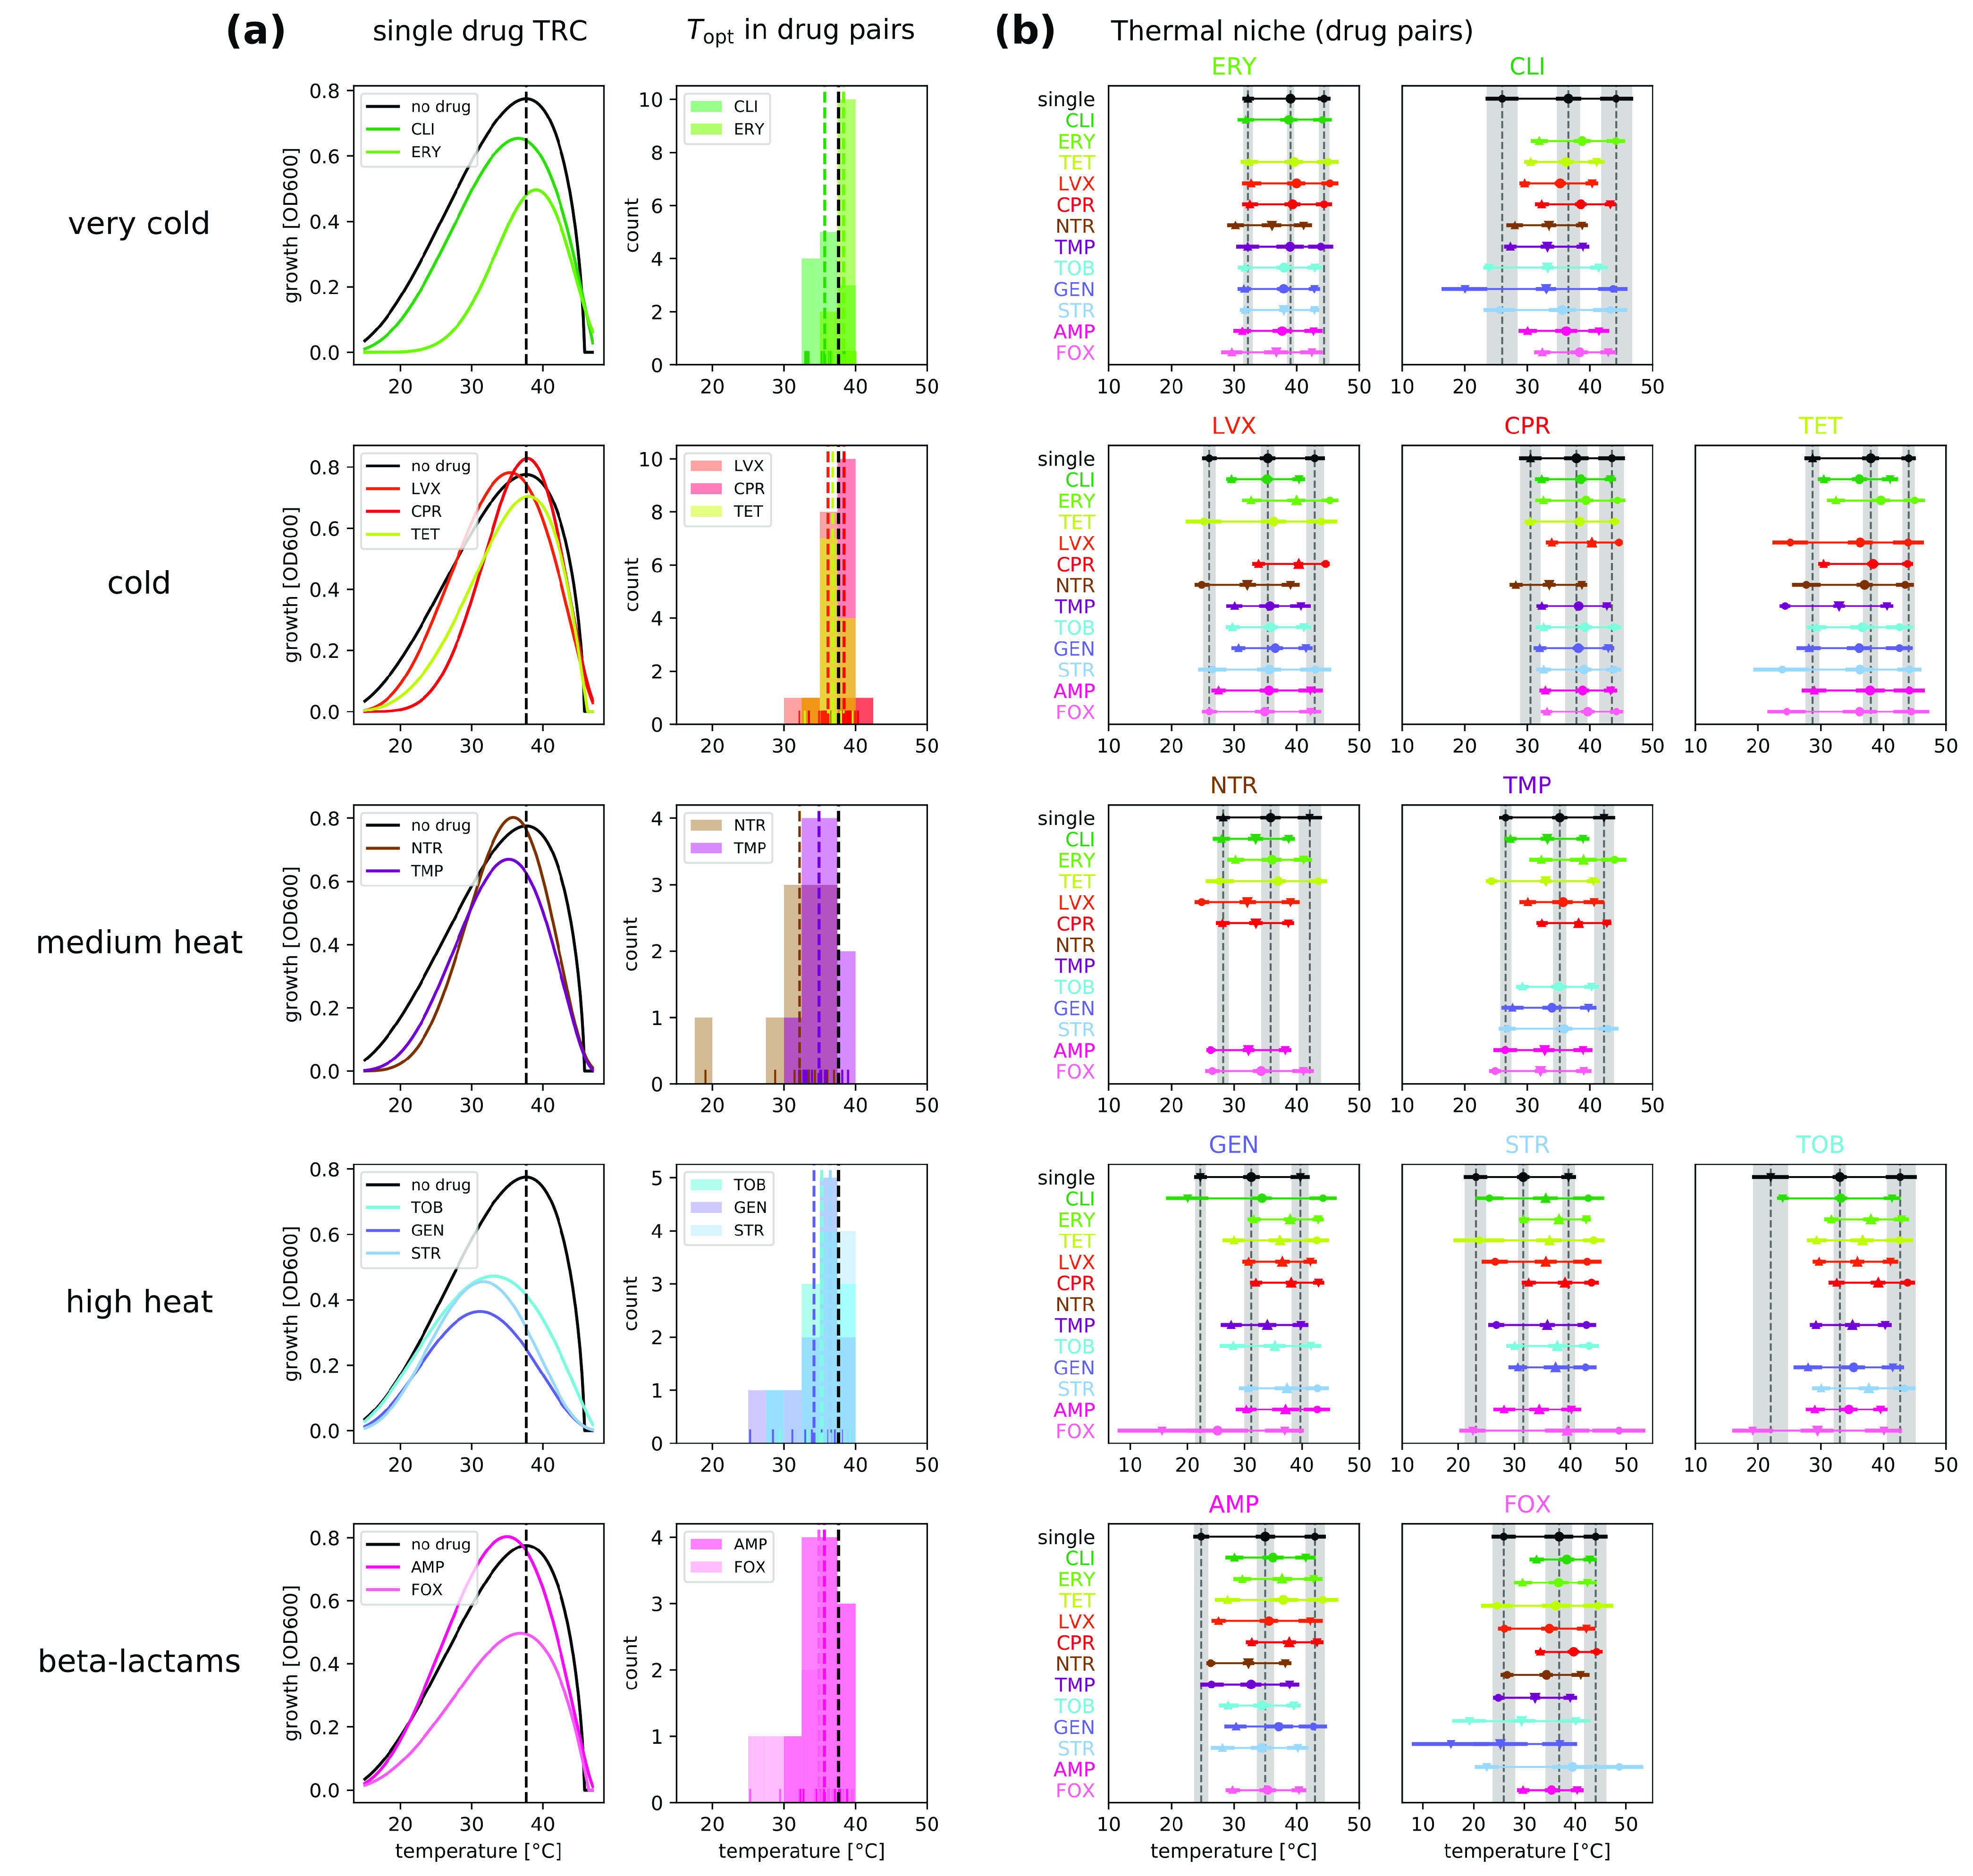
FIG 2.

Physiological effects of antibiotics predict the direction of shifts in the optimal temperature. (a) (Left) The fitted temperature response curve (TRC) in the presence of single antibiotics is compared to the unstressed growth condition. Drugs are grouped according to the similarity of their effects to temperature (34), as shown in the left of the plots, except beta-lactams, which did not show similarity to temperature. (Right) Histogram of shifts in the optimal temperature under all pairwise drug combinations involving the drugs in the group. The individual estimates are shown as short lines in the bottom. The mean of the optimal temperature estimates involving each drug (including combinations) is shown as a dashed colored line. The unstressed optimal temperature is shown as a black dashed line in both sets of plots. For both single drugs and combinations, the direction of the optimal temperature shifts depends on whether the drug is similar to cold or to heat. (b) Optimal growth temperature and temperature niche observed under each antibiotic combination used in this study. The first drug in the combination is shown at the top of the plot. The second drug is shown on the y axis using its assigned line color. The single-drug conditions are shown with shaded 95% credible intervals to facilitate comparisons and the point estimates are marked as in Fig. 1c. Conditions under which the maximum growth was too small to estimate parameters reliably were removed.
