

Abstract
Background.
Several observational studies have shown decreases in measured influenza vaccine effectiveness (mVE) during influenza seasons. One study found decreases of 6–11%/month during the 2011–2012 to 2014–2015 seasons. These findings could indicate waning immunity but could also occur if vaccine effectiveness is stable and vaccine provides partial protection in all vaccinees (“leaky”) rather than complete protection in a subset of vaccinees. Since it is unknown whether influenza vaccine is leaky, we simulated the 2011–2012 to 2014–2015 influenza seasons to estimate the potential contribution of leaky vaccine effect to the observed decline in mVE.
Methods.
We used available data to estimate daily numbers of vaccinations and infections with A/H1N1, A/H3N2, and B viruses. We assumed that vaccine effect was leaky, calculated mVE as 1 minus the Mantel-Haenszel relative risk of vaccine on incident cases, and determined the mean mVE change per 30 days since vaccination. Because change in mVE was highly dependent on infection rates, we performed simulations using low (15%) and high (31%) total (including symptomatic and asymptomatic) seasonal infection rates.
Results.
For the low infection rate, decreases (absolute) in mVE per 30 days after vaccination were 2% for A/H1N1 and 1% for A/H3N2and B viruses. For the high infection rate, decreases were 5% for A/H1N1, 4% for A/H3, and 3% for B viruses.
Conclusions.
The leaky vaccine bias could account for some, but probably not all, of the observed intraseasonal decreases in mVE. These results underscore the need for strategies to deal with intraseasonal vaccine effectiveness decline.
Keywords: influenza, statistical estimation, vaccine effectiveness, leaky vaccine, vaccine mechanism
Several observational studies have found a decline in measured influenza vaccine effectiveness (mVE) during influenza seasons [1–4]. In part because protective antibody levels decline over time, it is often assumed that, in the absence of antigenic drift, decreasing mVE is related to waning immunity. However, even if vaccine effectiveness (VE) is stable, mVE can decrease if (1) the vaccine effect is “leaky” (ie, provides partial protection in all vaccinees rather than complete protection in some vaccines) and (2) mVE is estimated from risk measures (eg, relative risk, odds ratio) that include prior cases in risk denominators [5–10]. Delaying vaccination to be closer to the influenza season may be warranted if observed declines in mVE are due to waning immunity [11–13], but would not be helpful if they are due to leaky vaccine effect. Thus, assessing the potential contribution of leaky vaccine effect to declines in mVE has important policy implications.
Vaccine effectiveness has different meanings depending on the assumed mechanism of vaccine effect. Figure 1 shows 3 possible effect mechanisms—all assume a VE of 50%. If vaccine protection is “all-or-none” (Figure 1A), half of those vaccinated have complete protection and the others have none. For a leaky vaccine (Figure 1B), all vaccinees’ risk of infection is reduced by 50% per exposure. For the third option (Figure 1C), vaccine provides variable degrees of risk reduction—in this example following a B distribution. A simple example (Figure 2) assumes 50% VE and 50% exposed per time period. For all-or-none vaccine, at time 0 there are 1000 susceptible unvaccinated persons and 500 immune and 500 susceptible vaccinees; in each time period, one-half of susceptibles become cases and mVE remains at 50%. For leaky vaccines, all vaccinees are at risk but infection risk is reduced by half to 25% per time period and mVE declines to −13% at time 3; infections in vaccinees number 250 at time 0, 188 at time 1, and 141 at time 3 (vs 250, 125, and 63 among all-or-none vaccines). Cumulative cases are higher for leaky than all-or-none vaccine (579 vs 438).
Figure 1.

Distributions of vaccine protection for 3 mechanisms of vaccine effect that yield vaccine effectiveness of 50%. A, All-or-none: 50% of vaccinees are completely susceptible (no reduction in risk of infection per exposure) and 50% completely protected (0% risk of infection per exposure). B, Leaky: All vaccinees have a 50% reduction in risk per exposure. C, Variable protection, here represented with a B distribution: Vaccinees have a reduction in risk per exposure ranging from >0% to <100% (mean, 50%).
Figure 2.

Example calculations for all-or-none versus leaky vaccine mechanisms. Rectangles denote noncases; ovals denote incident cases; numbers denote numbers of people. Vaccine effectiveness is 50%: 50% are exposed per time period; all exposed susceptibles are infected; and those previously infected are immune. For all-or-none vaccinees, 50% are susceptible, and 50% of these are infected per time period. Among leaky vaccinees, all are 50% susceptible, and 25% (= 50% susceptible × 50% exposed) are infected per time period, resulting in 250 (1000 × 0.25) infections at time 0, 188 (750 × 0.25) infections at time 1, and 141 (563 × 0.25) infections at time 3. Abbreviations: mVE, measured vaccine effectiveness; Risku, risk among unvaccinated; Riskv, risk among vaccinated; T, time period.
Since it is unknown whether influenza vaccine is leaky, we estimated the potential contribution to observed decreases in mVE that could occur if this vaccine were leaky. We created a simulation model of vaccine effect and infection specific to influenza and identified variables affecting changes in mVE during an influenza season. We then compared the changes in mVE observed in a study of the 2011–2012 to 2014–2015 seasons [1] with changes that would be expected if vaccine effect were leaky under a range of assumptions.
METHODS
Input Data
We simulated data for 4 seasons (2011–2012 to 2014–2015) and 4 age groups (9–17 years, 18–49 years, 50–64 years, and ≥65 years). We started with numbers of symptomatic cases per month estimated from hospitalization data as previously described [14] (Table 1) and smoothed the data using the locally weighted scatterplot smoother (LOESS) procedure to simulate cases per day (Supplementary Material 1). Since the proportion of influenza infections that are symptomatic has been estimated to be in the range of 25–50% (Supplementary Material 2) [22–27], we multiplied symptomatic infections by 2–4 to estimate total infections (symptomatic and asymptomatic). This resulted in total infection rates of 15–31% per season, which is in the range reported in the literature [23, 24, 28–30]. We used a similar procedure for vaccinations, starting with numbers of vaccinations per month obtained from survey data [15] and producing estimated numbers of vaccinations per day based on smoothed curves.
Table 1.
Input Values and Measured Vaccine Effectiveness by Season, Age, and Influenza Virus Type/Subtype, 2011–2012 to 2014–2015
| Influenza Season and Age Group (years) | Symptomatic Infection,a % | Vaccinated, % | Vaccine Effectiveness, % | Proportion of Cases by Virus Type/Subtype, % | Total Infection,b % | Simulated mVE Change per 30 Days,c % | ||||||
|---|---|---|---|---|---|---|---|---|---|---|---|---|
| A/H1N1 | A/H3N2 | B | A/H1N1 | A/H3N2 | B | A/H1N1 | A/H3N2 | B | ||||
| 2011–2012 | ||||||||||||
| 9–17 | 3.7 | 45.9 | 65.0 | 39.0 | 59.0 | 22.3 | 62.3 | 15.4 | 14.6 | −0.5 | −1.0 | −0.7 |
| 18–49 | 2.6 | 28.4 | 65.0 | 39.0 | 59.0 | 26.4 | 64.8 | 8.8 | 10.1 | −0.3 | −0.7 | −0.5 |
| 50–64 | 3.2 | 42.6 | 65.0 | 39.0 | 59.0 | 26.5 | 64.4 | 9.1 | 12.6 | −0.5 | −1.1 | −0.7 |
| ≥65 | 2.3 | 64.6 | 65.0 | 39.0 | 59.0 | 5.3 | 89.6 | 5.1 | 9.2 | −0.3 | −0.7 | −0.5 |
| All | … | … | … | … | … | … | … | … | 11.2 | −0.5 | −0.9 | −0.6 |
| 2012–2013 | ||||||||||||
| 9–17 | 12.4 | 52.1 | 59.5 | 24.0 | 59.5 | 3.5 | 56.9 | 39.6 | 48.4 | −3.8 | −6.5 | −3.8 |
| 18–49 | 8.4 | 30.7 | 59.0 | 34.0 | 62.9 | 6.2 | 72.1 | 21.7 | 32.9 | −2.1 | −3.4 | −2.0 |
| 50–64 | 12.9 | 44.9 | 64.5 | 52.0 | 62.9 | 6.1 | 72.9 | 21.0 | 50.2 | −5.8 | −8.4 | −5.9 |
| ≥65 | 9.7 | 66.0 | 62.0 | 11.0 | 62.9 | 0.9 | 87.9 | 11.2 | 37.9 | −1.2 | −2.8 | −1.3 |
| All | … | … | … | … | … | … | … | … | 39.7 | −3.9 | −5.9 | −3.5 |
| 2013–2014 | ||||||||||||
| 9–17 | 7.4 | 55.0 | 54.0 | 23.3 | 64.8 | 77.6 | 10.0 | 12.3 | 28.9 | −2.7 | −4.7 | −1.8 |
| 18–49 | 9.6 | 32.1 | 53.0 | 24.3 | 58.0 | 87.4 | 5.4 | 7.2 | 37.7 | −4.0 | −6.1 | −2.9 |
| 50–64 | 13.7 | 45.2 | 64.0 | 36.3 | 48.3 | 85.6 | 5.9 | 8.5 | 53.8 | −8.6 | −12.6 | −7.2 |
| ≥65 | 3.8 | 64.7 | 59.0 | 21.7 | 65.0 | 67.5 | 20.3 | 12.2 | 14.9 | −1.3 | −2.5 | −0.9 |
| All | … | … | … | … | … | … | … | … | 36.4 | −5.3 | −6.9 | −3.4 |
| 2014–2015 | ||||||||||||
| 9–17 | 11.9 | 55.8 | 59.5 | 7.0 | 77.0 | 0.2 | 80.8 | 19.0 | 46.2 | −2.6 | −3.2 | −1.1 |
| 18–49 | 6.3 | 33.4 | 59.0 | 0.0 | 53.0 | 0.7 | 80.9 | 18.5 | 24.9 | −0.3 | −0.5 | −0.4 |
| 50–64 | 11.6 | 46.8 | 64.5 | 18.0 | 24.0 | 0.6 | 80.2 | 19.1 | 45.6 | −1.5 | −3.4 | −2.8 |
| ≥65 | 10.1 | 66.0 | 62.0 | 15.0 | 74.0 | 0.1 | 90.4 | 9.6 | 39.5 | −1.8 | −3.1 | −1.0 |
| All | … | … | … | … | … | … | … | … | 34.8 | −1.3 | −2.7 | −1.5 |
| All | … | … | … | … | … | … | … | … | 30.6 | −4.7 | −4.1 | −2.7 |
Data sources: Infection rate, Influenza Hospitalization Surveillance Network (FluSurv-NET) used to estimate symptomatic infections in outpatients [14]; vaccination rate, yearly surveys of self-reported vaccination [15]; vaccine effectiveness, US Influenza Vaccine Effectiveness Network (Supplementary Material 6) [16–19]; proportion of cases by virus type/subtype, US Influenza Surveillance System [20].
Abbreviation: mVE, measured vaccine effectiveness.
Cumulative percentage with symptomatic infection by end of season.
For simulation, 25% of infections assumed to be symptomatic; thus, total infection rate is 4 times the symptomatic rate.
Absolute change calculated assuming 25% of infections are symptomatic, leaky vaccine mechanism, no reinfections, and POLYMOD exposure heterogeneity [21].
Simulation Model
We created a model with 3 viruses (A/H1N1, A/H3N2, and B) and 3 mechanisms of vaccine effect (Figure 1). Unvaccinated persons were considered completely susceptible to infection. Detailed specifications for the model are shown in Supplementary Material 3 and the SAS program (SAS Institute, Cary, NC) in Supplementary Material 4. In brief, we created a dataset with 1 record for each combination of never vaccinated or day vaccinated, number of contacts per day (see next paragraph), and immune level 14 days after vaccination, distributing 1 million susceptible persons among these records. For each of 273 days during the season, we assigned cases to the dataset records in proportion to the number of persons remaining uninfected, contacts per day, and immune level if vaccinated.
Heterogeneity of exposure to infection, occurring because people have widely varying numbers of contacts with other persons per day, is known to affect mVE [6, 9]. To simulate this effect, we used 2 different patterns of heterogeneous exposure based on data from 2 studies that counted contacts per person per day (Supplementary Material 5) [21, 31]. We assigned numbers of contacts per day to appropriate proportions of people in our simulated dataset.
Calculation of mVE
We distinguished between “VE” (the parameter describing vaccine-induced reduction in infection risk) and “mVE” (vaccine effect measured using a specified method at a specified time during the season). Calculations of mVE were done separately for each virus (A/H1N1, A/H3N2, and B). For each day, “vaccinated” included those who had received vaccine and “unvaccinated” included those who had not (some might receive vaccine on a later day). “Cases” included those who became infected on that day and “noncases” included those who did not (some were infected either before or after that day). To calculate changes in mVE over time, we determined deciles of case occurrence by day since vaccination. For each decile, we calculated the Mantel-Haenszel relative risk of vaccine in 2-by-2 tables conditioned on calendar day, and either stratified by or conditioned on season and age. For a decile d1–d2 days (d1 and d2 represent day numbers, such as 100–125 d) after vaccination, we compared risk among those vaccinated d1–d2 days prior with those not yet vaccinated. We calculated mVE as 1 minus the relative risk. To account for the vaccine lag effect, we excluded those vaccinated in the prior 13 days. We calculated the change in mVE per 30 days using a linear regression model with 1 record for each decile, outcome variable mVE, and explanatory variable mean day since vaccination in the decile. We multiplied the regression coefficient by 30 to obtain mean mVE change per 30 days.
Preliminary Simulation With Single Virus, Season, and Age Group
To understand the separate effects of key parameters, we used a typical distribution of cases and vaccinations per day taken from the 50- to 64-year-old age group during the 2013–2014 season and assumed that all cases were caused by a single virus. We first performed a baseline simulation and then additional simulations varying parameters. The baseline (range) parameter values were arbitrarily chosen to illustrate the effects over a wide range: cumulative seasonal infection rate of 25% (12.5–50%), vaccine coverage of 50% (20–80%), and VE of 50% (20–80%). We performed calculations based on homogeneous exposure (all persons have the same number of contacts per day), for the 2 patterns of heterogeneous exposure and for the all-or-none, leaky, and variable vaccine mechanisms.
Simulation of 2011–2012 to 2014–2015 Influenza Seasons
For comparison with a prior article [1], we estimated the magnitude of mVE decline potentially attributable to leaky vaccine effect during the 2011–2012 to 2014–2015 seasons. We partitioned the number of cases per day into 3 virus categories (A/H1N1, A/H3N2, and B) using virus/season/week/age-group–specific proportions based on virologic surveillance data (Table 1) [20].
We used virus/age-group–specific mean seasonal mVE values adapted from published studies (Table 1, Supplementary Material 6) [16–19]. Published VE values represent the mean of mVE over an influenza season. We used an iterative process to estimate VE values at season start that would result in the mean seasonal VE given that VE could change during the season due to leaky or variable vaccine effects (Supplementary Material 3, step 22). We performed simulations for each of the 16 season/age-group combinations and combined the results weighted by US population.
We first performed simulations assuming no reinfections in a given season. However, the leaky vaccine effect occurs because cases are removed from the susceptible pool, and therefore reinfections during a season will influence results. We therefore repeated calculations allowing reinfections with a different virus—that is, a person initially infected with an A/H3N2 virus could be reinfected with an A/H1N1 or B virus but not an A/H3N2 virus. While there may be nonspecific inhibition of reinfection for days or weeks following a first infection [32, 33], we did not account for this effect, reasoning that our results spanned the range of possibilities (ie, no reinfections vs immediate reinfections). We calculated the proportion of mVE change potentially attributable to the leaky or variable mechanism by dividing mVE changes found in simulations by the observed declines in mVE in a prior article [1]. Since confidence limits for observed mVE decline were not reported in the prior article, we calculated them using bootstrap methods.
Calculations were done using SAS version 9.4 (SAS Institute). Data for this study were received in aggregate form without personal identifiers from publicly available sources, pre-existing research projects with human subjects’ approval, and public health surveillance systems that have been determined to not require human subjects review.
RESULTS
Single Virus, Season, and Age Group
For the baseline simulation (infection rate, 25%; vaccination coverage, 50%; VE, 50%; no exposure heterogeneity) mVE remained stable at 50% for the all-or-none mechanism but decreased to 42% for the variable mechanism and to 41% for the leaky mechanism (Figure 3). Variation in parameters from the baseline simulation showed that change in mVE was strongly related to seasonal infection rate, with minimal change (less than −1%) when infection rate was 12.5% compared with a −3.9% (variable) to −4.5% (leaky) change for an infection rate of 50% (Figure 4). Measured VE also declined more for heterogeneous exposures and higher values of VE and vaccine coverage. In all simulations, declines in mVE were greater for the leaky than for the variable mechanism.
Figure 3.
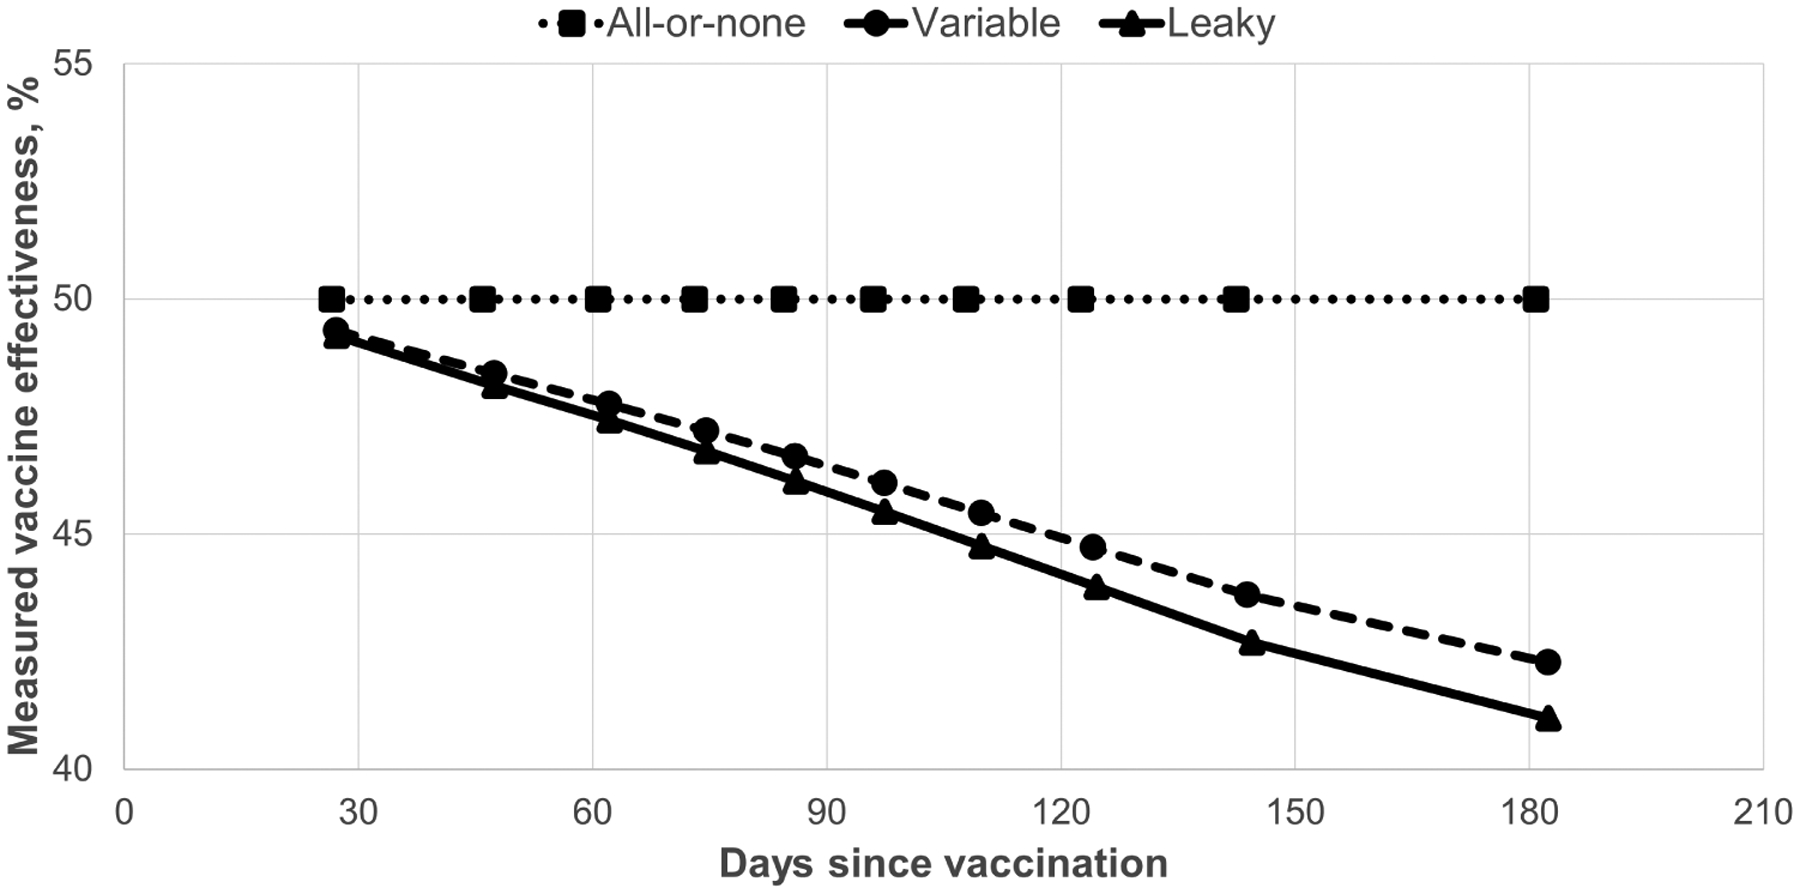
Measured influenza vaccine effectiveness by vaccine mechanism and days since vaccination. Values were simulated using the seasonal pattern of vaccinations and infections from the 50- to 64-year-old age group during the 2013–2014 season, vaccination coverage of 50%, vaccine effectiveness of 50%, and seasonal infection risk of 25%.
Figure 4.

Effect of parameters on absolute change in mVE per 30 days after influenza vaccination. Baseline simulation values are indicated with an asterisk (*). “Infection rate” indicates the cumulative percentage infected by end of season. “Heterogeneity” indicates population variability in numbers of potential exposures per day; “No” indicates homogeneous exposure; “PM” indicates POLYMOD distribution [21]; and “EA” indicates Eames distribution (Supplementary Material 5) [31]. Abbreviations: mVE, measured vaccine effectiveness; VE, vaccine effectiveness.
Simulation of 2011–2012 to 2014–2014 Influenza Seasons
We first assumed that only 25% of cases are symptomatic, and thus that the total infection rate was 4 times the symptomatic rate (Table 1). This resulted in total infection rates varying from 9% to 54% among season/age categories (pooled rate 31% for all seasons and ages combined) and represented a high estimate of infection rate and thus a high estimate of leaky vaccine effect. Among the season/age-group categories, change in mVE per 30 days since vaccination varied from −8.6% to −0.3% for A/H1N1 viruses, −12.6% to −0.5% for A/H3N2 viruses, and −7.2% to −0.4% for B viruses. When data were combined by seasons, minimal changes in mVE were seen in 2011–2012 when the infection rate was low (mVE change, −0.9% to −0.5%). Larger changes occurred in 2012–2013 and 2013–2014 when infection rates were higher (mVE change, −6.9% to −3.4%). Although infection rates were substantial in 2014–2015, VE was low for the predominant A/H3N2 viruses, resulting in moderate changes in mVE (−2.7% to −1.3%).
Next, for comparison with the observed mVE change [1], we evaluated the effects of varying the total infection rate from 15% to 31% for all ages/seasons combined (Table 2). Higher infection rates were associated with greater decreases in mVE. For the leaky mechanism with no reinfections for A/H1N1 viruses, mVE change was −4.6% for the higher versus −1.7% for the lower rate; decreases were smaller for the variable mechanism (−4.2% to −1.6%) and when reinfections were allowed (−3.7% to −1.5%). Similar trends were noted for the A/H3N2 and B viruses. When reinfections were allowed, reinfections comprised 5.2–9.9% of total infections.
Table 2.
Change in Measured Vaccine Effectiveness by Vaccine Mechanism, Proportion Symptomatic and Virus, 2011–2012 to 2014–2015
| Vaccine Effect Mechanism and Proportion Symptomatica | Total Infections,a % | Reinfections Allowed, Proportion Reinfected,b % | Change in mVE per 30 Days Since Vaccination by Virus, % | Attributable Proportion of Leaky or Variable Mechanism,c % | ||||
|---|---|---|---|---|---|---|---|---|
| A/H1N1 | A/H3N2 | B | A/H1N1 | A/H3N2 | B | |||
| Leaky | ||||||||
| 25% | 30.6 | No, 0.0 | −4.6 | −3.8 | −2.7 | 48 | 53 | 42 |
| 33% | 22.9 | No, 0.0 | −2.9 | −2.5 | −1.8 | 30 | 34 | 27 |
| 50% | 15.3 | No, 0.0 | −1.7 | −1.4 | −1.1 | 18 | 19 | 16 |
| Variable | ||||||||
| 25% | 30.6 | No, 0.0 | −4.2 | −3.5 | −2.4 | 43 | 49 | 38 |
| 33% | 22.9 | No, 0.0 | −2.7 | −2.3 | −1.6 | 27 | 31 | 24 |
| 50% | 15.3 | No, 0.0 | −1.6 | −1.3 | −0.9 | 16 | 18 | 15 |
| Leaky | ||||||||
| 25% | 30.6 | Yes, 9.9 | −3.7 | −1.6 | −0.3 | 38 | 22 | 4 |
| 33% | 22.9 | Yes, 7.6 | −2.5 | −1.1 | −0.2 | 25 | 16 | 4 |
| 50% | 15.3 | Yes, 5.2 | −1.5 | −0.7 | −0.2 | 15 | 10 | 3 |
Note: Data and results are for all age groups and seasons combined.
Abbreviation: mVE, measured vaccine effectiveness.
Percentage of influenza infections that are symptomatic; total infection rate includes symptomatic and asymptomatic infections.
If reinfections were allowed in simulations, percentage of infections that are reinfections as determined from simulations.
Change in mVE if leaky or variable mechanism as a proportion of change observed in a prior study [1]. The mean declines per month (95% confidence interval) in the observational study were recalculated as 9.7% (3.0%, 21.9%) for A/H1N1, 7.2% (1.6%, 14.6%) for A/H3N2, and 6.5% (0.8%, 14.5%) for influenza B.
Finally, we determined the proportion of mVE change observed in a prior study [1] that could be accounted for by leaky or variable vaccine mechanisms (simulated mVE/observed mVE) (Table 2). For the leaky mechanism without reinfections and total infection rate of 31%, simulated mVE change comprised 48% (−4.6%/−9.7%) of the observed change for A/H1N1, 53% (−3.8%/−7.2%) for A/H3, and 42% (−2.7%/−6.5%) for B viruses. Across all infection rates, simulated declines accounted for 16–53% of the observed change for the leaky mechanism without reinfections, 15–49% for the variable mechanism, and 3–38% for the leaky mechanism with reinfections.
DISCUSSION
It is known that if a vaccine is leaky (ie, decreases the per-exposure risk of infection but does not provide absolute protection) mVE calculated by commonly used methods will decrease over time even if VE is stable [5–7]. However, our simulations suggest that leaky vaccine effect would likely account for only a portion of the decrease in mVE found in a recent observational study [1]. Our simulation model identified key parameters, most importantly infection rate, affecting changes in mVE associated with the leaky vaccine mechanism. While the observational study showed decreases in mVE per month of 6.5–9.7%, we estimate absolute decreases in mVE due to leaky vaccine effect of less than 1% to 4.6%. Declines of a magnitude comparable to those in the observational study occurred only at very high (ie, 48–54%) simulated infection rates (Table 1).
Among parameters affecting declines in mVE, total (symptomatic and asymptomatic) infection rate had the greatest effect. Decline in mVE is also associated with heterogeneity of exposure to infection, higher rates of vaccine coverage, and (within a certain range) higher VE values. There was great variability in leaky vaccine effect, with mVE changes per 30 days varying from −13% to −0.3% among season/age-group/virus combinations (Table 1). Thus, the mix of ages and seasons included has great effect. Our simulations intentionally include a maximal estimate of mVE change by assuming a low (25%) percentage symptomatic and thus a high total infection rate. A decrease in mVE will be absent or lower if the infection rate is lower, any reinfections occur, or the vaccine effect is all-or-none, variable or a mixture of mechanisms.
In addition to the leaky mechanism, we also simulated a “variable” mechanism under which vaccinees experience a varying vaccine effect, which we represented with the β distribution. We found mVE declines that were smaller with the variable mechanism than the leaky mechanism. A variable mechanism seems more biologically plausible, but the leaky mechanism is computationally easier and produces a maximal estimate of mVE decrease. Additionally, the variable mechanism requires choices, such as of distribution and shape parameters, which may affect results.
Reinfections during an influenza season are uncommonly reported and few data are available on their frequency [34, 35]. We considered the possibility of reinfection with a different virus and found that this reduced the leaky vaccine decline in mVE. This occurs because the leaky vaccine effect is produced by depletion of susceptibles from prior infection; however, if reinfections with another virus can occur, prior infection depletes those susceptible to the first infecting virus but not to other viruses, and thus the effect of leaky vaccine is reduced but not eliminated. Viral interference probably inhibits reinfection for days or weeks after a first infection [32, 33], but we did not account for this. Instead, we present 2 extremes (no reinfections vs reinfections allowed immediately after a first infection) that span the range of possibilities. In our simulations that assumed a leaky vaccine, 5–10% of infections were reinfections, which are at the low range of the few values reported in the literature (Supplementary Material 2) [34].
We used a traditional analysis comparing risk among all vaccinated versus unvaccinated persons, but other approaches are possible [7]. Most studies are unable to remove prior cases (which are generally unknown) from denominators when calculating mVE. As in this study, including prior cases as uninfected persons in comparisons of vaccinated versus unvaccinated will produce decreasing mVE if vaccine effect is leaky or variable. However, some study designs allow for ascertainment of all cases (by serology or frequent sampling) so that prior cases could be removed from calculations; such an approach can produce a stable mVE if vaccine is leaky but an increasing mVE over time if the vaccine effect is all-or-none [7, 36]. Ray et al [37] recently suggested that limiting analysis to vaccinees who were vaccinated before substantial numbers of cases have occurred prevents bias caused by leaky vaccine and related effects; reanalysis of their data using this method continued to show decreasing mVE, suggesting true waning rather than leaky vaccine or other artifact.
The primary limitation in this study is uncertainty in input values, especially the proportion of cases that are asymptomatic (subclinical) and thus total infection rate. There is also uncertainty in estimated numbers of symptomatic cases and vaccinations [14]. Varying input values among the range of possibilities leads to widely varying estimates of the potential contribution of the leaky vaccine effect. Confidence limits on mVE change in the observational study were wide and include many of our simulated mVE changes (Table 2, footnote). However, our aim was not to test statistical significance but to determine how the magnitude of the observed VE decline compares with that expected if vaccine were leaky. We assumed that all persons were susceptible at the beginning of the season, but many will have pre-existing immunity due to prior infections and vaccination. We assumed that vaccine works by reducing infections, but it may also, or instead, act by reducing severity of illness [38] and thus case detection. We did not consider mixed (ie, some proportion all-or-none and others leaky) vaccine effects or the possibility of antigenic drift during an influenza season.
While it is not known whether the influenza vaccine mechanism is leaky, the possibility that leaky vaccine effect could account for observed decreases in mVE creates uncertainty [5, 39]. Our simulations suggest that a leaky vaccine mechanism would likely account for only some of the observed decline in mVE. Approaches to improving late-season protection could include production of vaccines with higher VE or more durable protection as well as changes in timing of vaccine administration. The Centers for Disease Control and Prevention recommends that influenza vaccination be received by the end of October, noting that “early vaccination (ie, in July and August) is likely to be associated with suboptimal immunity before the end of the influenza season” [40]. While delaying vaccination until later in the fall is a possibility [3, 11], this strategy might result in some people not getting vaccine or getting it too late to prevent early-season illness [13]. Our results underscore the need to better understand factors contributing to and devise strategies to deal with intraseasonal VE decline [12].
Supplementary Material
Acknowledgments.
The authors gratefully acknowledge personnel for the following groups that collected data used in this project: Influenza Hospitalization Surveillance Network, Flu Vax View, and the US Influenza Vaccine Effectiveness Network.
Potential conflicts of interest.
J. M. F. reports travel support from the Institute for Influenza Epidemiology (funded in part by Sanofi Pasteur). All other authors report no potential conflicts. All authors have submitted the ICMJE Form for Disclosure of Potential Conflicts of Interest. Conflicts that the editors consider relevant to the content of the manuscript have been disclosed.
Footnotes
Supplementary Data
Supplementary materials are available at Clinical Infectious Diseases online. Consisting of data provided by the authors to benefit the reader, the posted materials are not copyedited and are the sole responsibility of the authors, so questions or comments should be addressed to the corresponding author.
Publisher's Disclaimer: Disclaimer. The findings and conclusions in this report are those of the authors and do not necessarily represent the official position of the Centers for Disease Control and Prevention.
References
- 1.Ferdinands JM, Fry AM, Reynolds S, et al. Intraseason waning of influenza vaccine protection: evidence from the US Influenza Vaccine Effectiveness Network, 2011–12 through 2014–15. Clin Infect Dis 2017; 64:544–50. [DOI] [PubMed] [Google Scholar]
- 2.Young B, Zhao X, Cook AR, Parry CM, Wilder-Smith A, I-Cheng MC. Do antibody responses to the influenza vaccine persist year-round in the elderly? A systematic review and meta-analysis. Vaccine 2017; 35:212–21. [DOI] [PubMed] [Google Scholar]
- 3.Ray GT, Lewis N, Klein NP, et al. Intra-season waning of influenza vaccine effectiveness. Clin Infect Dis 2019; 68:1623–30. [DOI] [PMC free article] [PubMed] [Google Scholar]
- 4.Young B, Sadarangani S, Jiang L, Wilder-Smith A, Chen MI. Duration of influenza vaccine effectiveness: a systematic review, meta-analysis, and meta-regression of test-negative design case-control studies. J Infect Dis 2018; 217:731–41. [DOI] [PubMed] [Google Scholar]
- 5.Lipsitch M Challenges of vaccine effectiveness and waning studies. Clin Infect Dis 2019; 68:1631–3. [DOI] [PMC free article] [PubMed] [Google Scholar]
- 6.Goldstein E, Pitzer VE, O’Hagan JJ, Lipsitch M. Temporally varying relative risks for infectious diseases: implications for infectious disease control. Epidemiology 2017; 28:136–44. [DOI] [PMC free article] [PubMed] [Google Scholar]
- 7.Smith PG, Rodrigues LC, Fine PE. Assessment of the protective efficacy of vaccines against common diseases using case-control and cohort studies. Int J Epidemiol 1984; 13:87–93. [DOI] [PubMed] [Google Scholar]
- 8.Kanaan MN, Farrington CP. Estimation of waning vaccine efficacy. J Am Stat Assoc 2002; 97:389–97. [Google Scholar]
- 9.White MT, Griffin JT, Drakeley CJ, Ghani AC. Heterogeneity in malaria exposure and vaccine response: implications for the interpretation of vaccine efficacy trials. Malar J 2010; 9:82. [DOI] [PMC free article] [PubMed] [Google Scholar]
- 10.Lewnard JA, Tedijanto C, Cowling BJ, Lipsitch M. Measurement of vaccine direct effects under the test-negative design. Am J Epidemiol 2018; 187:2686–97. [DOI] [PMC free article] [PubMed] [Google Scholar]
- 11.Newall AT, Chen C, Wood JG, Stockwell MS. Within-season influenza vaccine waning suggests potential net benefits to delayed vaccination in older adults in the United States. Vaccine 2018; 36:5910–5. [DOI] [PubMed] [Google Scholar]
- 12.Klein NP, Fireman B. If influenza vaccines wane can we delay vaccination without compromising coverage? Clin Infect Dis 2020; 70:1560–1. [DOI] [PMC free article] [PubMed] [Google Scholar]
- 13.Ferdinands JM, Alyanak E, Reed C, Fry AM. Waning of influenza vaccine protection: exploring the trade-offs of changes in vaccination timing among older adults. Clin Infect Dis 2019; 69:190–1. [DOI] [PubMed] [Google Scholar]
- 14.Reed C, Chaves SS, Daily Kirley P, et al. Estimating influenza disease burden from population-based surveillance data in the United States. PLoS One 2015; 10:e0118369. [DOI] [PMC free article] [PubMed] [Google Scholar]
- 15.Centers for Disease Control and Prevention. FluVaxView. Available at: https://www.cdc.gov/flu/fluvaxview/index.htm.Accessed7 July 2017.
- 16.Ohmit SE, Thompson MG, Petrie JG, et al. Influenza vaccine effectiveness in the 2011–2012 season: protection against each circulating virus and the effect of prior vaccination on estimates. Clin Infect Dis 2014; 58:319–27. [DOI] [PMC free article] [PubMed] [Google Scholar]
- 17.McLean HQ, Thompson MG, Sundaram ME, et al. Influenza vaccine effectiveness in the United States during 2012–2013: variable protection by age and virus type. J Infect Dis 2015; 211:1529–40. [DOI] [PMC free article] [PubMed] [Google Scholar]
- 18.Gaglani M, Pruszynski J, Murthy K, et al. Influenza vaccine effectiveness against 2009 pandemic influenza a(H1H1) virus differed by vaccine type during 2013–2014 in the United States. J Infect Dis 2016; 213:1546–56. [DOI] [PMC free article] [PubMed] [Google Scholar]
- 19.Zimmerman RK, Nowalk MP, Chung J, et al. 2014–2015 Influenza vaccine effectiveness in the United States by vaccine type. Clin Infect Dis 2016; 63:1564–73. [DOI] [PMC free article] [PubMed] [Google Scholar]
- 20.Centers for Disease Control and Prevention. Overview of influenza surveillance in the United States. Available at: https://www.cdc.gov/flu/weekly/overview.htm.Accessed11 April 2017.
- 21.Mossong J, Hens N, Jit M, et al. Social contacts and mixing patterns relevant to the spread of infectious diseases. PLoS Med 2008; 5:e74. [DOI] [PMC free article] [PubMed] [Google Scholar]
- 22.Monto AS, Koopman JS, Longini IM Jr. Tecumseh study of illness. XIII. Influenza infection and disease, 1976–1981. Am J Epidemiol 1985; 121:811–22. [DOI] [PubMed] [Google Scholar]
- 23.Huang QS, Bandaranayake D, Wood T, et al. ; Southern Hemisphere Influenza and Vaccine Effectiveness Research and Surveillance (SHIVERS) Investigation Team. Risk factors and attack rates of seasonal influenza infection: results of the Southern Hemisphere Influenza and Vaccine Effectiveness Research and Surveillance (SHIVERS) seroepidemiologic cohort study. J Infect Dis 2019; 219:347–57. [DOI] [PMC free article] [PubMed] [Google Scholar]
- 24.Hayward AC, Fragaszy EB, Bermingham A, et al. ; Flu Watch Group. Comparative community burden and severity of seasonal and pandemic influenza: results of the Flu Watch cohort study. Lancet Respir Med 2014; 2:445–54. [DOI] [PMC free article] [PubMed] [Google Scholar]
- 25.Wang TE, Lin CY, King CC, Lee WC. Estimating pathogen-specific asymptomatic ratios. Epidemiology 2010; 21:726–8. [DOI] [PubMed] [Google Scholar]
- 26.Centers for Disease Control and Prevention. Epidemiology and prevention of vaccine-preventable diseases. Hamborsky J, Kroger A, Wolfe S, eds. Epidemiology and prevention of vaccine-preventable diseases. Chapter 12: Influenza 13th ed.Washington, DC: Public Health Foundation; 2015:187–208. [Google Scholar]
- 27.Carrat F, Vergu E, Ferguson NM, et al. Time lines of infection and disease in human influenza: a review of volunteer challenge studies. Am J Epidemiol 2008; 167:775–85. [DOI] [PubMed] [Google Scholar]
- 28.Sullivan KM, Monto AS, Longini IM Jr. Estimates of the US health impact of influenza. Am J Public Health 1993; 83:1712–6. [DOI] [PMC free article] [PubMed] [Google Scholar]
- 29.Cowling BJ, Perera RA, Fang VJ, et al. Incidence of influenza virus infections in children in Hong Kong in a 3-year randomized placebo-controlled vaccine study, 2009–2012. Clin Infect Dis 2014; 59:517–24. [DOI] [PubMed] [Google Scholar]
- 30.Cohen C, Moyes J, Mkhencele T, McMorrow M. Community burden of influenza in a rural and urban setting, South Africa, 2016–2017. Options X for Control of Influenza. Singapore, 2019:Abstract10667. [Google Scholar]
- 31.Eames KT, Tilston NL, Brooks-Pollock E, Edmunds WJ. Measured dynamic social contact patterns explain the spread of H1N1v influenza. PLoS Comput Biol 2012; 8:e1002425. [DOI] [PMC free article] [PubMed] [Google Scholar]
- 32.Sonoguchi T, Naito H, Hara M, Takeuchi Y, Fukumi H. Cross-subtype protection in humans during sequential, overlapping, and/or concurrent epidemics caused by H3N2 and H1N1 influenza viruses. J Infect Dis 1985; 151:81–8. [DOI] [PubMed] [Google Scholar]
- 33.Chen IM, Loh JP, Chuah CXP, et al. Evidence for cross-protection against subsequent febrile respiratory illness episodes from prior infections by different viruses among Singapore military recruits 2009–2014. J Infect Dis 2019; 219:1913–23. [DOI] [PMC free article] [PubMed] [Google Scholar]
- 34.Frank AL, Taber LH, Wells JM. Individuals infected with two subtypes of influenza A virus in the same season. J Infect Dis 1983; 147:120–4. [DOI] [PubMed] [Google Scholar]
- 35.Most J, Weiss G. Consecutive infections with influenza a and b virus in children during the 2014–2015 seasonal influenza epidemic. J Infect Dis 2016; 214:1139–41. [DOI] [PubMed] [Google Scholar]
- 36.Farrington CP. The measurement and interpretation of age-specific vaccine efficacy. Int J Epidemiol 1992; 21:1014–20. [DOI] [PubMed] [Google Scholar]
- 37.Ray GT, Lewis N, Klein NP, Daley MF, Lipsitch M, Fireman B. Depletion of susceptibles bias in analyses of intra-season waning of influenza vaccine effectiveness. Clin Infect Dis 2020; 70:1484–6. [DOI] [PMC free article] [PubMed] [Google Scholar]
- 38.Thompson MG, Pierse N, Sue Huang Q, et al. Influenza vaccine effectiveness in preventing influenza-associated intensive care admissions and attenuating severe disease among adults in New Zealand 2012–2015. Vaccine 2018; 36:5916–25. [DOI] [PubMed] [Google Scholar]
- 39.Ferdinands JM, Patel MM, Foppa IM, Fry AM. Influenza vaccine effectiveness. Clin Infect Dis 2019; 69:190–1. [DOI] [PubMed] [Google Scholar]
- 40.Grohskopf LA, Alyanak E, Broder KR, Walter EB, Fry AM, Jernigan DB. Prevention and control of seasonal influenza with vaccines: recommendations of the advisory committee on immunization practices—United States, 2019–20 Influenza Season. MMWR Recomm Rep 2019; 68:1–21. [DOI] [PMC free article] [PubMed] [Google Scholar]
Associated Data
This section collects any data citations, data availability statements, or supplementary materials included in this article.