Abstract
Development is often assumed to be hardwired in the genome, but several lines of evidence indicate that it is susceptible to environmental modulation with potential long-term consequences, including in mammals1,2. The embryonic germline is of particular interest because of the potential for intergenerational epigenetic effects. The mammalian germline undergoes extensive DNA demethylation3-7 that occurs in large part by passive dilution over successive cell divisions, accompanied by active DNA demethylation via Ten-eleven translocation (Tet) enzymes3,8-10. Tet activity has been shown to be modulated by nutrients and metabolites, including Vitamin C (VitC)11-15. We report here that maternal VitC is required for proper DNA demethylation and development of female fetal germ cells in a mouse model. Maternal VitC deficiency does not affect overall embryonic development but leads to reduced germ cell numbers, delayed meiosis and reduced fecundity in adulthood. The transcriptome of germ cells from VitC-deficient embryos is remarkably similar to that of embryos carrying a null mutation in Tet1. VitC deficiency leads to an aberrant DNA methylation profile that includes incomplete demethylation of key regulators of meiosis and transposable elements. These findings reveal that deficiency in VitC during gestation partially recapitulates Tet1 loss and provide a potential intergenerational mechanism for adjusting fecundity to environmental conditions.
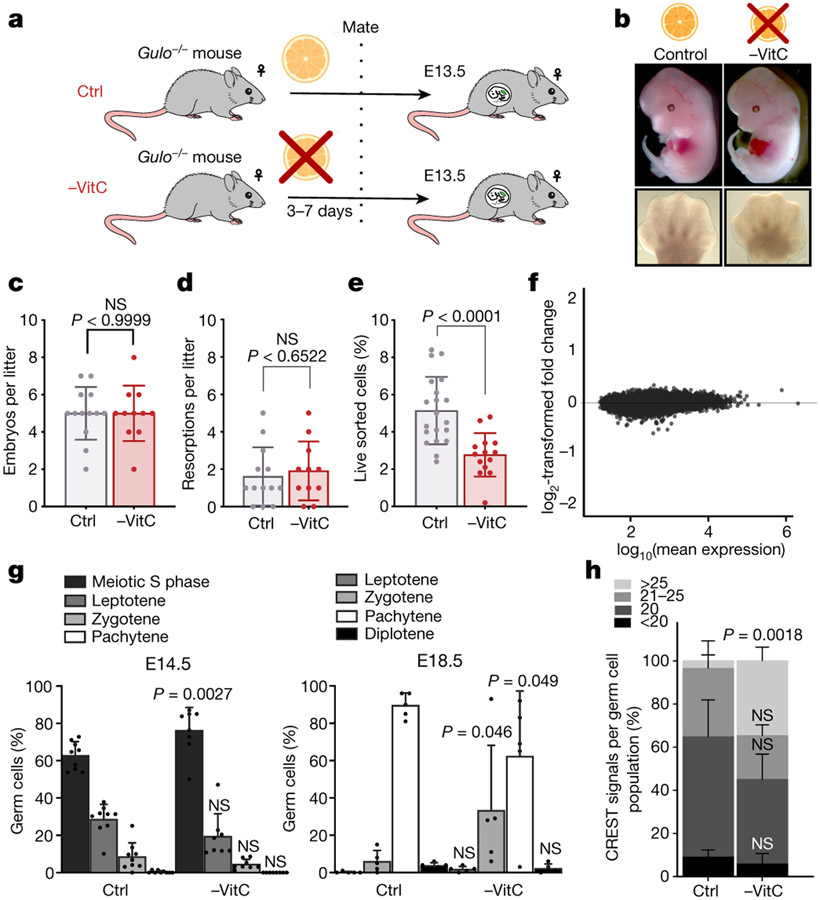
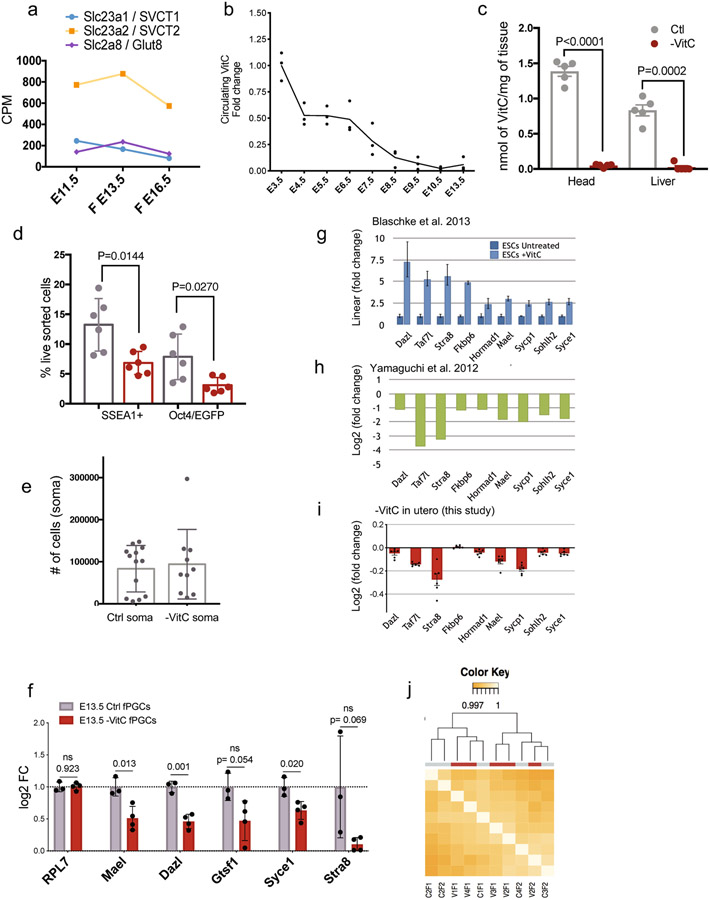
We sought to determine the role of VitC in the developing germline, which expresses high levels VitC transporters (Extended Data Fig. 1a). We used Gulo−/−;Oct4/EGFP16,17 mice to test the role of VitC in germline development (see Methods). VitC was removed from the drinking water of female mice from before mating to E13.5. We chose E13.5 because it represents the lowest point of global DNA methylation during germline reprogramming3. We focused on female germ cells because they enter meiosis at E13.5, whereas in males this only occurs postnatally. In all our analyses, female progeny of VitC-depleted mothers were compared to genetically identical controls supplied with physiological levels of VitC throughout development (Fig. 1a). Withdrawal of VitC in this paradigm is compatible with normal development through E13.5 (Fig. 1b-d). However, there is a significant reduction in the numbers of PGCs in VitC-deficient female embryos, compared to controls (Fig. 1e and Extended Data Fig. 1d, e).
Figure 1 ∣.
Maternal Vitamin C promotes female germ cell development.
a, Diagram of Vitamin C withdrawal during gestation. Control (Ctrl) litters are genetically identical to Vitamin C deficient litters (-VitC). Ctrl females are provided with physiological levels of Vitamin C in the drinking water. -VitC females are withdrawn from Vitamin C 3-7 days before mating up to E13.5.
b, Vitamin C deficiency does not affect embryonic development to E13.5, as determined by morphological assessment of the embryos and hand plate staging. Embryos were compared across 13 control and 11 -VitC litters.
c, Gestational Vitamin C deficiency does not affect litter size. Statistical significance assessed by two-sided Welch’s t-test. Error bars depict mean ± SD.
d, Gestational Vitamin C deficiency does not affect resorption rate. Statistical significance assessed by two-sided Welch’s t-test. Error bars depict mean ± SD.
e, Reduction in the number of Oct4/EGFP+ germ cells in -VitC E13.5 female embryos. Statistical significance assessed by two-sided Welch’s t-test. Error bars depict mean ± SD.
f, MA plot reveals no significant changes in the transcription profile of -VitC E13.5 somatic cells of the female gonad (log2FC > ∣1∣ and FDR <0.05).
g, Staging of meiosis reveals a delay in meiosis progression in -VitC ovaries. Error bars depict mean ± SD. Statistical significance assessed by Sidak’s multiple comparison test. See also Extended Data Fig. 3f, g.
h, CREST staining reveals unpaired chromosomes in -VitC E18.5 female germ cells. CREST foci were counted in 100 cells across 4 biological replicates. Images in Extended Data Fig. 3h. Error bars depict mean ± SEM. Statistical significance assessed by two-sided Welch’s t-test.
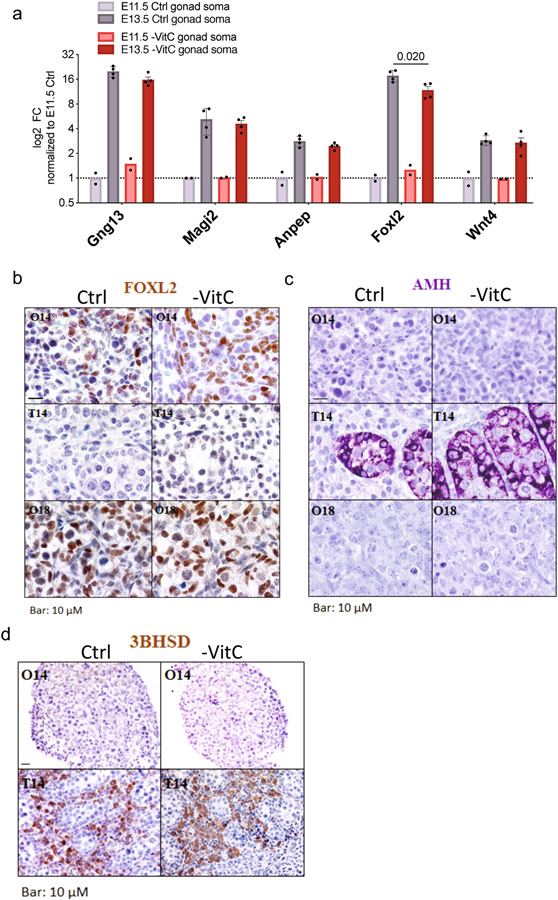
When added to ES cells in culture, VitC induces DNA demethylation and expression of a set of key germline genes in a Tet1/2-dependent manner11, and these genes also depend on Tet1 for expression in PGCs in vivo8,18. Interestingly, we found that those same germline genes are consistently down-regulated in female PGCs developed under VitC-deficient conditions (Extended Data Fig. 1f-i). VitC deficiency has no overall impact on the developmental progression of fetal gonads, as assessed by RNA-seq (Fig. 1f, Extended Data Fig. 1j), qRT-PCR of select somatic markers that are sharply induced between E11.5 and E13.5, and immunohistochemistry (Extended Data Fig. 2a-c). Thus, VitC deficiency during gestation up to E13.5 is compatible with embryonic and gonadal development but leads to reduced germ cell numbers and defective expression of Tet1-dependent germline regulators.
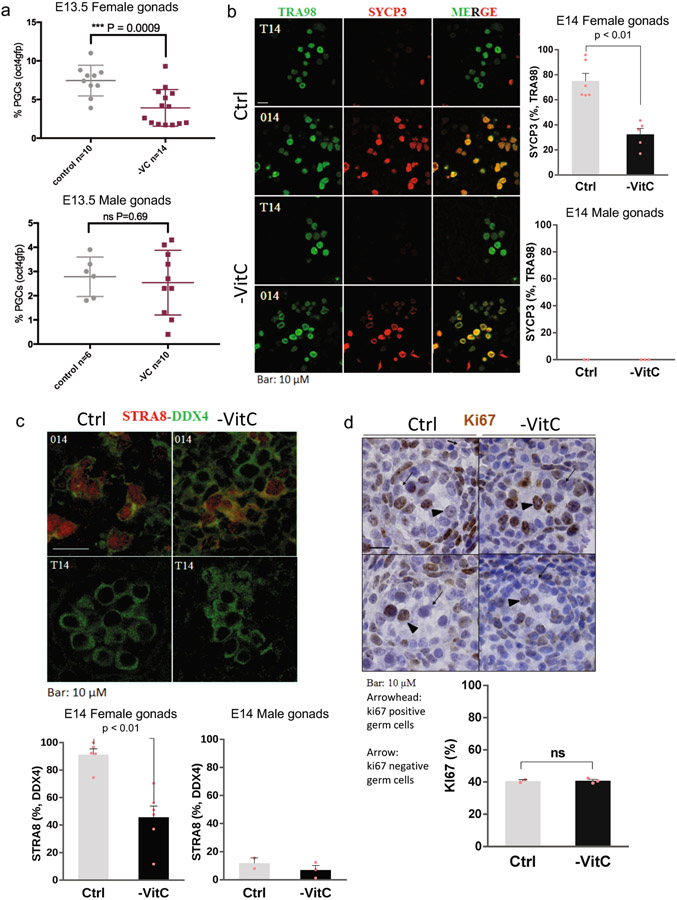
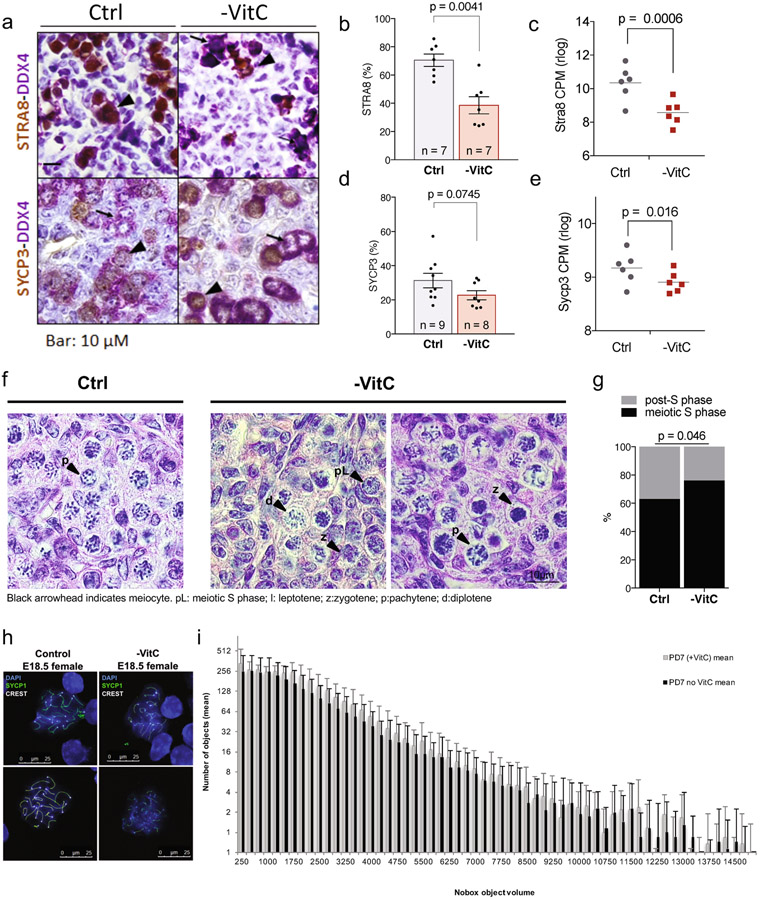
Several of the germline genes identified as VitC-responsive in vivo (Extended Data Fig. 1f) are important regulators of meiotic initiation and progression. We confirmed significant reductions in STRA8 and SYCP3 at the RNA and protein level in VitC-deficient germ cells (Extended Data Fig. 1f, Extended Data Fig. 3a-e). E14.5 VitC-deficient ovaries display a significant enrichment in the proportion of germ cells in meiotic S phase (preleptotene), compared to controls (Fig. 1g). While changes in individual post-S phase stages are not significant (Fig. 1g), their aggregate proportion is reduced in VitC-deficient ovaries (Extended Data Fig. 3f, g). This delay in meiotic progression persists at E18.5 (Fig. 1g). The successful pairing of chromosomes during meiosis in mouse germ cells leads to approximately 20 centromeric foci per cells; however, VitC-deficient embryos have a significant increase in germ cells with >25 centromeric foci per cell (Fig. 1h and Extended Data Fig. 3h). Interestingly, fetal testes, where meiosis does not take place until puberty, display no apparent defects in number, cell morphology, nor marker protein expression upon VitC deficiency (Extended Data Fig. 2b-d and Extended Data Fig. 4). Taken together, these data document that maternal VitC deficiency induces significant deficits in meiotic initiation and progression in fetal female germ cells.
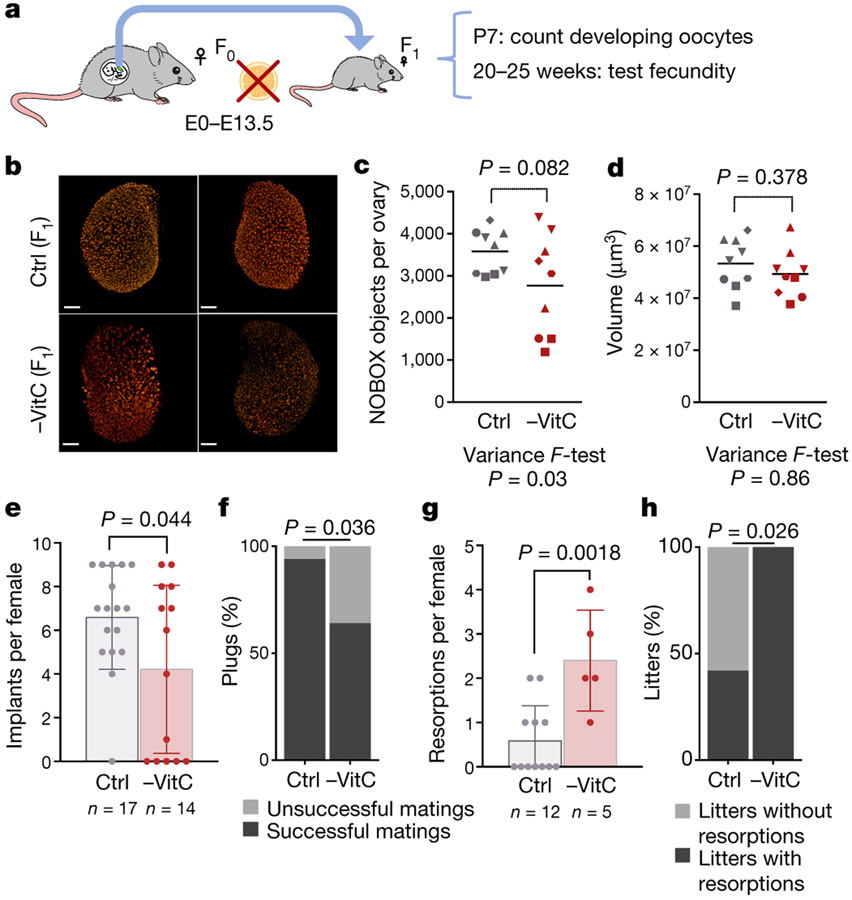
We next investigated potential postnatal effects of gestational VitC deficiency on ovarian reserve and fecundity. Pregnant females (F0) were depleted of VitC as before, returned to a VitC-containing diet from E13.5 onwards and allowed to give birth (Fig. 2a). There is an abnormally variable ovarian reserve in P7 pups that had been depleted of VitC in utero (-VitC F1), with several of them having very low numbers of developing oocytes relative to controls (Ctrl F1) (Fig. 2b, c). There are no significant changes in ovary volume (Fig. 2d) or overall distribution of oocyte sizes (Extended Data Fig. 3i). Upon mating, -VitC F1 females have a significantly reduced number of implanted embryos per mating, with a high incidence of entirely failed pregnancies (lacking implantation sites) relative to Ctrl F1 (Fig. 2e, f). Even within the successful pregnancies of -VitC F1 females, there is an abnormally high frequency of embryo resorption (Fig. 2g, h). Thus, while -VitC F1 females can be fertile, they have significantly reduced fecundity.
Figure 2 ∣.
Gestational Vitamin C deficiency has a long-term impact on female fecundity.
a, Diagram of experiments to address female fecundity (see Fig. 1a). From E13.5 onwards, Vitamin C was resupplied in the drinking water. After birth, F1 females were assessed for ovarian reserve at day 7 or fecundity at 20-25 weeks. All -VitC and control mice are of the same genotype, Gulo−/−;Oct4/EGFP.
b, Representative whole-mount images of P7 ovaries from -VitC or control females. Oocyte nuclei identified by Nobox (red) are segmented and sorted by volume to quantify primordial and primary follicles. n = 9 ovaries per condition.
c, Quantification of oocytes in day 7 ovaries by whole-mount imaging of Nobox staining. Geometric shapes represent individual female embryos; Identical shapes indicate ovary pairs. Control females contain 3000-4500 Nobox+ oocytes/ovary (n=9). -VitC females contain 1000-4500 Nobox+ oocytes/ovary (n=9). Statistical significance assessed by two-tailed Student’s t-test and variance determined by F ratio. Centre line represents mean.
d, Normal numbers and variance in P7 ovary volume from females that had developed in the absence of Vitamin C. n = 9 ovaries per condition were measured, matched with data in Fig. 2c. Statistical significance assessed by two-tailed Student’s t-test and variance determined by F ratio. Centre line represents mean.
e, -VitC or control F1 females were mated to wild-type males, and the number of implantation sites per female displaying a vaginal plug was counted between E9.5-E18.5. Ctrl F1 females average 6.5 implants per pregnancy while -VitC F1 females average 4 implants. Statistical significance assessed by two-tailed Student’s t-test. Error bars depict mean ± SEM.
f, There is a significant reduction in the number of successful matings in -VitC F1 females. A successful mating is defined as the observation of at least 1 implanted embryo per female that had displayed a vaginal plug after mating. Data collected from n=14 Vitamin C deficient and n=17 control mated females. Statistical significance assessed by Chi-square test.
g, Within successful matings only, there is a higher number of resorptions in -VitC F1 females, relative to controls. Statistical significance assessed by two-tailed Student’s t-test. Error bars depict mean ± SEM.
h, The number of pregnancies containing at least one resorbed embryo is significantly higher in - VitC F1 females, relative to controls. Data collected from n=5 -VitC and n=12 control pregnant females. Statistical significance assessed by Chi-square test.
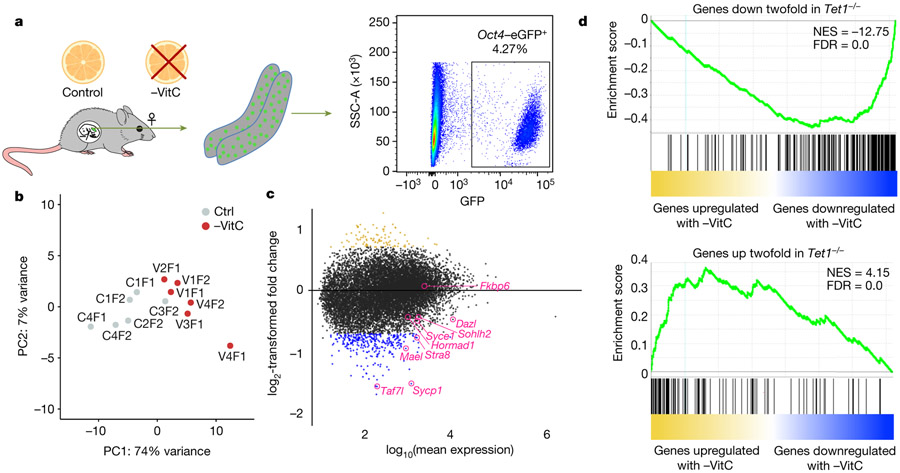
Our results indicate that resupply of VitC to the maternal diet at E13.5 does not erase the defects in germline function induced by VitC deficiency earlier in gestation. We therefore characterized the transcriptome of E13.5 germ cells (Fig. 3a and Extended Data Fig. 5a). -VitC germ cells are overall transcriptionally distinguishable from controls (Fig. 3b, Extended Data Fig. 5b). 412 genes were identified as differentially expressed in germ cells upon VitC deficiency during gestation (FDR < 0.05, Log2FC > ∣0.7∣), with a preponderance of down-regulated genes (314 genes down-regulated versus 98 up-regulated, Fig. 3c, d and Supplementary File 1). Importantly, the set of genes down-regulated in -VitC germ cells is enriched for functions in meiosis and sexual reproduction (Supplementary File 3). Several key regulators of meiosis are among the top down-regulated genes in -VitC germ cells (Fig. 3c).
Figure 3 ∣.
Vitamin C deficiency induces a Tet1−/− like expression profile in the developing germline.
a, Diagram of experiments to determine the molecular impact of Vitamin C deficiency in the embryonic germline. Pregnant mice were deprived of Vitamin C as before and Oct4/EGFP+ germ cells were isolated from single E13.5 embryos.
b, Principle component analysis (PCA) of the transcriptional profile of E13.5 germ cells identifies a clear separation of samples according to Vitamin C availability along PC1. Each grey or red dot represents the germ cell transcriptome from a single Ctrl or -VitC female embryo, respectively. N=6 biological replicates per condition were measured. The Ctrl sample closest to the -VitC samples in the PCA plot clusters with them in hierarchical clustering (see Extended Data Fig. 5b). This sample is transcriptionally intermediate between Ctrl and -VitC samples, for reasons unknown.
c, MA plot of the differential expression between Ctrl and -VitC samples. The 98 gold dots represent genes significantly up-regulated in -VitC germ cells. The 314 blue dots represent genes down-regulated in -VitC germ cells. Select germline genes previously identified as Tet1- dependent in female germ cells8, induced by Vitamin C in ES culture11 and validated by qRT-PCR (see Extended Data Fig. 1f-i) are highlighted in pink.
d, Gene Set Enrichment Analysis (GSEA) highlights the similarities between -VitC (this study) and Tet1−/−8 female E13.5 germ cells. Both up-regulated or down-regulated genes in Tet1−/− germ cells are highly biased to be up-regulated or down-regulated, respectively, in -VitC E13.5 germ cells. Statistical significance is calculated by a weighted Kolmogorov-Smirnov-like statistic and adjusted for multiple hypothesis testing.
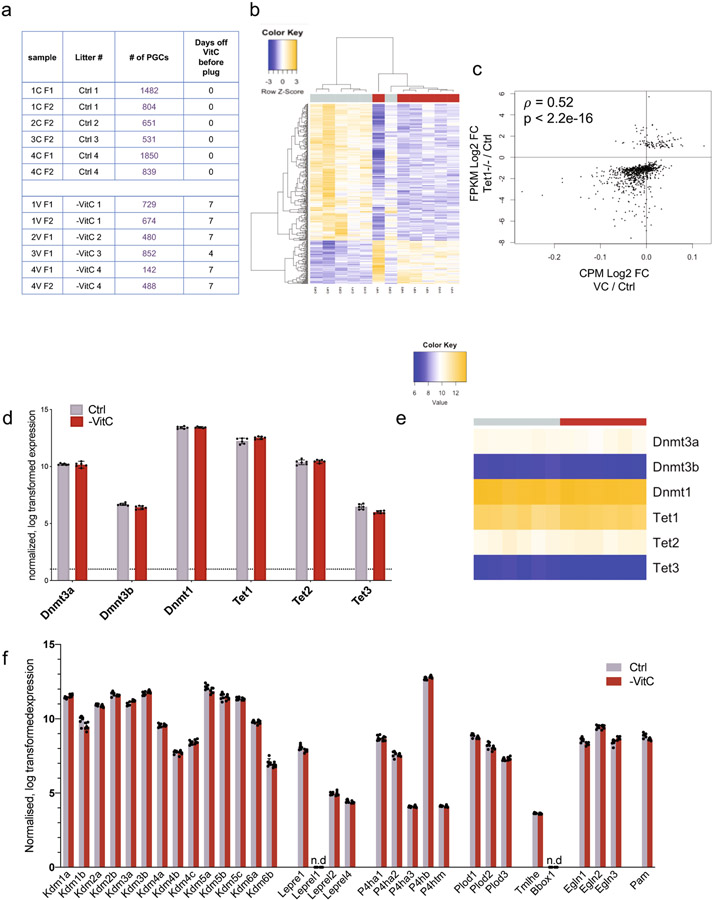
Similar to VitC-deficient embryos, Tet1−/− female embryos are fully viable but display a reduced number of germ cells, reduced expression of meiotic regulators, defective meiosis and reduced fecundity8,9. We found that VitC deficiency recapitulates the transcriptional defects of Tet1−/− germ cells, with regards to both up-regulated and down-regulated genes (Fig. 3d, Extended Data Fig. 5c), as well as Gene Ontology terms (Supplementary File 3). VitC deficiency does not affect the expression of Tet’s, Dnmt’s, or other potentially VitC-sensitive enzymes in PGCs (Extended Data Fig. 5d-f). Taken together, these data indicate that, while VitC and Tet1 are likely to have unique functions in the fetal female germline, VitC is required for the execution of a transcriptional program that is orchestrated by Tet1 and is essential for normal fecundity.
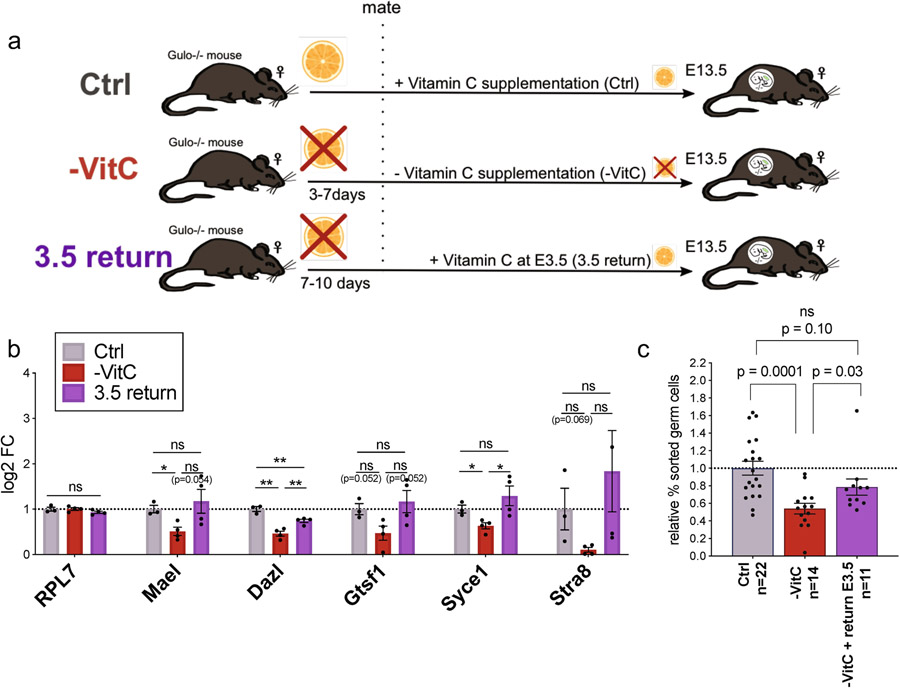
Re-supplementation of VitC at E3.5, after the pre-implantation window of DNA methylation reprogramming, rescues to a large extent the transcriptional defects and the reduction in germ cell numbers induced by VitC deficiency (Extended Data Fig. 6). These results suggest that VitC is required for proper germline gene expression and germ cell development between E3.5 and E13.5, overlapping with the window of DNA demethylation in the embryonic germline.
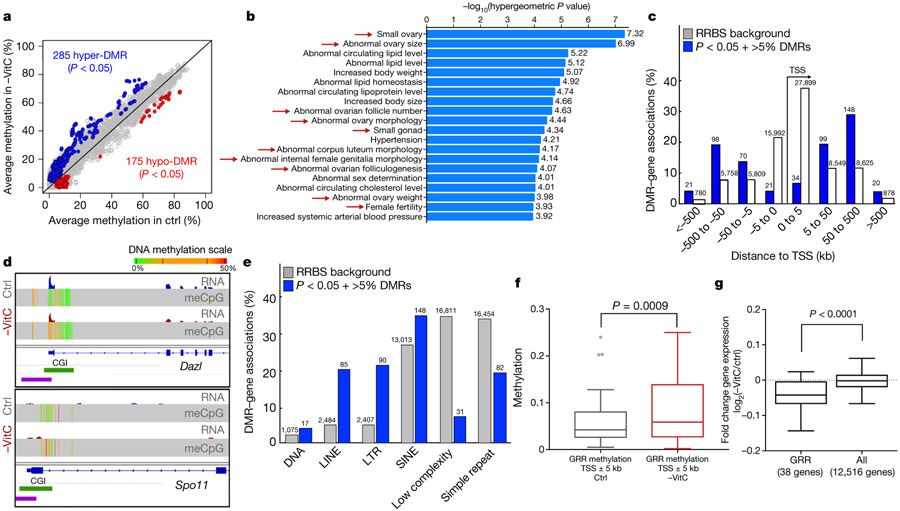
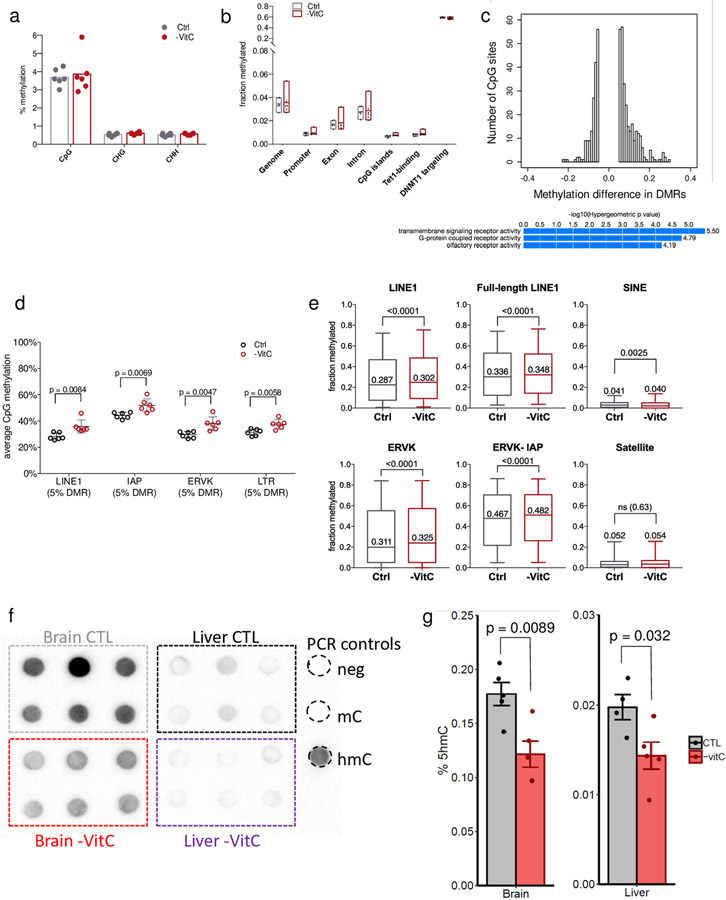
We next used Reduced Representation Bisulfite Sequencing (RRBS) to compare the DNA methylome of -VitC and Ctrl E13.5 germ cells on a genome-wide scale. As previously reported3,19, E13.5 female germ cells are globally demethylated, and the presence or absence of VitC does not affect the global abundance of modified cytosines (Extended Data Fig. 7a, b). These results are in agreement with the notion that global DNA demethylation in the germline occurs primarily via passive dilution, with Tet1 playing a secondary role3,8,20. We identified 460 Differentially Methylated Regions (DMRs) across the genome (p-value < 0.05, 5% minimum change). Two-thirds of the DMRs gain methylation upon VitC deficiency (285 hypermethylated DMRs vs 175 hypomethylated DMRs, Fig. 4a and Extended Data Fig. 7c), indicating that VitC is primarily required for DNA demethylation.
Figure 4 ∣.
Vitamin C deficiency leads to incomplete loss of DNA methylation at meiosis regulators and transposable elements in the embryonic germline.
a, Average methylation per CpG across the germ cells of n=6 biologically independent Control and -VitC E13.5 female embryos. Differentially Methylated Regions (DMRs) were defined by hierarchical testing and size-weighted FDR. Blue and red dots represent 285 hypermethylated DMRs and 175 hypomethylated DMRs, respectively.
b, GREAT analysis of n=285 hypermethylated DMRs induced by Vitamin C deficiency identifies an enrichment for annotations associated with abnormal ovary development and female infertility (red arrows).
c, Distance of n=285 hypermethylated DMRs to gene Transcription Start Sites (TSS) compared to the universe of genomic regions covered by RRBS. DMRs are found primarily at a distance from TSSs. This trend is similar in hypomethylated DMRs.
d, Dazl and Spo11 are both examples of hyper DMRs at the promoter of germline regulators. The reduced expression of Dazl at E13.5 is correlated with a gain in promoter methylation.
e, DMR-TE analyses reveals that n=460 DMRs (hyper and hypo) are enriched at LINE, LTR and SINE elements relative to the RRBS background.
f, Increase CpG methylation is found surrounding the transcriptional start site (TSS) of GRR genes with Vitamin C deficiency. Average GRR gene TSS methylation across n=6 biological replicates per condition was collected. Statistical significance assessed by paired two-sided Wilcoxon test. Box plot hinges correspond to Tukey plot quartiles with median center line.
g, GRR genes display reduced gene expression upon Vitamin C deficiency as compared to all genes profiled. Statistical significance assessed by two-sided unpaired Welch’s t-test. Box plot hinges correspond to Tukey plot quartiles with median center line.
Interestingly, hypermethylated DMRs induced by VitC deficiency are enriched for sequences associated with abnormal ovary development and female infertility (Fig. 4b). Most of the DMRs are located distal from transcription start sites (TSS, Fig. 4c). The 55 genes with hypermethylation within 5kb of their TSS upon VitC deficiency are enriched for germline regulators. Examples include genes expressed in E13.5 germ cells and dependent on VitC for their proper expression, such as Dazl or Sycp1, as well as regulators of meiosis not expressed robustly until later in development, such as Spo11 or Sohlh2 (Fig. 4d). These VitC-dependent germline regulators are classified as loci targeted for active demethylation3 (Fig. 4d). Distal DMRs are enriched for Transposable Elements (TEs), specifically of the LINE1 and ERVK/IAP families, which display methylation gains (Fig. 4e, Extended Data Fig. 7d). An unbiased analysis of the DNA methylation status in TEs, regardless of whether they are called differentially methylated or not, revealed mild but significant trends towards gains of DNA methylation (Extended Data Fig. 7e). These results document that VitC deficiency leads to accumulation of DNA methylation at meiosis regulators and TEs in the embryonic germline, in both cases mimicking the defects observed in Tet1−/− germ cells8,18. A recent study documented that Tet1 is required for maintaining, rather than driving, DNA demethylation in the germline18. Hill et al.18 defined a critical set of germline and meiosis regulators, called germline reprogramming-responsive (GRR) genes, that undergo DNA demethylation in the embryonic germline and depend on Tet1 for maintenance of their DNA demethylated state and proper induction. In agreement, we found that this set of GRR genes displays significantly elevated levels of promoter DNA methylation and lower expression levels in VitC-deficient female germ cells (Fig. 4f, g). Further corroborating the requirement of VitC for optimal Tet activity in vivo, hmC levels are sharply reduced in brain and liver samples from VitC-deficient E13.5 embryos, relative to controls (Extended Data Fig. 7f, g).
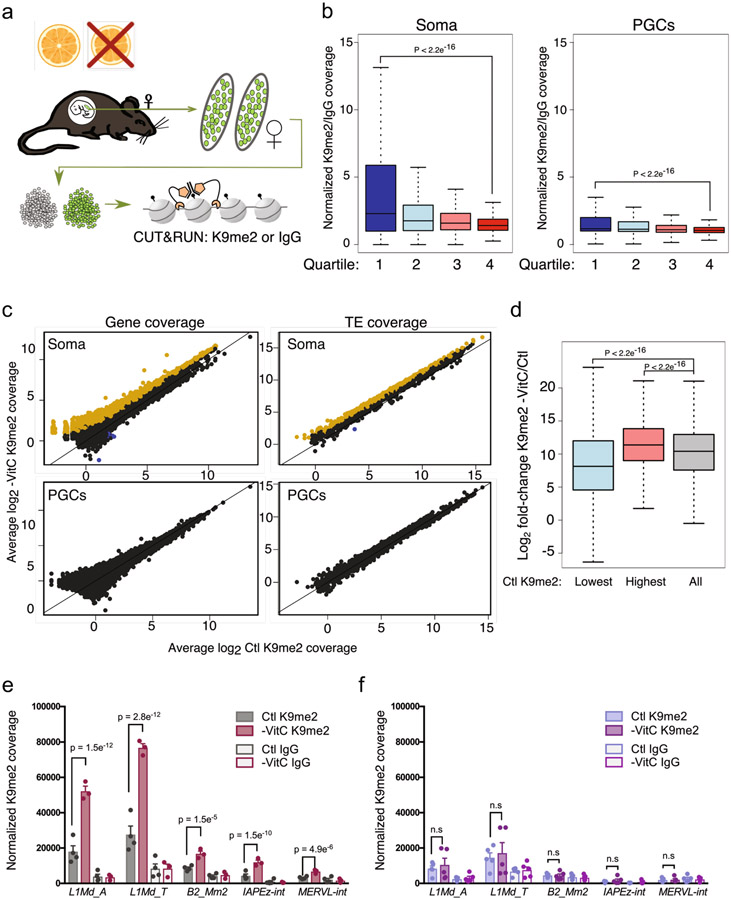
Finally, we explored the potential impact of VitC deficiency on the genome-wide pattern of H3K9me2, because VitC promotes Kdm3a/b-mediated demethylation of H3K9me2 in ES cells21, and the overall levels of this histone modification are sharply lost specifically in PGCs within the same time frame as DNA demethylation22. VitC deficiency induces up-regulation of H3K9me2 in E13.5 gonadal soma at both genes and TEs (Extended Data Fig. 8a-c), although this does not lead to any changes in their transcriptome (Fig. 1g). In contrast, the loss of VitC does not detectably affect the globally demethylated state of germ cells for this mark (Extended Data Fig. 8c, e, f).
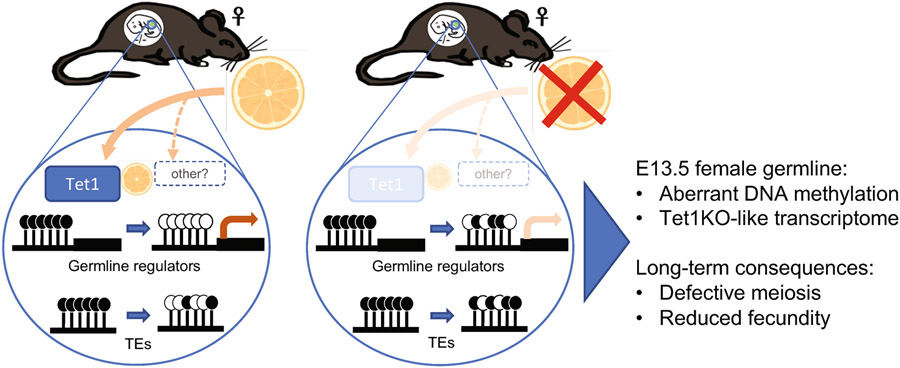
The present study documents the extensive parallels between gestational VitC deficiency and the Tet1 mutation with regards to germline reprogramming, transcriptional profile, meiosis and fecundity (Extended Data Fig. 9). VitC-deficient embryos display germ cell loss earlier than Tet1 mutants8. It is possible that VitC also regulates the activity of Tet2, which is also expressed in PGCs, albeit at lower levels than Tet1 (Extended Data Fig. 5b). In addition, VitC deficiency may impact other intercellular processes and epigenetic layers in germ cells, although no detectable defects were found in H3K9me2. Our results highlight that a nutritional deficit can to a large extent recapitulate a genetic mutation with a central role in epigenetic reprogramming and mammalian reproduction.
Errors in meiosis are the leading cause of miscarriage in human reproduction. It is notable that Tet enzymes receive a diversity of inputs from the cell’s metabolic state11-15. We propose that the interconnectivity of Tet1 with metabolism and maternal nutrition during germline development, rather than being a liability, provides a mechanism for adjusting the investment on reproduction across generations to the abundance of key nutrients in the environment. Of potential evolutionary interest is the fact that most animals can synthesize their own VitC, but certain vertebrate species, including humans, have lost that ability23. Moreover, oxidative stress induced by environmental contaminants can lead to oxidation of VitC24-29. Given the sensitivity of Tet1 and VitC to metabolic and environmental inputs, it will be important to determine the epigenetic impact of climate change and environmental contamination on reproduction.
Methods
Mouse model for gestational Vitamin C deficiency
Gulo−/− mice16 were obtained from the UC Davis Mutant Mouse Resource & Research Center (strain B6.129P2-Gulotm1Mae/Mmucd, RRID:MMRRC_000015-UCD) and bred with Oct4/EGFP mice17 to establish a homozygous Gulo−/−;Oct4/EGFP colony on a C57BL/6 background. All mice were supplemented with 3.3g/L L-Ascorbic Acid (Sigma-Aldrich #A92902) in their drinking water, refreshed weekly. Experimental (-VitC and Ctrl) females were maintained on a custom mouse chow devoid of Vitamin C (Teklad Custom Rodent Diet number TD.130707). Like humans, Gulo−/− mice are fully dependent on diet for Vitamin C due to a mutation in the L-gulonolactone oxidase gene. With proper Vitamin C supplementation in the drinking water, these mice are viable, fertile and indistinguishable from their heterozygous or wildtype littermates16,30. In agreement with previous reports30, we found that it takes about 7 days of withdrawal for Vitamin C to become essentially undetectable in the blood plasma of pregnant Gulo−/− mice (Extended Data Fig. 1b). In order to obtain sufficient mice for analysis, females were depleted of vitamin C for 3 days prior to exposure to a male, and the plugging was allowed to happen between days 3 and 7 (mice were separated the morning of plug detection or at day 7 if no plug was detected). This was to ensure that, at the time of fertilization, females have at least a 50% reduction in their serum levels of Vitamin C, which become undetectable after 7 days (Extended Data Fig. 1b). We do not detect differences that correlate with the timing of depletion prior to fertilization, perhaps because the key impact of Vitamin C deficiency in this context is post-implantation (Extended Data Fig. 6). Information on the specific days of depletion for the RNA-seq and RRBS-seq samples is provided in Supplementary File 4. Pregnant females remained on non-supplemented water through day 13.5 of gestation (E13.5) with morning of observed vaginal plug denoted as E0.5. All pregnant mice (Ctrl and -VitC) were supplied with fresh Vitamin C supplemented water at E13.5 and were visually indistinguishable. Vitamin C is undetectable in E13.5 Vitamin C-deficient embryos, whereas it is robustly detected in controls (Extended Data Fig. 1c). In the case of the Vitamin C re-addition paradigm described in Extended Data Fig. 6, the goal was specifically to test the role of Vitamin C availability in the first wave of DNA demethylation during pre-implantation as it pertains to PGC development. To this end, a longer removal window, 7 to 10 days, was carried out to ensure full depletion of Vitamin C by the time of fertilization and Vitamin C was re-supplied at the end of the first wave of DNA demethylation (blastocyst stage, E3.5). In all our analyses, female progeny of Vitamin C-depleted mothers were compared to genetically identical controls supplied with physiological levels of Vitamin C throughout development (Fig. 1a). For fecundity tests, we then crossed wildtype males to -VitC or Ctrl F1 females at 20-25 weeks of age, the period of peak female fertility in the C57Bl/6 strain31. Experiments were performed in accordance with the guidelines of the UCSF Institutional Animal Care and Use Committee. We have complied with all relevant ethical regulations. Sample size choice was not predetermined but was based on prior experience in the labs involved. Randomization or blinding was not performed.
Measurement of circulating maternal Vitamin C
After deep isoflurane anesthesia, blood was collected from the vena cava of pregnant female mice using a syringe. ~1mL of blood was allowed to clot for 30min at room temperature in a 1.5 mL Eppendorf tube. Clotted blood was centrifuged at 10,000 rpm for 10min. Serum was collected and immediately stored at −80 or processed using a colorimetric Ascorbic Acid Assay Kit (Sigma-Aldrich MAK074-1KT) according to manufacturer’s protocol.
Measurement of Vitamin C in embryonic tissue
VitC tissue concentrations were quantified according to a previously published method32. Briefly, extraction buffer containing 1mM EDTA and 5 nmoles 13C-labeled Vitamin C (ascorbate) standard (Cambridge Isotope Laboratories CLM 3085-0.05) in 80% methanol was prepared on dry ice. E13.5 embryonic forebrains and livers were dissected and weighed, taking 5-20 mg of tissues for the extraction and kept immediately on dry ice. 500μl of cold extraction buffer was quickly added to each sample which was then crushed with a small pestle. The suspension was vortexed for 1 minute to lyse the cells and centrifuged at 13000 rpm for 15 minutes at 4°C. The supernatant was dried in a speedvac (Thermo), resuspended in 0.03% formic acid +1 mM EDTA in water and centrifuged at 13000 rpm for 15 minutes at 4°C. The supernatant was analysed using liquid chromatography-tandem mass spectrometry (LC-MS/MS). A Nexera Ultra High Performance Liquid Chromatograph (UHPLC) system (Shimadzu) was used with a Scherzo SM-C18 column (Imtakt). Mobile Phase A was 0.03% formic acid in water. Mobile Phase B was 0.03% formic acid in acetonitrile. The flow rate was 0.5 ml/min, the column was at 35°C and the samples in the autosampler were at 4°C. Mass spectrometry was performed with a triple quadrupole mass spectrometer (AB Sciex QTRAP 5500) in multiple reaction monitoring (MRM) mode. Chromatogram peak areas were integrated using Multiquant (AB Sciex).
Isolation of germ cells
Dissections were performed on day E11.5, E13.5, E14.5 or E18.5, depending on the experiment, after euthanasia of pregnant females under deep isoflurane anesthesia. Embryonic gonads were dissected in sterile cold PBS and immediately fixed or dissociated for further analyses. Embryonic ovaries were enzymatically digested in 0.5% Trypsin and 0.8 mg/mL DNAse I (Worthington) at 37°C for 3-5 minutes, then manually dissociated by pipetting. PGCs and matched somatic cells were isolated by FACS on an Ariall instrument (BD Biosciences) based on GFP and SSEA1 expression. PGCs and soma were sorted directly into RLT lysis buffer or PBS, for downstream RNA or DNA extraction respectively, and immediately frozen on dry ice.
qRT-PCR
RNA was extracted using RNeasy micro columns (Qiagen) and cDNA generated using a High Capacity cDNA Reverse Transcription kit (ABI) according to manufacturer’s protocol. qRT-PCR was performed on an ABI-Prism PCR machine with primers listed in Supplementary File 2. The relative amount of each gene was normalized using two housekeeping genes (Rpl7 and Ubb).
Histology and Immunohistochemistry
E14.5 ovaries were fixed with Bouin’s fluid (for haematoxilin/eosin staining) or 4% formaldehyde (for immunohistochemistry) for 45 minutes and dehydrated through an ethanol series, embedded in paraffin and cut into 5μm-thick sections. Sections were mounted on glass, dewaxed, rehydrated and stained with haematoxilin and eosin. Meiotic staging was based on nuclear shape and chromatin compaction as previously described 33-35. The Histolab analysis software (Microvision Instruments, Evry, France) was used for counting.
For immunohistochemistry, tissue sections were mounted on glass slides, dewaxed, rehydrated and submitted to antigen retrieval by boiling for 20 min in citrate buffer (pH 6). Endogenous peroxidase activity was blocked by a 10-minute incubation with 3% hydrogen peroxide. Slides were then washed in PBS and blocked for 30 minutes in 2% horse serum in PBS. Slides were incubated overnight at 4°C with primary antibody diluted in PBS with 20% blocking buffer containing 2.5% of horse serum. Peroxidase-conjugated secondary antibodies (ImmPRESS reagent kit, Vector Laboratories) were incubated for 30 minutes, followed by 3,3′-diaminobenzidine (DAB substrate reagent kit, Vector Laboratories) or VIP (Vector VIP substrate reagent kit, Vector Laboratories) reactions. Three sections were randomly chosen from each gonad to quantify the percentage of DDX4/Vasa+ (Abcam Ab13840 Rabbit 1:200 or Ab27591 Mouse 1:500) germ cells co-stained for Stra8 (Abcam Ab49602 Rabbit 1:400) or Sycp3 (Abcam Ab97672 Mouse 1:500). At least 200 Ddx4+ germ cells were scored per section. Additional immunohistochemistry (IHC) stainings represented in Extended Data include Foxl2 (ThermoFisher PA1-802 1:200), AMH (SantaCruz SC-6858 1:200) and ki67 (550609 BD pharmingen 1:200) antibodies.
Centromere staining in meiotic spreads
Glass slides were prepared by submerging in 70% ethanol while E18.5 ovaries were dissected and prepared. Freshly dissected E18.5 ovary pairs were dissociated in 200μl of enzymatic solution (0.025% Trypsin; 2.5mg/mL Collagenase; 0.1mg/ml DNase I) 37°C for 30 minutes, pipetting every 10 minutes. Trypsin was quenched with 50μl FBS and 250μl hypotonic buffer (30mM Tris pH 8.2; 50mM sucrose; 17mM Sodium-citrate; 5mM EDTA; 0.5mM DTT; 0.5mM PMSF) was added to each sample for 30 minutes at room temperature. The cell suspension was centrifuged at 1000 rpm for 10 minutes. The pellet was resuspended in 90μL 100mM Sucrose. At this point, slides were dried of ethanol and prepared with fixative solution (1% PFA; 0.15% Triton X100; 3mM DTT). Aliquots of cell suspension (20μL) were added to each drop of fixative solution per slide and allowed to dry at room temperature. Dried slides were quickly submerged in 0.4% Kodak Photo-Flo 200 and air dried. Meiotic spreads were stored at −80°C until staining.
Slides containing E18.5 female germ cell spreads were allowed to thaw for 15 minutes at room temperature before staining. Thawed slides were washed twice in PBS then permeabilized in PBS plus 0.2% triton for 20 minutes at room temperature. Next, spreads were blocked in a buffer containing PBS plus 5% BSA and 0.1% Tween (PBSST) for 45 minutes. The primary antibodies for Sycp1 (Abcam Ab15090) and CREST (Antibodies Incorporated #15-234-0001) were incubated at a 1:400 dilution overnight in a 4°C humidity chamber. On day two, slides were washed in PBSST 3 times for 10 minutes each and blocked in PBSST plus 10% donkey serum for 30 minutes. The slides were incubated in secondary antibodies (Alexa Fluor 488 donkey anti-rabbit IgG, Alexa Fluor 647 AffiniPure donkey anti-human IgG cat# 709-605-149) for 1 hour in the dark. Slides containing immunofluorescent stained meiotic spread were then washed for a final time (PBSST 3 x 10 minutes at room temperature in the dark) before mounting with Vectashield + DAPI and imaging on a Leica confocal.
Whole-mount imaging
Whole-mount immunostaining and confocal imaging of postnatal day 7 ovaries were previously described36. The primary antibody used was Nobox (1:100, a gift from Aleksandar Rajkovic) and the stain Hoechst (1:100, Fisher H3569). The secondary antibody used was Alexa-555 Donkey anti-Goat from Fisher and used at 1:200. Whole-mount ovaries were imaged using the Leica DMi8 confocal microscope, using a 20x objective. Imaris software (Bitplane) was used to quantify Nobox objects. An Imaris surface was created around entire ovary to exclude oviduct and surrounding tissue and channels were masked to this surface for analysis. The ovary volume was generated from this Imaris surface contour. Images were filtered using Background Subtraction with a 30um filter and Gaussian Filter 1 voxel size. Nobox objects were quantified using the Imaris spot module with a diameter of 8 um and all spot objects were selected.
Statistical analyses
All statistical calculations were performed with GraphPad Prism 7.0 software or within R studio. Details of individual tests are outlined within each figure legend.
RNAseq
Germ cell RNA isolated from single embryos was quantified using an Agilent Bioanalyzer RNA Pico Kit. Barcoded libraries were created from 1.5 ng DNAseI-treated total RNA using Clonetech SMARTR-seq RNA library prep kit according to the manufacturer’s recommendations. Successful libraries were bioanalyzed for quality and size distribution and then quantified using the Qubit dsDNA HS Assay Kit. Diluted libraries were pooled at equal 5nM concentrations for sequencing. Final product was sequenced 50bp SE on 1 lane of an Illumina HiSeq4000 at the UCSF Center for Advanced Technology. Six embryos were sequenced per condition, totaling 12 libraries in all. 25-40 million reads were obtained and analyzed per sample. Single-end reads were quality-controlled and adaptor-trimmed using Trim Galore! (Babraham Bioinformatics). Filtered reads were mapped to the mm9 mouse genome utilizing Tophat237. Reads mapping uniquely to known genes were counted using htseq-count38. Count data were subsequently imported into R with Bioconductor39 and filtered to remove non-expressed genes. For read-depth normalization, filtered gene count data were analyzed using the R package DESeq240. Data were input into a DESeq object and normalized according to package recommendations. Gene Ontology term enrichment was analyzed using DAVID41, and comparisons to the data on Tet1−/− E13.5 germ cells8 were carried out using GSEA42.
Reduced Representation Bisulfite Sequencing (RRBS) on single embryo PGCs
We modified previously published protocols for RRBS and scRRBS43,44 to create a streamlined single-tube workflow for low-input. Each RRBS library was created from 2ng of gDNA collected from PGCs isolated by FACS from single E13.5 embryos. Initially, gDNA was extracted from Oct4/EGFP PGCs using Purelink Genomic DNA kit (K1820-00 Invitrogen) according to the manufacturer’s instructions. 2ng gDNA + 0.25% Lambda DNA were then digested with 10 units of MspI enzyme (Fermentas) in a total reaction volume of 18μL at 37°C for 3 hours, followed by heat inactivation at 80°C for 20 minutes. End repair and A-addition was then carried out to repair and tail the 3’ end of each digested fragment. This reaction was done immediately following MspI digestion by adding 2uL of 5U Klenow exo- with additional dNTPs (0.04mM dATP, 0.004mM dGTP, 0.004mM dCTP) directly to the 18μL digest. This reaction was incubated at 37°C for 40 minutes followed by heat inactivation at 75°C for 15 minutes. After repair, NEBnext USER methylated adaptors were ligated onto the DNA by adding 25 units of T4 DNA Ligase, 1.5mM ATP, and 25nM NEB Adaptors directly to the 20μL reaction, giving a final reaction volume of 30μL. Adapter ligation was performed at 16°C for 30 minutes and then left at 4°C overnight. The following day, 1μL of NEB USER enzyme was added to each reaction, followed by an incubation at 37°C for 15 minutes and then inactivation at 65°C for 20 minutes. Per the manufacturer’s protocol, NEB USER enzyme is required for NEBnext adapter cleavage.
Bisulfite conversion was performed on each 30μL sample containing DNA fragments with methylated sequencing adapters. We used the low-concentration protocol of the EpiTect Fast Bisulfite Conversion Kit (Qiagen), eluting in 15μL. 13μL of converted DNA were used directly in a library amplification PCR, which was optimized for 2ng input, including 1μL NEBNext Primer F, 1μL NEBNext R, and 15μL of 2x HiFi Uracil+ Mix (KAPA). This reaction was incubated at 95°C for 2 minutes, followed by 15 cycles of 95°C for 20 seconds; 60°C for 30 seconds; 72°C for 1 minute, with a final step of 72°C for 5 minutes and a hold at 4°C. At this point all samples were quantified using the Qubit dsDNA HS Assay Kit.
Successfully amplified libraries were completed with size selection and cleanup. Size selection of 200-600bp fragments was performed using Axygen Fragment Select-I beads. First, 0.5 volume of beads (15μL) was added to the 30μL sample, pipetted to mix, and incubated at room temperature for 5 minutes. The bead-sample solution was then magnetically separated and 45uL of supernatant was placed in a clean strip-tube. An additional 10μL of beads were then added to each 45μL sample for collection. After a 5-minute incubation, beads were magnetically recovered and washed twice in 80% ethanol. Size selected libraries were eluted off the beads with 20μl ddH2O. Completed libraries were then quantified in an Agilent Bioanalyzer using the High Sensitivity DNA Assay, and diluted to 10nM. Libraries were pooled and sequenced at the UCSF Center for Advanced Technology on an Illumina HiSeq4000 sequencer with adequate PhiX spike-in DNA (~30%). 13-20 million reads were obtained and analyzed per sample.
RRBS Data Analysis
RRBS fastq files were first trimmed for quality and MspI-induced overhangs using Trim Galore! (Babraham Bioinformatics) with RRBS specific settings. Trimmed files were then aligned to the mouse mm9 genome and methylation extracted using Bismark, a program specific for alignment of bisulfite-treated DNA45. Given the very low genome-wide methylation in E13.5 PGCs (<5% total methylation, Extended Data Fig. 5a), the R program BiSeq46 was determined most appropriate to detect differential methylation. BiSeq is a DMR-detecting method that enables testing within target regions, like with RRBS, and allows calculation of FDR. Coverage and methylation calls per CpG calculated with Bismark were imported into RStudio, and these files were then used to build the BiSeq data-frame, accounting for replicates. Coverage data was filtered with requirements of >5x coverage in a minimum of 9/12 samples per CpG. Each sample contained 1.3 – 1.6 million CpGs passing this coverage threshold. CpGs were categorized into clusters, with a cluster defined as a string of >5 CpGs with a maximum of 20bp distance between adjacent CpGs. 52707 clusters were defined across the mouse genome ranging from 10 to 370bp per cluster (53bp average cluster size). Functional annotation of DMRs was done using GREAT47. Tet1-binding sites in ES cells were taken from 48 and Dnmt1-targeting sites in ES cells were taken from49. TE genomic locations were downloaded from UCSC RepeatMasker for TE-methylation analysis.
hmC quantification
E13.5 forebrain and liver were dissected and DNA was extracted using the DNeasy Blood and Tissue kit (Qiagen). DNA hydroxymethylation was measured by ELISA using the Global 5-hmC DNA Quantification Kit (Active Motif) according to the manufacturer’s protocol. 50ng were used for the quantification.
For hmC quantification by dot blot, 30ng of DNA extracted from tissues was spotted onto a nylon membrane (GE Healthcare Hybond-N+). The membrane was dried and baked at 80°C for 2h, before being blocked in 5% (w/v) non-fat dry milk in PBS + 0.1% Tween-20 for 1h. The membrane was then transferred into blocking solution supplemented with rabbit anti-hmC antibody (Active Motif 39791) diluted 1:1000 and incubated overnight at 4°C. Thereafter, it was washed 3 times with PBS + 0.1% Tween-20 for a total of 30 min. The membrane was transferred into blocking solution supplemented with HRP-linked anti-rabbit IgG (Jackson ImmunoResearch 111-035-144) diluted 1:10,000 before incubation for 1h at room temperature followed by 3 washing steps with PBS + 0.1% Tween-20. Peroxidase activity was detected with Pierce ECL Western Blotting Substrate (Thermo Fisher Scientific) using the ChemiDoc MP Imaging Syste (Bio-Rad). Specificity of the anti-hmC antibody was assessed using amplicons produced by PCR with the DreamTaq DNA Polymerase (Thermo Fisher Scientific), according to manufacturer’s protocol, using dNTPs with unmodified cytosines (Zymo Research, D1000-1), methylated cytosines (Zymo Research, D1030), or hydroxymethylated cytosines (Zymo Research, D1040).
Low input CUT&RUN
CUT&RUN experiments were performed on samples of 1000 nuclei isolated from FACS-purified E13.5 gonadal PGCs and soma according to Hainer et al50, originally developed by Skene et al51. Maintenance of pregnant Gulo−/− females and E13.5 gonadal dissections were performed as described above. FACS was utilized to isolate 2000 PGCs or soma from control or VitC deprived E13.5 female embryos per sample, sorting directly into chilled PGC media (DMEM, 15% FBS, 100 U/ml LIF, 5μM Forskolin, 1ng/ml SCF). For VitC-deprived PGC samples multiple embryos were pooled if needed at sorting, due to an overall lower PGC number per embryo, to allow collection of sufficient PGCs per sample. Following FACS, DMSO was added to cells in PGC media at a final concentration of 10% and the cells cryopreserved until sufficient samples were collected for all CUT&RUN experiments. CUT&RUN was performed with 3-4 (soma) or 5 (PGC) control or VitC-depleted samples from independent embryos across multiple litters. We performed CUT&RUN closely following the instructions as set out in Hainer et al50, with 1000 nuclei per IP. Briefly, gonadal soma or PGC samples were rapidly thawed and washed 3 times in NE buffer (20mM HEPES-KOH pH 7.9, 10mM KCl, 0.5mM fresh Spermidine, 0.1% Triton X-100, 20% glycerol, plus protease inhibitors) to isolate nuclei, which were bound to Concanavalin A-coated magnetic beads pre-washed in binding buffer (20mM HEPES-KOH pH 7.9, 10mM KCl, 1mM CaCl2, 1mM MnCl2). Nuclei samples were blocked for 5 min in blocking buffer (20mM HEPES pH 7.5, 150mM NaCl, 0.5mM Spermidine, 0.1% BSA plus 2mM EDTA), then split into two (for K9me2 or IgG), before proceeding to antibody incubation. Samples were resuspended with H3K9me2 (Active motif Cat# 39239) or Rabbit IgG antibodies (Cell Signaling Cat# 2729) at a final dilution of 1:100 in 200μL wash buffer (as blocking buffer, without EDTA) and rotated for 2h at 4oC, washed twice in wash buffer, then incubated with pA-MN fusion protein for 1h at 4oC at a final dilution of 1:200 in wash buffer. Samples were next equilibrated to 0oC in a metal hot-block which was pre-chilled by submersion in wet ice, then the pA-MN activated by addition of 2mM CaCl2. Cleavage was allowed to proceed for exactly 30min at 0oC before stopping with an equal volume of 2XSTOP buffer (200mM NaCl, 20mM EDTA, 4mM EGTA, 50ug/mL RNase A, 40ug/mL glycogen, 10pg/mL yeast MNase-treated nucleosomal spike-in DNA). The same 2XSTOP solution minus RNase A was used for both PGC and soma CUT&RUN experiments, to allow direct comparison between cell types and antibodies. Finally, cleaved DNA fragments were released by incubation at 37oC for 20min, followed by centrifugation and collection of the supernatant containing released DNA fragments to new tubes. DNA was isolated using QIAGEN PCR Purification kits, eluting the purified DNA twice in the same 30μL 0.1X TE buffer. The entire eluate was used for library generation with the Hyper Prep Kit (KAPA), according to the Manufacturer’s instructions for inputs < 1ng, and 18 cycles of PCR amplification. At the end of the library generation protocol, excess adapter dimers were removed via an extra 0.85-0.9X Ampure XP bead clean-up step. All libraries were verified for quality and concentration with Bioanalyzer DNA HS assays, before pooling all PGC and soma samples for sequencing.
CUT&RUN sequencing and bioinformatics
Paired-end sequencing (PE150) was performed at the UCSF CAT core, and reads were processed and normalized according to Skene et al51. Raw fastq reads were quality-controlled and adaptor-trimmed using “Trim Galore!” (Babraham Bioinformatics), using standard settings, then mapped to mm10 with Bowtie2 and settings --local --very-sensitive-local --no-unal --no-mixed --no-discordant --phred33 -I 10 -X 1000, or to the yeast (S.cerevisiae) genome with settings --local --very-sensitive-local --no-unal --no-mixed --no-discordant --phred33 -I 10 -X 700 --no-overlap --no-dovetail. We noted lower than expected mapping efficiencies especially for PGC samples, which may have arisen from an overall very low H3K9me2 abundance in these cells (Extended Data Fig. 8b). Successfully mapped mouse and yeast reads were deduplicated with Picard MarkDuplicates as recommended for low input numbers, prior to downstream analyses. For comparison between distinct conditions and cell-types, total mapped reads were normalized to the number of mapped, deduplicated spike-in reads per sample. To compare and quantify H3K9me2 enrichment across samples and conditions at individual loci, reads were summarized across gene bodies or TE families using RSubread package, FeatureCounts in R/Bioconductor, normalized to spike-in reads, and presented as 1000 * normalized coverage/spike-in. For determination of differentially H3K9me2-enriched genes or TEs, we utilized our previously-described spike-in normalization method52 and the Limma Voom package53, where we used mapped deduplicated yeast read counts as normalization factors. Differential genes or TEs were called as those exceeding log2FC > ∣1∣ and FDR < 0.05. For correlation analyses between H3K9me2 enrichment and gene expression, we used female E13.5 control PGC and soma normalized RNA-seq expression values generated in this study.
Data availability
RNA-seq, RRBS, and CUT&RUN data have been deposited in Gene Expression Omnibus (GEO) under accession number GSE109747.
Code availability
Custom codes used for data analysis were deposited in Github and are also available upon request: https://github.com/Santosi/VitC-PGCs
Extended Data
Extended Data Figure 1 ∣.
Validation of Vitamin C depletion and the down-regulation of Tet1- dependent germline genes in a mouse model of gestational Vitamin C deficiency.
a, Expression of Vitamin C transporters in developing female germ cells. Data from Seisenberger et al3.
b, Kinetics of Vitamin C depletion from the serum of pregnant Gulo−/− mice after withdrawal from their drinking water. Pregnant females were removed from Vitamin C supplementation at E3.5 and circulating blood serum was tested over the time-course indicated. It takes 5 days of withdrawal for the circulating Vitamin C levels to be <25%, and 7 days to be essentially undetectable. Line plot connects the average blood serum values of n=3 biological replicates.
c, Vitamin C levels measured by MS in E13.5 embryonic tissue with and without gestational Vitamin C removal. E13.5 female head or liver were normalized by tissue weight. Samples with non-detectable Vitamin C were set to zero. Statistical significance is measured by two-tailed t-test with Welch’s correction on n=5 biological replicates per condition. Error bars depict mean ± SEM.
d, The reduction in E13.5 female germ cells numbers upon Vitamin C deficiency is confirmed using both Oct4/EGFP and SSEA1 positivity. Statistical significance is measured by two-tailed t-test with Welch’s correction on n=6 matched biological replicates per condition. Error bars depict mean ± SD.
e, Gestational Vitamin C deficiency does not affect average somatic cell number. Statistical significance is measured by two-tailed t-test with Welch’s correction on n=13 control and n=10 Vitamin C deprived biological replicates. Error bars depict mean ± SD.
f, Vitamin C-deficient E13.5 female germ cells express lower levels of key germline genes, as measured by qRT-PCR. Error bars depict mean ± SD of n=3 control and n=4 –VitC biological replicates. Statistical significance assessed by two-tailed Student’s t-tests. The variability in Strat8 levels in controls as assessed by qRT-PCR at E13.5 is due to the fact that it is just being induced at this stage; RNA-seq and IF data further document the significant reduction in Stra8 RNA and protein levels in Vitamin C deficient PGCs (Extended Data 2a).
g, Expression of select germline genes are induced in a Tet1/2-dependent manner upon Vitamin C addition to cultured mouse ES cells11. Gene expression was measured by qRT-PCR and error bars represent the mean ± SD of technical triplicates.
h, Decreased expression of select germline genes in Tet1−/− E13.5 germ cells as measured by RNAseq. Data from8, averages of 3 controls and 2 Tet1−/− samples.
i, Select germline genes induced by Vitamin C in cultured ES cells (c) and down-regulated in Tet1−/− germ cells (d) are also found down-regulated in -VitC E13.5 germ cells. Gene expression was measured by RNAseq. Error bars depict mean ± SEM of 6 biological replicates.
j, Gestational Vitamin C deficiency does not affect transcription in the somatic cells of E13.5 female gonads as shown by unsupervised clustering of RNA-seq. Clustering preformed on n=6 biological replicates per condition.
Extended Data Figure 2 ∣.
Analyses of gonad development upon Vitamin C deficiency.
a, There is an overall normal induction of key markers of developmental progression of somatic cells of the ovaries between E11.5 and E13.5 in Vitamin C-deficient embryos, as measured by qRT-PCR. E13.5 somatic ovary cells are matched with PGCs in Extended Data Fig. 1f. In this analysis, Foxl2 expression is strongly induced upon Vitamin C deficiency, but to a slightly lower extent than in control samples. However, no significant changes in Foxl2 were detected by RNA-seq (Fig. 1f) or IF (b). Error bars of E13.5 samples depict mean ± SD of 4 biological replicates. Bars of E11.5 samples represent minimum and maximum measurements.
b, Sexual differentiation is controlled by a balance between Sox9 (leading to AMH expression) in male and Foxl2 in female. Expression of Foxl2 in E14 and E18 ovaries (O14 and O18, respectively) does not change with Vitamin C-deficiency as measured by IHC. As expected, Foxl2 was not detected in E14 testis (T14). Images are representative of n=5 control and n=4 - VitC ovaries and n=2 control and n=3 -VitC testes.
c, Expression of AMH in E14 testis does not change with Vitamin C-deficiency as measured by IHC. As expected, AMH was not detected in E14 or E18 ovaries. Images are representative of n=5 control and n=4 -VitC ovaries and n=2 control and n=3 -VitC testes.
d, Gestational Vitamin C deficiency does not affect the presence of Leydig cells (3BHSD) in developing testis or the absence of Leydig cells in developing ovaries. Images are representative of n=5 control and n=4 -VitC ovaries and n=2 control and n=3 -VitC testes.
Extended Data Figure 3 ∣.
Detailed analyses of meiotic staging in germ cells of E14.5 Vitamin C-deficient ovaries.
a, Representative images of STRA8 and SYCP3 abundance in E14.5 control or Vitamin C-deficient female germ cells. Images are representative of n=7 STRA8 and n=8 SYCP3 biologically independent stainings, as indicated in (b) and (d).
b, Significant reduction in the percentage of DDX4+ germ cells that are Stra8+ upon Vitamin C deficiency. Error bars depict mean ± SEM. Statistical significance assessed by two-sided Mann-Whitney test.
c, Stra8 mRNA abundance is significantly reduced at E13.5 measured by RNA-seq. Centre line represents the mean of n=6 biological replicates. Statistical significance assessed by Wald Chi-Squared test.
d, Vitamin C-deficient E14.5 female germ cells display a trend towards reduction in the percentage of Ddx4+ germ cells that are Sycp3+. Error bars depict mean ± SEM. Statistical significance assessed by two-sided Mann-Whitney test.
e, Sycp3 mRNA abundance is significantly reduced at E13.5 measured by RNA-seq. Centre line represents the mean of n=6 biological replicates. Statistical significance assessed by Wald Chi-Squared test.
f, Representative haematoxilin/eosin staining of E14.5 embryonic ovaries for data quantified in Fig. 1h. Black arrowheads indicate germ cells at the indicated stage of meiosis. Images are representative of n=8 biologically independent stainings.
g, The percentage of germ cells in meiotic S phase vs post-S phase is significantly higher in - VitC E14.5 females, relative to controls. Additional analysis of data from meiosis staging shown in Fig. 1h. Statistical significance assessed by the Chi-square test of n=8 biologically independent experiments.
h, Representative images of E18.5 CREST-SYCP1 staining for Fig. 1h.
i, Ovarian follicle volume and frequency is not significantly change in in postnatal day 7 (PD7) females deprived of Vitamin C in utero. Ovarian follicles are stained by Nobox and quantified using whole-mount imaging. Error bars depict mean ± SD of n=6 control and n=9 vitamin C depleted stainings.
Extended Data Figure 4 ∣.
Analyses of the effects of Vitamin C deficiency on male germ cell development.
a, Unlike the consistent reduction of female germ cells, Vitamin C deficiency does not decrease the number of germ cells in E13.5 male gonad. Statistical significance assessed by two-sided Welch’s t-test. Error bars depict mean ± SD of the indicated number of biological replicates.
b, The meiotic germ cell marker SYCP3 was not identified in n=2 or n=3 male gonads with or without Vitamin C depletion, respectively. Statistical significance of E14 female gonads assessed by two-tail Mann-Whitney test. Error bars depict mean + SEM of n=6 control and n=5 -VitC biological replicates.
c, The meiotic germ cell marker STRA8 was not identified in n=2 or n=3 male gonads with or without Vitamin C depletion, respectively. Statistical significance assessed by two-tail Mann-Whitney test. Error bars depict mean + SEM. Female graph includes n=6 biological replicates.
d, Most germ cells in developing testis are proliferative (ki67+), with a few quiescent (ki67-) germ cells, and no deviations from this pattern are detected with Vitamin C deficiency. Images are representative of n=2 control and n=3 -VitC biological replicates.
Extended Data Figure 5 ∣.
Further analyses of RNA-seq data from Vitamin C-deficient E13.5 female germ cells.
a, Table of RNAseq samples and number of germ cells per sample. Each sample represents germ cells from a single E13.5 female.
b, Unsupervised hierarchical clustering of n=6 biological replicates in each condition documents the overall separation between Ctrl and -VitC samples (columns) and relative gene expression (rows).
c, Scatterplot of differential gene expression in Vitamin C-deficient E13.5 female PGCs of genes called differentially expressed in E13.5 Tet1−/− female PGCs8. Spearman’s rho statistic is used to estimate a rank-based measure of association.
d, Expression of Dnmt and Tet genes in -VitC samples are similar to Ctrl samples. Error bars depict mean ± SD of n=6 biological replicates per condition. Statistical significance assessed by two-tailed Student’s t-tests.
e, Heatmap documenting the consistent expression of Tet and Dnmt genes across the 6 Ctrl samples and 6 -VitC samples.
f, Expression of other genes belonging to families of enzymes with the potential to be Vitamin C-sensitive (Kdm’s, collagen hydroxylases, HIF hydroxylases, etc). None of these displays differential expression in Vitamin C-deficient female germ cells. Error bars depict mean ± SD of n=6 biological replicates per condition. Statistical significance assessed by two-tailed Student’s t-tests.
Extended Data Figure 6 ∣.
Identification of the window of susceptibility to Vitamin C deficiency between E3.5 and E13.5.
a, Pregnant females mated in Vitamin C-deficient conditions were either maintained without Vitamin C (-VitC) or returned to Vitamin C-containing water at E3.5 (3.5 return).
b, Adding back Vitamin C from E3.5 to E13.5 tends to rescue the defects in the expression of key germline regulators induced with full Vitamin C deficiency. Gene expression was measured by qRT-PCR in E13.5 female germ cells. Error bars depict mean ± SEM of 4 biological replicates. Statistical significance assessed by two-tailed Student’s t-tests. * p<0.05; ** p<0.01.
c, The numbers of E13.5 Oct4/EGFP+ germ cells are mostly recovered with return of Vitamin C at E3.5. Normalized to germ cell count of the Ctrl embryos. Error bars depict mean ± SEM of n = 11 to 22 biological replicates of each condition as indicated in the graph. Statistical significance assessed by two-tailed Student’s t-test.
Extended Data Figure 7 ∣.
DNA methylation defects in E13.5 Vitamin C-deficient female germ cells.
a, Average methylation of cytosine according to sequence context. Genome-wide CpG methylation is 3-6% regardless of Vitamin C supplementation. Methylation of cytosine in a CHG or CHH context is below 1%.
b, Average methylation according to genomic context in Ctrl and -VitC samples. Floating box plots indicate min to max measurements of n=6 biological replicates with centre line at mean.
c, Top: density plot of 460 DMRs with a >5% methylation change reveals an overall increase in the number and magnitude of methylation gains over losses upon Vitamin C deficiency; bottom: GREAT analysis of 175 hypomethylated DMRs (hypermethylated DMRs are in Fig. 4b).
d, TEs of the LINE1 and LTR/ERVK/IAP families that are associated with DMRs show a consistent pattern of hypermethylation upon Vitamin C deficiency. Error bars depict mean ± SEM of 6 biological replicates. Statistical significance assessed by two-tailed Student’s t-tests.
e, Average methylation in Ctrl or -VitC samples in different TE families across the genome. Data are from all uniquely mapped TEs annotated by RepeatMasker and captured by RRBS, regardless of the DMR calls, based on 558 elements and 3180 CpGs (LINE1), 185 elements and 1065 CpGs (Full-length LINE1; >6Kb), 384 elements and 1724 CpGs (SINE), 568 elements and 2691 CpGs (ERVK), 226 elements and 1057 CpGs (ERVK-IAP), 10 elements and 73 CpGs (Satellite). The box extends to 25 and 75 percentiles with center line indicating the median TE methylation across n = 6 biological replicates. Error bars extend to 5 and 95 percentile. Statistical significance assessed by two-tailed Wilcoxon matched-pairs signed rank test.
f, hmC quantification by dot blot in E13.5 brain and liver indicate that hmC abundance is higher in brain and reduced with Vitamin C depletion. Each group represents 3 biological replicates (across) and 2 technical replicates (vertical pairs).
g, hmC quantification by ELISA (Active Motif) confirmed a significant decrease of hmC in both E13.5 brain and liver. Quantification was performed using 50ng of DNA. Error bars depict mean ±SEM of 5 biological replicates. Statistical significance assessed by two-sided Welch’s t-test.
Extended Data Fig. 8 ∣.
CUT&RUN analysis of H3K9me2 abundance in E13.5 female gonads.
a, Diagram of CUT&RUN experiments: E13.5 Ctl or -VitC gonads were dissociated and the PGCs and soma separated by FACS for cryopreservation and CUT&RUN analysis. PGCs and soma from 3-5 independent embryos per condition were subjected to H3K9me2 (K9me2) or control (IgG) CUT&RUN.
b, K9me2 enrichment is highest at non/low-expressed genes. Boxplots of average K9me2 coverage at genes in Control (Ctl) soma or PGC samples, separated into quartiles from lowest (quartile 1) to highest (quartile 4) expression level in Ctl E13.5 soma. Coverage is calculated from average (K9me2/IgG +0.001) of n=4 control and n=3 Vitamin C depleted soma replicates and n=5 PGC replicates per condition. P-values are two-sided Wilcoxon rank-sum test and box indicates 25 and 75 percentiles with center line marking the median value.
c, Scatter plots of average K9me2 coverage at genes or TE families in Ctl or -VitC E13.5 female soma and PGCs. Data is comprised of n=4 control and n=3 Vitamin C depleted soma replicates and n=5 PGC replicates per condition. Significantly upregulated (yellow) or downregulated (blue) genes or TE families are indicated (log2FC > ∣1∣, FDR < 0.05, Limma analysis, see Methods for statisticial test details).
d, Increases in soma K9me2 levels are highest at already K9me2-marked genes. Boxplot showing K9me2 log2FC upon -VitC depletion in soma in groups of genes ranked according to K9me2 enrichment in Ctl. Lowest: lowest quartile of K9me2 enrichment, Highest: highest quartile, All: all genes. P-values are two-sided Wilcoxon rank-sum test and box indicates 25 and 75 percentiles with center line marking the median value. Data is comprised of n=4 control and n=3 Vitamin C depleted soma replicates and n=5 PGC replicates per condition.
e-f, Histograms of K9me2 or IgG coverage at selected TE families in E13.5 female e) soma or f) PGCs. Error bars depict mean ±SEM of n=4 control and n=3 Vitamin C depleted soma replicates and n=5 PGC replicates per condition. P-values are Limma toptable FDR values. See Supplementary File 5 and Methods for statistical test details.
Extended Data Figure 9 ∣.
Model for the role of Vitamin C in DNA methylation reprogramming and development of the embryonic germline.
Embryonic germline cells require Vitamin C for proper DNA demethylation of key meiosis regulators and transposable elements. Gestational Vitamin C deficiency is compatible with development to term and adulthood, but induces a phenotype akin to a Tet1 hypomorph, with incomplete DNA demethylation and down-regulation of germline genes, reduced germ cell numbers, meiosis defects and decreased fecundity. Vitamin C deficiency may also impact other enzymatic reactions in the germline.
Supplementary Material
Acknowledgements
We thank Marco Conti, Robert Blelloch, Paolo Rinaudo, Matt Lorincz, Susan Fisher, Licia Selleri and members of the Santos Lab for input and critical reading of the manuscript. We thank Eric Chow and members of the UCSF Center for Advanced Technology for assistance with sequencing; Bikem Soygur for meiotic spread protocol and reagents; Yi Zhang and Li Shen for technical advice on RRBS. We are grateful for S. Henikoff for providing the pA-MN and yeast tRNA spike-ins, and to S. Henikoff and T. Fazzio for providing technical help with performing Cut&Run experiments. Flow cytometry data were generated in the UCSF Parnassus Flow Cytometry Core, which is supported by a Diabetes Research Center grant and NIH grant P30 DK063720. S.L.P. was supported by the National Science Foundation Graduate Research Fellowship Program under Grant No. 1650113. Any opinions, findings, and conclusions or recommendations expressed in this material are those of the authors and do not necessarily reflect the views of the National Science Foundation. G.L. was partly supported by Institut Universitaire de France. This work was supported by NIH grants R21ES023297 and R01ES028212 to D.J.L., and NIH grants R01OD012204 and R01GM123556, and a Canada 150 Research Chair to M.R.-S.
Footnotes
Supplementary Information is linked to the online version of the paper.
RNA-seq and RRBS data have been deposited in Gene Expression Omnibus (GEO) under accession number GSE109747.
The authors declare no competing financial interests.
References
- 1.Barker DJP The developmental origins of adult disease. J Am Coll Nutr 23, 588S–595S (2004). [DOI] [PubMed] [Google Scholar]
- 2.Boekelheide K et al. Predicting later-life outcomes of early-life exposures. Environmental Health Perspectives 120, 1353–1361 (2012). [DOI] [PMC free article] [PubMed] [Google Scholar]
- 3.Seisenberger S et al. The dynamics of genome-wide DNA methylation reprogramming in mouse primordial germ cells. Mol Cell 48, 849–862 (2012). [DOI] [PMC free article] [PubMed] [Google Scholar]
- 4.Hackett JA et al. Germline DNA demethylation dynamics and imprint erasure through 5-hydroxymethylcytosine. Science 339, 448–452 (2013). [DOI] [PMC free article] [PubMed] [Google Scholar]
- 5.Gkountela S et al. DNA Demethylation Dynamics in the Human Prenatal Germline. Cell 161, 1425–1436 (2015). [DOI] [PMC free article] [PubMed] [Google Scholar]
- 6.Guo F et al. The Transcriptome and DNA Methylome Landscapes of Human Primordial Germ Cells. Cell 161, 1437–1452 (2015). [DOI] [PubMed] [Google Scholar]
- 7.Tang WWC et al. A Unique Gene Regulatory Network Resets the Human Germline Epigenome for Development. Cell 161, 1453–1467 (2015). [DOI] [PMC free article] [PubMed] [Google Scholar]
- 8.Yamaguchi S et al. Tet1 controls meiosis by regulating meiotic gene expression. Nature 492, 443–447 (2012). [DOI] [PMC free article] [PubMed] [Google Scholar]
- 9.Yamaguchi S, Shen L, Liu Y, Sendler D & Zhang Y Role of Tet1 in erasure of genomic imprinting. 504, 460–464 (2013). [DOI] [PMC free article] [PubMed] [Google Scholar]
- 10.Hajkova P et al. Chromatin dynamics during epigenetic reprogramming in the mouse germ line. 452, 877–881 (2008). [DOI] [PMC free article] [PubMed] [Google Scholar]
- 11.Blaschke K et al. Vitamin C induces Tet-dependent DNA demethylation and a blastocyst-like state in ES cells. Nature 500, 222–226 (2013). [DOI] [PMC free article] [PubMed] [Google Scholar]
- 12.Carey BW, Finley LWS, Cross JR, Allis CD & Thompson CB Intracellular α-ketoglutarate maintains the pluripotency of embryonic stem cells. 518, 413–416 (2014). [DOI] [PMC free article] [PubMed] [Google Scholar]
- 13.Zhang Q et al. Differential regulation of the ten-eleven translocation (TET) family of dioxygenases by O-linked β-N-acetylglucosamine transferase (OGT). J Biol Chem 289, 5986–5996 (2014). [DOI] [PMC free article] [PubMed] [Google Scholar]
- 14.Yin R et al. Ascorbic acid enhances Tet-mediated 5-methylcytosine oxidation and promotes DNA demethylation in mammals. J. Am. Chem. Soc 135, 10396–10403 (2013). [DOI] [PubMed] [Google Scholar]
- 15.Wu H & Zhang Y Mechanisms and functions of Tet protein-mediated 5-methylcytosine oxidation. Genes Dev 25, 2436–2452 (2011). [DOI] [PMC free article] [PubMed] [Google Scholar]
- 16.Maeda N et al. Aortic wall damage in mice unable to synthesize ascorbic acid. Proc Natl Acad Sci USA 97, 841–846 (2000). [DOI] [PMC free article] [PubMed] [Google Scholar]
- 17.Szabó PE, Hübner K, Schöler H & Mann JR Allele-specific expression of imprinted genes in mouse migratory primordial germ cells. Mech Dev 115, 157–160 (2002). [DOI] [PubMed] [Google Scholar]
- 18.Hill PWS et al. Epigenetic reprogramming enables the transition from primordial germ cell to gonocyte. Nature 555, 392–396 (2018). [DOI] [PMC free article] [PubMed] [Google Scholar]
- 19.Kobayashi H et al. High-resolution DNA methylome analysis of primordial germ cells identifies gender-specific reprogramming in mice. Genome Research 23, 616–627 (2013). [DOI] [PMC free article] [PubMed] [Google Scholar]
- 20.Ohno R et al. A replication-dependent passive mechanism modulates DNA demethylation in mouse primordial germ cells. Development 140, 2892–2903 (2013). [DOI] [PubMed] [Google Scholar]
- 21.Ebata KT et al. Vitamin C induces specific demethylation of H3K9me2 in mouse embryonic stem cells via Kdm3a/b. Epigenetics Chromatin 10, 36 (2017). [DOI] [PMC free article] [PubMed] [Google Scholar]
- 22.Seki Y et al. Cellular dynamics associated with the genome-wide epigenetic reprogramming in migrating primordial germ cells in mice. Development 134, 2627–2638 (2007). [DOI] [PubMed] [Google Scholar]
- 23.Drouin G, Godin J-R & Pagé B The genetics of vitamin C loss in vertebrates. Curr. Genomics 12, 371–378 (2011). [DOI] [PMC free article] [PubMed] [Google Scholar]
- 24.Salnikow K & Zhitkovich A Genetic and epigenetic mechanisms in metal carcinogenesis and cocarcinogenesis: nickel, arsenic, and chromium. Chem Res Toxicol 21, 28–44 (2008). [DOI] [PMC free article] [PubMed] [Google Scholar]
- 25.Ercal N, Gurer-Orhan H & Aykin-Burns N Toxic metals and oxidative stress part I: mechanisms involved in metal-induced oxidative damage. Curr Top Med Chem 1, 529–539 (2001). [DOI] [PubMed] [Google Scholar]
- 26.Cross CE, Traber M, Eiserich J & van der Vliet A Micronutrient antioxidants and smoking. Br. Med. Bull 55, 691–704 (1999). [DOI] [PubMed] [Google Scholar]
- 27.Alsharif NZ, Lawson T & Stohs SJ Oxidative stress induced by 2,3,7,8-tetrachlorodibenzo-p-dioxin is mediated by the aryl hydrocarbon (Ah) receptor complex. Toxicology 92, 39–51 (1994). [DOI] [PubMed] [Google Scholar]
- 28.Matsumura F On the significance of the role of cellular stress response reactions in the toxic actions of dioxin. Biochem. Pharmacol 66, 527–540 (2003). [DOI] [PubMed] [Google Scholar]
- 29.Cyr AR & Domann FE The redox basis of epigenetic modifications: from mechanisms to functional consequences. Antioxid Redox Signal 15, 551–589 (2011). [DOI] [PMC free article] [PubMed] [Google Scholar]
Methods References
- 30.Kim H et al. The analysis of vitamin C concentration in organs of gulo(−/−) mice upon vitamin C withdrawal. Immune Netw 12, 18–26 (2012). [DOI] [PMC free article] [PubMed] [Google Scholar]
- 31.Franks LM & Payne J The influence of age on reproductive capacity in C57BL mice. J. Reprod. Fertil 21, 563–565 (1970). [DOI] [PubMed] [Google Scholar]
- 32.Agathocleous M et al. Ascorbate regulates haematopoietic stem cell function and leukaemogenesis. Nature 549, 476–481 (2017). [DOI] [PMC free article] [PubMed] [Google Scholar]
- 33.Guerquin M-J et al. New testicular mechanisms involved in the prevention of fetal meiotic initiation in mice. Dev Biol 346, 320–330 (2010). [DOI] [PubMed] [Google Scholar]
- 34.Arora R et al. Meiotic onset is reliant on spatial distribution but independent of germ cell number in the mouse ovary. Journal of Cell Science 129, 2493–2499 (2016). [DOI] [PMC free article] [PubMed] [Google Scholar]
- 35.Abby E et al. Implementation of meiosis prophase I programme requires a conserved retinoid-independent stabilizer of meiotic transcripts. Nature Communications 7, 10324 (2016). [DOI] [PMC free article] [PubMed] [Google Scholar]
- 36.Faire M et al. Follicle dynamics and global organization in the intact mouse ovary. Dev Biol 403, 69–79 (2015). [DOI] [PMC free article] [PubMed] [Google Scholar]
- 37.Kim D et al. TopHat2: accurate alignment of transcriptomes in the presence of insertions, deletions and gene fusions. Genome Biol 14, R36 (2013). [DOI] [PMC free article] [PubMed] [Google Scholar]
- 38.Anders S, Pyl PT & Huber W HTSeq--a Python framework to work with high-throughput sequencing data. Bioinformatics 31, 166–169 (2015). [DOI] [PMC free article] [PubMed] [Google Scholar]
- 39.Huber W et al. Orchestrating high-throughput genomic analysis with Bioconductor. Nat Meth 12, 115–121 (2015). [DOI] [PMC free article] [PubMed] [Google Scholar]
- 40.Love MI, Huber W & Anders S Moderated estimation of fold change and dispersion for RNA-seq data with DESeq2. Genome Biol 15, 550 (2014). [DOI] [PMC free article] [PubMed] [Google Scholar]
- 41.Huang DW, Sherman BT & Lempicki RA Systematic and integrative analysis of large gene lists using DAVID bioinformatics resources. Nat Protoc 4, 44–57 (2009). [DOI] [PubMed] [Google Scholar]
- 42.Subramanian A et al. Gene set enrichment analysis: a knowledge-based approach for interpreting genome-wide expression profiles. Proceedings of the National Academy of Sciences 102, 15545–15550 (2005). [DOI] [PMC free article] [PubMed] [Google Scholar]
- 43.Meissner A et al. Genome-scale DNA methylation maps of pluripotent and differentiated cells. 454, 766–770 (2008). [DOI] [PMC free article] [PubMed] [Google Scholar]
- 44.Guo H et al. Single-cell methylome landscapes of mouse embryonic stem cells and early embryos analyzed using reduced representation bisulfite sequencing. Genome Research 23, 2126–2135 (2013). [DOI] [PMC free article] [PubMed] [Google Scholar]
- 45.Krueger F & Andrews SR Bismark: a flexible aligner and methylation caller for Bisulfite-Seq applications. Bioinformatics 27, 1571–1572 (2011). [DOI] [PMC free article] [PubMed] [Google Scholar]
- 46.Hebestreit K, Dugas M & Klein H-U Detection of significantly differentially methylated regions in targeted bisulfite sequencing data. Bioinformatics 29, 1647–1653 (2013). [DOI] [PubMed] [Google Scholar]
- 47.McLean CY et al. GREAT improves functional interpretation of cis-regulatory regions. Nat Biotech 28, 495–501 (2010). [DOI] [PMC free article] [PubMed] [Google Scholar]
- 48.Wu H et al. Dual functions of Tet1 in transcriptional regulation in mouse embryonic stem cells. 473, 389–393 (2011). [DOI] [PMC free article] [PubMed] [Google Scholar]
- 49.Li Z et al. Distinct roles of DNMT1-dependent and DNMT1-independent methylation patterns in the genome of mouse embryonic stem cells. Genome Biol 16, 115 (2015). [DOI] [PMC free article] [PubMed] [Google Scholar]
- 50.Hainer SJ, Bošković A, Rando OJ & Fazzio TG Profiling of pluripotency factors in individual stem cells and early embryos. bioRxiv doi: 10.1101/286351 [DOI] [PMC free article] [PubMed] [Google Scholar]
- 51.Skene PJ, Henikoff JG & Henikoff S Targeted in situ genome-wide profiling with high efficiency for low cell numbers. Nat Protoc 13, 1006–1019 (2018). [DOI] [PubMed] [Google Scholar]
- 52.Percharde M, Wong P & Ramalho-Santos M Global Hypertranscription in the Mouse Embryonic Germline. CellReports 19, 1987–1996 (2017). [DOI] [PMC free article] [PubMed] [Google Scholar]
- 53.Ritchie ME et al. limma powers differential expression analyses for RNA-sequencing and microarray studies. Nucleic Acids Research 43, e47–e47 (2015). [DOI] [PMC free article] [PubMed] [Google Scholar]
Associated Data
This section collects any data citations, data availability statements, or supplementary materials included in this article.
Supplementary Materials
Data Availability Statement
RNA-seq, RRBS, and CUT&RUN data have been deposited in Gene Expression Omnibus (GEO) under accession number GSE109747.


