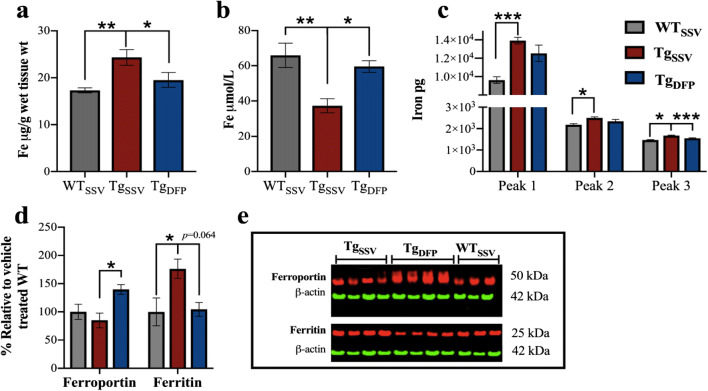
Fig. 3.
Effects of DFP on iron. ICP-MS analysis was used to measure iron levels in (a) brain homogenates and in (b) blood plasma. (c) Iron bound to metalloproteins in brain homogenates was measured using SEC-ICP-MS. The area under the curve was averaged for each mouse within each group to examine iron content within each peak, which corresponds to the chromatogram shown in ESI Fig. S1. Peak 1 is associate with ferritin-like proteins; peak 2 may be associated with cytochrome c, and proteins associated with peak 3 are low molecular weight iron-protein complexes, which require further investigation. (d) Densitometry analysis normalized to ß-actin of (e) representative western blot images of ferroportin, ferritin and ß-actin in the hippocampus (note, antibodies were probed on the same blot). One-way ANOVA, Tukey’s post hoc test. Error bars represent ±SEM. WTSSV = vehicle-treated WT mice; TgSSV = vehicle-treated rTg4510 mice; TgDFP = DFP-treated rTg4510 mice. n= 9/group; *p<0.05; **p<0.001, ***p<0.0001

