Abstract
Purpose:
MRI of endolymphatic hydrops (EH) 4 h after intravenous administration of a single dose of gadolinium-based contrast agent is used for clinical examination in some institutions; however, further improvement in image quality would be valuable for wider clinical utility. Denoising using deep learning reconstruction (Advanced Intelligent Clear-IQ Engine [AiCE]) has been reported for CT and MR. The purpose of this study was to compare the contrast-to-noise ratio of endolymph to perilymph (CNREP) between the improved hybrid of reversed image of the positive endolymph signal and the native image of the perilymph signal multiplied with the heavily T2-weighted MR cisternography (iHYDROPS-Mi2) images, which used AiCE for the three source images (i.e. positive endolymph image [PEI], positive perilymph image [PPI], MR cisternography [MRC]) to those that did not use AiCE. We also examined if there was a difference between iHYDROPS-Mi2 images with and without AiCE for degree of visual grading of EH and in endolymphatic area [EL] ratios.
Methods:
Nine patients with suspicion of EH were imaged on a 3T MR scanner. iHYDROPS images were generated by subtraction of PEI images from PPI images. iHYDROPS-Mi2 images were then generated by multiplying MRC with iHYDROPS images. The CNREP and EL ratio were measured on the iHYDROPS-Mi2 images. Degree of radiologist visual grading for EH was evaluated.
Results:
Mean CNREP ± standard deviation was 1681.8 ± 845.2 without AiCE and 7738.6 ± 5149.2 with AiCE (P = 0.00002). There was no significant difference in EL ratio for images with and without AiCE. Radiologist grading for EH agreed completely between the 2 image types in both the cochlea and vestibule.
Conclusion:
The CNREP of iHYDROPS-Mi2 images with AiCE had more than a fourfold increase compared with that without AiCE. Use of AiCE did not adversely affect radiologist grading of EH.
Keywords: magnetic resonance imaging, gadolinium, endolymphatic hydrops, deep learning reconstruction, inner ear
Introduction
MRI for the detection of endolymphatic hydrops in patients with Meniere’s disease was performed previously by intratympanic administration of gadolinium-based contrast agents (GBCAs).1 Currently, a method of intravenous administration of a single dose of GBCA, which is noninvasive and can be easily performed clinically, has become mainstream.2
A positive perilymph image (PPI) acquired by heavily T2-weighted 3D-fluid attenuated inversion recovery with a constant flip angle and readout echo train, and a positive endolymph image (PEI) with a slightly reduced inversion time are obtained at 4 h after intravenous administration of a single dose of GBCA.3 The resultant subtraction (hybrid of reversed image of the positive endolymph signal and the native image of the perilymph signal [HYDROPS]) image has been used for diagnosis for several years.4 HYDROPS images are now frequently used for the diagnosis of endolymphatic hydrops.5 It has also been reported that the contrast-to-noise ratio between the endolymph and the perilymph (CNREP) can be increased more than 200 times by multiplying the HYDROPS image and the MR cisternography (MRC, free water weighted image). The resultant image was named the HYDROPS-Mi2 image.6 Using the HYDROPS-Mi2 image, it was easy to create a 3D volumetric image to distinguish the endolymph and the perilymph, even when imaging with a minimally invasive intravenous administration of a single dose of GBCA.7
Further improvements have also been reported that reduce the time to acquire conventional HYDROPS images. The usefulness of improved HYDROPS (iHYDROPS) imaging, which has better image quality than the conventional method has been reported. The iHYDROPS images can be obtained in half the time with an increased CNREP by extending the repetition time and increasing the flip angle of the echo train.8
Despite these improvements in the image acquisition, the diagnosis of endolymphatic hydrops at 4 h after intravenous administration of GBCA is still performed with double dose administration instead of a single dose in some institutions.9–11 It is presumed that these institutions are still uncertain about the image quality obtained by a single dose of GBCA. It is uncertain if the diagnosis of endolymphatic hydrops by the intravenous administration of a single dose of GBCA is widely utilized within the clinical field. Therefore, further improvement in image quality after intravenous administration of a single dose of GBCA may increase the utilization of this diagnostic method for endolymphatic hydrops.
Deep learning reconstruction (DLR) (Advanced Intelligent Clear-IQ Engine [AiCE], Canon Medical Systems, Tokyo, Japan) was the first commercialized DLR tool. It incorporates a deep convolutional neural network (DCNN) restoration process into the reconstruction flow. DLR enables noise reduction in CT and MR images, and its usefulness to produce images with improved spatial resolution has been reported.12–14
For the imaging of endolymphatic hydrops, it is important to have a sufficient CNR between the endolymph and the perilymph (CNREP) to allow the recognition of the tiny endolymphatic space in the labyrinth. The purpose of this study was to compare the CNREP between the iHYDROPS-Mi2 images that used AiCE for the three source images (i.e. PEI, PPI, MRC) and the iHYDROPS-Mi2 images that did not use AiCE. The endolymphatic area (EL) ratio for the two types of images were compared for both the cochlea and vestibule. We also examined whether there was a difference between the iHYDROPS-Mi2 images with and without AiCE on the degree of radiologist visual grading for endolymphatic hydrops. 3D volume rendered images were also generated from the iHYDROPS-Mi2 images with and without AiCE in a single patient.
Materials and Methods
Patients
Nine patients with a suspicion of endolymphatic hydrops (5 men and 4 women, age range 26–72, median: 48) were imaged on a 3T MR scanner (Vantage Centurian, Canon Medical Systems, Tochigi, Japan). Images of the 18 ears from these nine patients were retrospectively analyzed. In all patients, the estimated glomerular filtration rate was 60 mL/min/1.73 m2 or greater. The ethical committee of our institution approved this retrospective study with a waiver of consent from the patients.
Magnetic Resonance imaging
All MR images were obtained on a whole body 3T MR scanner using a 32-channel array head coil. A single dose (0.1 mmol/kg) of GBCA, Gadobutrol (Gadovist; Bayer Yakuhin, Osaka, Japan) was intravenously administered 4 h prior to the MR scans. The axial PPI, PEI, and MRC were obtained. The images were reconstructed with and without AiCE on the scanner console. Detailed scan parameters are listed in Table 1.
Table 1.
Pulse sequence parameters
| Sequence name | Type | TR (ms) | TE (ms) | Inversion time (ms) | Flip angle (°) | Section thickness/reconstruction step (mm) | Pixel size (mm) | Number of slices | Echo spacing (ms) | Echo train length | Field of view (mm) | Matrix size | Number of excitations | Scan time | SPEEDER (phase direction × slice direction) | Scan option |
|---|---|---|---|---|---|---|---|---|---|---|---|---|---|---|---|---|
| MR cisternography | FASE3D | 3500 | 299 | NA | 90–160 - constant | 2.0/1.0 | 0.5 × 0.5 | 224 | 6.5 | 158 | 180 × 200 | 352 × 384 | 1 | 4 min 47 s | 2 × 1.4 | Flip back pulse at the end of echo train |
| Positive perilymph image (heavily T2-weighted 3D-FLAIR) | FASE3D-MPV with inversion pulse | 16000 | 546 | 2850 | 90–170 - constant 160 | 2.0/1.0 | 0.5 × 0.5 | 224 | 6.5 | 258 | 180 × 200 | 352 × 384 | 1 | 7 min 28 s | 2 × 1.5 | Frequency selective fat suppression pre-pulse |
| Positive endolymph image | FASE3D-MPV with inversion pulse | 16000 | 546 | 2400 | 90–170 - constant 160 | 2.0/1.0 | 0.5 × 0.5 | 224 | 6.5 | 258 | 180 × 200 | 352 × 384 | 1 | 7 min 28 s | 2 × 1.5 | Frequency selective fat suppression pre-pulse |
3D slab is set in an axial orientation. FASE, fast advanced spin echo; FASE3D-MPV, equivalent to the variable flip angle 3D turbo spin echo technique such as sampling perfection with application optimized contrast using different flip angle evolution (SPACE); FLAIR, fluid attenuated inversion recovery; MPV, multiplanar voxel; SPEEDER, parallel imaging technique in the image domain.
Image processing
The iHYDROPS images were generated by subtraction of the PEIs from the PPIs. The iHYDROPS-Mi2 images were then generated by multiplication of the MRC images with the iHYDROPS images. Image processing was carried out on the scanner console. The iHYDROPS-Mi2 images with and without AiCE were generated from the three source images (i.e. PPI, PEI and MRC). All images were transferred to a PACS system (RapideyeCore; Canon Medical Systems), and were evaluated by an experienced radiologist. The AiCE technique used the default settings of the MR scanner.
Image evaluation
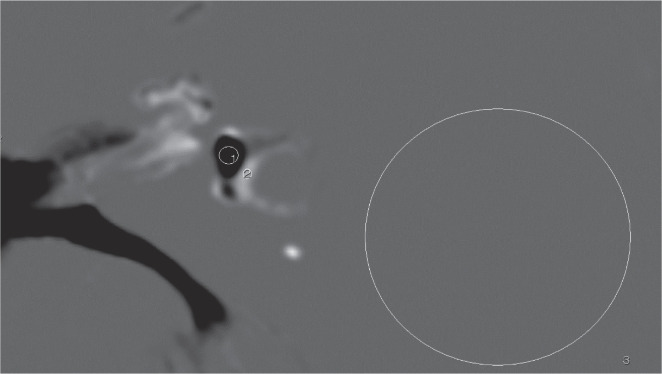
The CNREP was measured on the iHYDROPS-Mi2 images. For the noise evaluation, a circular region of interest (ROI) with a 2-cm diameter was placed on the area of uniform signal intensity on the lateral side of the labyrinth. The circular ROI for the perilymph was drawn as large as possible in the uniformly enhanced vestibular perilymph. The circular ROI for the endolymph was drawn as large as possible in the endolymph space of the utricle or the saccule in the vestibule. The ROIs were drawn on the images without AiCE and were copied onto the images with AiCE. The value obtained by subtracting the signal intensity of the endolymph from that of the perilymph and divided by the standard deviation of the ROI for the noise, was defined as the CNREP. An example of the ROI placement is shown in Fig. 1. The average CNR ratio (CNREP with AiCE/CNREP without AiCE) was also calculated.
Fig. 1.
An example of ROI placement. Circular ROI #1 is drawn in the vestibular endolymph as large as possible on the iHYDROPS-Mi2 image. Circular ROI #2 is drawn in the perilymph as large as possible. Circular ROI #3 is drawn as a circle with the diameter of 20 mm in the area of uniform signal intensity that is lateral to the labyrinth for the noise level estimation. The contrast-to-noise ratio between the perilymph and the endolymph is defined as a subtraction of the signal intensity of ROI #2 minus ROI #1 divided by the standard deviation of ROI #3. iHYDROPS-Mi2, improved hybrid of reversed image of the positive endolymph signal and the native image of the perilymph signal multiplied with the heavily T2-weighted MR cisternography; ROI, region of interest.
Measurement of the EL ratio in the total lymphatic space was performed according to the area measurement method described previously.15 Briefly, the ROI for the cochlea was manually contoured on the MRC at the cochlear modiolus level, then the ROI was pasted onto the iHYDROPS-Mi2 images with and without AiCE. Pixels with negative values were counted as endolymph pixels. The EL ratio was defined as: Number of pixels of endolymph/number of pixels of the ROI for the cochlea on the MRC. Similarly, the ROI for the vestibule was drawn on the MRC, selecting the lowest slice where the lateral semicircular canal ring could be visualized at more than 240°. The vestibular ROI was drawn to exclude the semicircular canal and the ampulla on the MRC.15 Measurement of CNREP and EL ratio was performed by an experienced radiologist.
The mean CNREP was compared between the iHYDROPS-Mi2 images with and without AiCE using a paired Student’s t-test. The EL ratios for the iHYDROPS-Mi2 images with and without AiCE were compared for the cochlea and vestibule using a Wilcoxon signed-ranks test. The Pearson’s correlation coefficients were also calculated. We used 5% as a threshold to determine statistical significance. The software R (version 3.3.2; The R Foundation for Statistical Computing, Vienna, Austria, https://www.r-project.org/) was used for the statistical analyses.
The grading for endolymphatic hydrops on the iHYDROPS-Mi2 with and without AiCE was performed by an experienced radiologist, and according to the previously proposed criteria.16 The cochlea and vestibule of each ear were separately graded as; 0: no endolymphatic hydrops, 1: mild endolymphatic hydrops, and 2: significant endolymphatic hydrops. The iHYDROPS-Mi2 images without AiCE were evaluated first, and then the iHYDROPS-Mi2 images with AiCE were evaluated at least 4 weeks after the first evaluation session. In both sessions, a window level of 30 and a window width of 12000 were used to display the iHYDROPS-Mi2 images. For a single example, a 3D-volume rendering (VR) was created for a reference on the 3D-workstation (Vitrea; Canon Medical Systems) and the VR images were compared subjectively.
Results
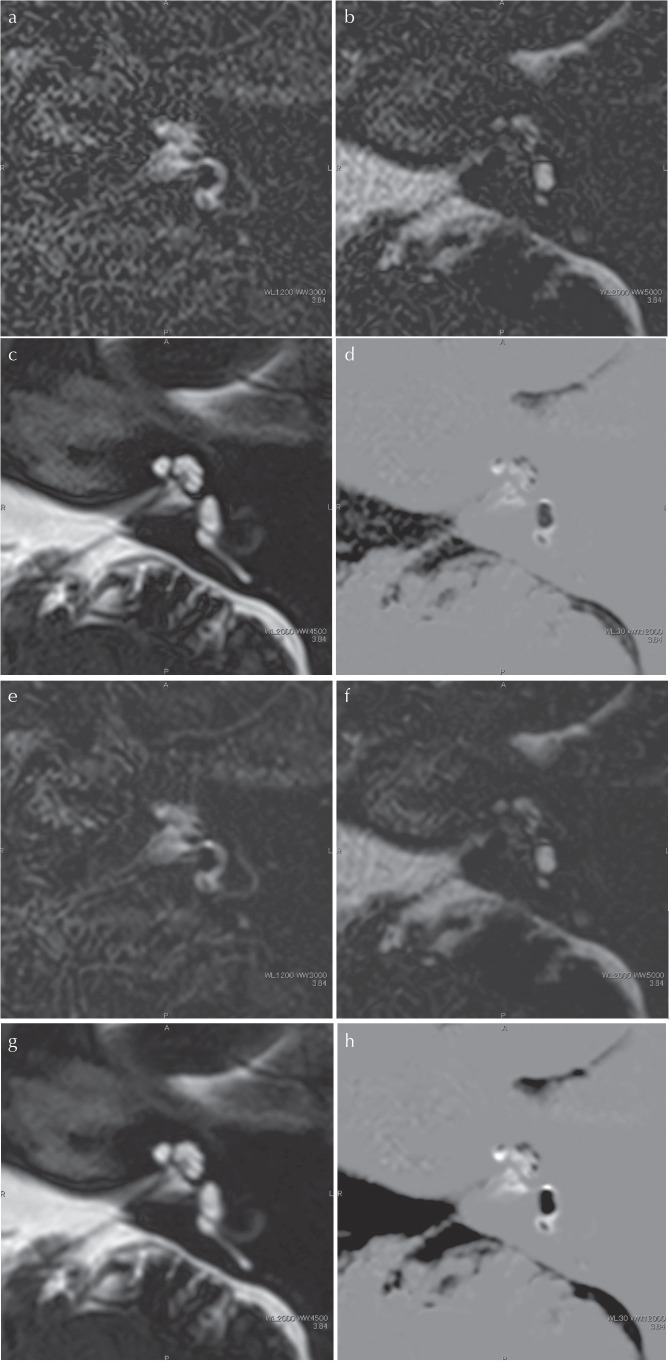
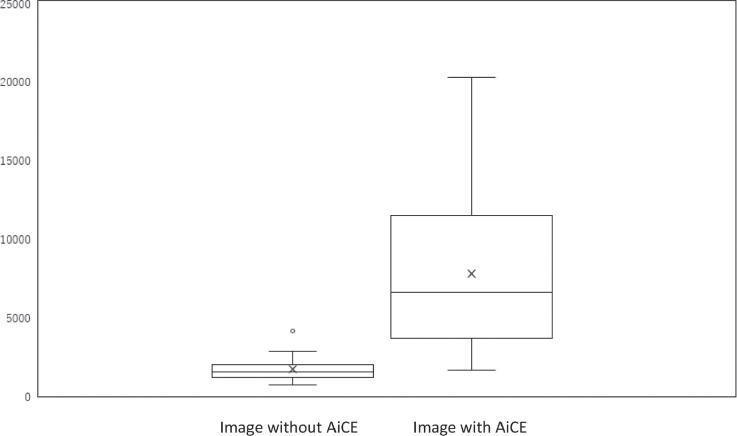
The representative images of a case with significant endolymphatic hydrops in the cochlea and vestibule are shown in Fig. 2. The CNREP was elevated after application of AiCE to the images in all 18 ears of all nine patients. The mean CNREP ± standard deviation of the iHYDROPS-Mi2 images was 1681.8 ± 845.2 without AiCE and 7738.6 ± 5149.2 with AiCE (P = 0.00002, Fig. 3). The average CNR ratio (CNREP with AiCE/CNREP without AiCE) was 4.34 (range: 2.45–9.24; standard deviation: 1.66).
Fig. 2.
A 66-year-old man with significant endolymphatic hydrops in the left cochlea and vestibule. (a)–(d) Images without AiCE, (e)–(h) images with AiCE. The window width and window level was consistent between the images with and without AiCE. Note that the image noise is suppressed in the images with AiCE compared with images without AiCE. (a) and (e) The PPI by heavily T2-weighted 3D-FLAIR. The perilymph has a high signal intensity and endolymph has a very low to no signal intensity. (b) and (f) A PEI with a shorter inversion time than that of the PPI. The signal intensity of the perilymph is suppressed. However, the signal intensity of the endolymph is high. (c) and (g) MR cisternography. Both the endolymph and perilymph have a high signal intensity. (d) and (h) The iHYDROPS-Mi2 image obtained by the multiplication of the MRC onto the subtraction image (PPI minus PEI). Significant endolymphatic hydrops in the cochlea and vestibule is easily recognized in both images without and with AiCE. The contrast-to-noise ratio between the perilymph and endolymph is 4.2 times higher in the image with AiCE compared with that without AiCE. 3D-FLAIR, 3D fluid attenuated inversion recovery; AiCE, advanced intelligent clear-IQ engine, one of the deep learning reconstruction methods; iHYDROPS-Mi2, improved hybrid of reversed image of positive endolymph signal and native image of perilymph signal multiplied with heavily T2-weighted MR cisternography; PEI, positive endolymph image; PPI, positive perilymph image.
Fig. 3.
A box-and-whisker plot of the contrast-to-noise ratio between the perilymph and the endolymph in HYDROPS-Mi2 images with and without AiCE. The lower side of the rectangle is the first quartile (25th percentile value) and the upper side is the 75th percentile. The horizontal line in the rectangle is the median. The horizontal line under the whisker indicates the 10th percentile value, and the horizontal line above the whisker indicates the 90th percentile. The cross sign in the rectangle is the mean. There is a significant difference between the groups (P = 0.00002). AiCE, advanced intelligent clear-IQ engine, one of the deep learning reconstruction methods; HYDROPS-Mi2, hybrid of reversed image of positive endolymph signal and native image of perilymph signal multiplied with heavily T2-weighted MR cisternography.
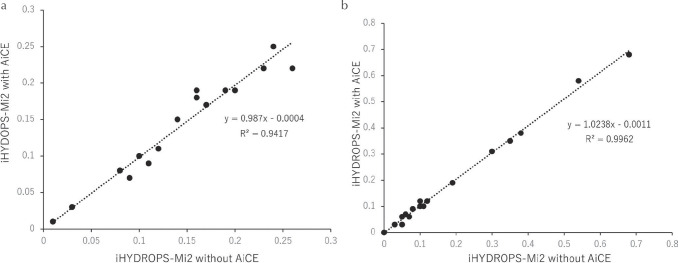
The mean EL ratio ± standard deviation of the cochlea for the iHYDROPS-Mi2 image was 0.141 ± 0.069 without AiCE and 0.139 ± 0.07 with AiCE. The mean EL ratio ± standard deviation of the vestibule for the iHYDROPS-Mi2 image was 0.185 ± 0.19 without AiCE and 0.188 ± 0.19 with AiCE. There was no significant difference between the cochlea and vestibule. The Pearson’s coefficient of determination (R2), was 0.9417 for the cochlea and 0.9962 for the vestibule. The slope of the regression line was 0.987 for the cochlea and 1.0238 for the vestibule (Fig. 4).
Fig. 4.
A scatter gram of the endolymphatic area (EL) ratio of the iHYDROPS-Mi2 images without and with AiCE. The dotted line indicates the regression line. (a) EL ratio of the cochlea. (b) EL ratio of the vestibule. The slopes of the lines are near 1 and the R2 is quite high for both the cochlea and vestibule. AiCE, advanced intelligent clear-IQ engine; iHYDROPS-Mi2, improved hybrid of reversed image of positive endolymph signal and native image of perilymph signal multiplied with heavily T2-weighted MR cisternography; R2, square of the correlation coefficient (Pearson’s coefficient of determination).
The radiologist grade for endolymphatic hydrops of the cochlea and vestibule for all ears completely agreed between the images with or without AiCE. The age, gender and the grades of endolymphatic hydrops of each patient were shown in Table 2.
Table 2.
Patient age, gender, and radiologist grades for endolymphatic hydrops
| Age | Gender | Right | Left | ||
|---|---|---|---|---|---|
|
|
|
||||
| Cochlea | Vestibule | Cochlea | Vestibule | ||
| 70 | F | 0 | 0 | 0 | 0 |
| 66 | M | 2 | 0 | 2 | 2 |
| 33 | M | 2 | 0 | 1 | 2 |
| 48 | F | 1 | 0 | 2 | 0 |
| 26 | F | 2 | 0 | 2 | 0 |
| 72 | M | 1 | 1 | 1 | 0 |
| 48 | M | 1 | 0 | 1 | 1 |
| 42 | F | 2 | 0 | 1 | 1 |
| 44 | M | 0 | 0 | 2 | 0 |
0, no endolymphatic hydrops; 1, mild endolymphatic hydrops; 2, significant endolymphatic hydrops.
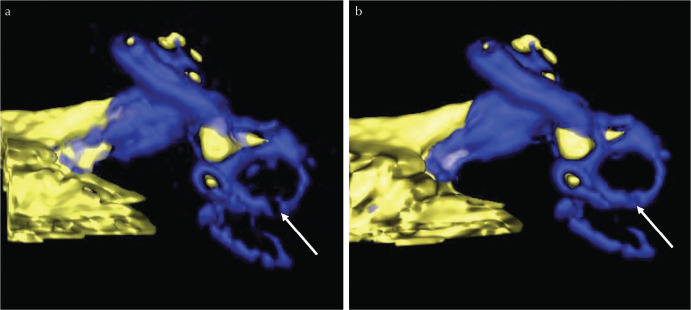
The 3D-VR images of a single case are shown in Fig. 5. The continuity of the lateral semicircular canal is improved by the application of AiCE.
Fig. 5.
A comparison of a 3D-volume rendered image without (a) and with AiCE (b) in a representative ear. The blue color in the labyrinth represents the perilymph. The yellow color in the labyrinth represents the endolymph. This is the same inner ear as shown in Fig. 1. Note that the continuity of the lateral semicircular canal (arrows) appears improved qualitatively in (b) compared with (a). AiCE, one of the deep learning reconstruction methods. AiCE, advanced intelligent clear-IQ engine.
Discussion
The DLR technique used in our study for AiCE uses a DCNN to differentiate the noise from signal on MR images and to enhance the signal while decreasing the noise. The DCNN was implemented after converting k-space to real-space with an inverse fast Fourier transform. After the DLR processing, the rest of the reconstruction process such as zero padding zooming, gradient distortion correction, and so on, was performed to generate a final reconstructed image. The DLR architecture used in the present study has two paths, one with feature extraction and multiple feature conversion layers, and the other with a convolution layer and a low-pass filter.17 Clinical utilization of denoising by AiCE has been reported for CT and MR.12–14,18
MRI of EH is anticipated to be part of the diagnostic criteria for Meniere’s disease in the future.19,20 Therefore, improvement of the image quality is critically important for more wide spread application in the clinical field. By applying AiCE to iHYDROPS-Mi2 images, a more than fourfold improvement in CNREP was obtained. However, the radiologist grade for endolymphatic hydrops of the cochlea and vestibule was the same on images with or without AiCE. Since sufficiently diagnostic images were obtained with HYDROPS-Mi2 images without AiCE, the improved CNREP by the application of AiCE might be utilized to further shorten the imaging time, or to reduce the GBCA dose.
The feasibility of HYDROPS imaging after intravenous administration of a single dose of GBCA at 1.5T has been reported previously21; however, it is not widely performed currently. This could be because the image quality might be less optimal for clinical evaluation. The improvement of the CNREP by AiCE may make it possible to obtain iHYDROPS-Mi2 images from 1.5T scanners, which are more widely available. There is also a previous report that after the intravenous administration of a single dose of GBCA, the contrast enhancement in the perilymph gradually appears, and endolymphatic hydrops can be diagnosed from 3.5 h after the GBCA administration.22 It might be reasonable to test the feasibility of further shortening the wait time after intravenous administration of GBCA for clinical convenience.
In a single ear of the present study, the continuity of the lateral semicircular canal seems to be improved by the application of AiCE in the VR image. This suggests, for example, the results of an automatic volume measurement or segmentation might be more reliable using iHYDROPS-Mi2 images with AiCE. Furthermore, quantification of the blood-perilymph barrier permeability, which is elevated in various inner ear diseases,23 might be performed more precisely with the higher CNR data of the iHYDROPS-Mi2 images with AiCE. Improved 3D-real inversion recovery (i3D-real IR) technique has been reported as the as a promising alternative to HYDROPS imaging method.24 The application of AiCE to i3D-real IR might be an interesting future research subject.
There are some limitations to this study. Since this is a retrospective study of a small number of cases, case selection bias cannot be excluded. The MR study of endolymphatic hydrops is a study lacking a gold standard from pathological specimens. Since the images are compared using the same original data, there is no risk of positional misalignment; however, the evaluation method for the noise level without an external phantom might not be ideal for the images using parallel imaging in the image domain and AiCE. We used the default setting of AiCE in the present study; however, the effect of further adjustments of AiCE setting should be carefully evaluated to prevent the degradation of the image quality. Measurements of the EL ratio for the cochlea and vestibule were performed by a single observer in this study. However, high intra-class correlation coefficients (0.991–0.997) between the EL ratios by two different observers have been reported.15
Conclusion
We compared the iHYDROPS-Mi2 images with and without AiCE. It was confirmed that the CNREP increased more than fourfold on average with AiCE. The use of AiCE did not adversely affect the diagnosis of endolymphatic hydrops. iHYDROPS-Mi2 imaging with AiCE obtained at 4 h after a single dose of intravenous administration of GBCA warrants further clinical research for endolymphatic hydrops.
Footnotes
Funding
This study was supported in part by Grants-in-Aid for scientific research from the Japanese Society for the Promotion of Science (JSPS KAKENHI, number 18K19510) to S.N.
Conflicts of Interest
The authors declare that they have no conflicts of interest.
References
- 1.Nakashima T, Naganawa S, Sugiura M, et al. Visualization of endolymphatic hydrops in patients with Meniere’s disease. Laryngoscope 2007; 117:415–420. [DOI] [PubMed] [Google Scholar]
- 2.Naganawa S, Yamazaki M, Kawai H, Bokura K, Sone M, Nakashima T. Visualization of endolymphatic hydrops in Ménière’s disease with single-dose intravenous gadolinium-based contrast media using heavily T(2)-weighted 3D-FLAIR. Magn Reson Med Sci 2010; 9:237–242. [DOI] [PubMed] [Google Scholar]
- 3.Naganawa S, Yamazaki M, Kawai H, Bokura K, Sone M, Nakashima T. Imaging of endolymphatic and perilymphatic fluid after intravenous administration of single-dose gadodiamide. Magn Reson Med Sci 2012; 11:145–150. [DOI] [PubMed] [Google Scholar]
- 4.Naganawa S, Yamazaki M, Kawai H, Bokura K, Sone M, Nakashima T. Imaging of Ménière’s disease after intravenous administration of single-dose gadodiamide: utility of subtraction images with different inversion time. Magn Reson Med Sci 2012; 11:213–219. [DOI] [PubMed] [Google Scholar]
- 5.Fukushima M, Kitahara T, Oya R, et al. Longitudinal up-regulation of endolymphatic hydrops in patients with Meniere’s disease during medical treatment. Laryngoscope Investig Otolaryngol 2017; 2:344–350. [DOI] [PMC free article] [PubMed] [Google Scholar]
- 6.Naganawa S, Yamazaki M, Kawai H, Bokura K, Sone M, Nakashima T. Imaging of Ménière’s disease after intravenous administration of single-dose gadodiamide: utility of multiplication of MR cisternography and HYDROPS image. Magn Reson Med Sci 2013; 12:63–68. [DOI] [PubMed] [Google Scholar]
- 7.Naganawa S, Yamazaki M, Kawai H, Bokura K, Sone M, Nakashima T. Three-dimensional visualization of endolymphatic hydrops after intravenous administration of single-dose gadodiamide. Magn Reson Med Sci 2013; 12:147–151. [DOI] [PubMed] [Google Scholar]
- 8.Naganawa S, Kawai H, Taoka T, Sone M. Improved HYDROPS: imaging of endolymphatic hydrops after intravenous administration of gadolinium. Magn Reson Med Sci 2017; 16:357–361. [DOI] [PMC free article] [PubMed] [Google Scholar]
- 9.Pai I, Mendis S, Murdin L, Touska P, Connor S. Magnetic resonance imaging of Ménière’s disease: early clinical experience in a UK centre. J Laryngol Otol 2020; 134:302–310. [DOI] [PubMed] [Google Scholar]
- 10.Zhang W, Hui L, Zhang B, et al. The correlation between endolymphatic hydrops and clinical features of Meniere disease. Laryngoscope 2021; 131:E144–E150. [DOI] [PubMed] [Google Scholar]
- 11.Moayer R, Ishiyama GP, Karnezis S, Sepahdari AR, Ishiyama A. High resolution three-dimensional delayed contrast MRI detects endolymphatic hydrops in patients with vertigo and vestibular schwannoma. Otol Neurotol 2018; 39:e39–e44. [DOI] [PubMed] [Google Scholar]
- 12.Akagi M, Nakamura Y, Higaki T, et al. Deep learning reconstruction improves image quality of abdominal ultra-high-resolution CT. Eur Radiol 2019; 29:6163–6171. [DOI] [PubMed] [Google Scholar]
- 13.Singh R, Digumarthy SR, Muse VV, et al. Image quality and lesion detection on deep learning reconstruction and iterative reconstruction of submillisievert chest and abdominal CT. AJR Am J Roentgenol 2020; 214:566–573. [DOI] [PubMed] [Google Scholar]
- 14.Higaki T, Nakamura Y, Tatsugami F, Nakaura T, Awai K. Improvement of image quality at CT and MRI using deep learning. Jpn J Radiol 2019; 37:73–80. [DOI] [PubMed] [Google Scholar]
- 15.Naganawa S, Kanou M, Ohashi T, Kuno K, Sone M. Simple estimation of the endolymphatic volume ratio after intravenous administration of a single-dose of gadolinium contrast. Magn Reson Med Sci 2016; 15:379–385. [DOI] [PMC free article] [PubMed] [Google Scholar]
- 16.Nakashima T, Naganawa S, Pyykko I, et al. Grading of endolymphatic hydrops using magnetic resonance imaging. Acta Otolaryngol Suppl 2009:5–8. [DOI] [PubMed] [Google Scholar]
- 17.Shinoda K, Isogawa K, Nambu M, et al. Deep learning based adaptive noise reduction in multi-contrast MR images. Proceedings of the 27th annual Meeting of ISMRM, Montreal, 2019; 4701. [Google Scholar]
- 18.Kidoh M, Shinoda K, Kitajima M, et al. Deep learning based noise reduction for brain MR imaging: tests on phantoms and healthy volunteers. Magn Reson Med Sci 2020; 19:195–206. [DOI] [PMC free article] [PubMed] [Google Scholar]
- 19.Gürkov R. Menière and friends: imaging and classification of hydropic ear disease. Otol Neurotol 2017; 38:e539–e544. [DOI] [PubMed] [Google Scholar]
- 20.Nakashima T, Pyykkö I, Arroll MA, et al. Meniere’s disease. Nat Rev Dis Primers 2016; 2:16028. [DOI] [PubMed] [Google Scholar]
- 21.Naganawa S, Yamazaki M, Kawai H, Bokura K, Sone M, Nakashima T. Visualization of endolymphatic hydrops in Ménière’s disease after intravenous administration of single-dose gadodiamide at 1.5T. Magn Reson Med Sci 2013; 12:137–139. [DOI] [PubMed] [Google Scholar]
- 22.Naganawa S, Yamazaki M, Kawai H, Bokura K, Sone M, Nakashima T. Visualization of endolymphatic hydrops in Ménière’s disease after single-dose intravenous gadolinium-based contrast medium: timing of optimal enhancement. Magn Reson Med Sci 2012; 11:43–51. [DOI] [PubMed] [Google Scholar]
- 23.Bernaerts A, Vanspauwen R, Blaivie C, et al. The value of four stage vestibular hydrops grading and asymmetric perilymphatic enhancement in the diagnosis of Menière’s disease on MRI. Neuroradiology 2019; 61:421–429. [DOI] [PMC free article] [PubMed] [Google Scholar]
- 24.Naganawa S, Kawai H, Taoka T, Sone M. Improved 3D-real inversion recovery: a robust imaging technique for endolymphatic hydrops after intravenous administration of gadolinium. Magn Reson Med Sci 2019; 18:105–108. [DOI] [PMC free article] [PubMed] [Google Scholar]


