Abstract
Introduction
Magnetic resonance imaging (MRI) is the preferred imaging modality for Leksell Gamma Knife® (LGK) stereotactic radiosurgery (SRS) treatment planning (TP) due to superior soft tissue definition compared to computed tomography (CT). However, inherent distortions in MRI can affect treatment accuracy. The aim of this study was to develop a model to visualise the effect of MRI distortion on LGK SRS target coverage.
Methods
A model was developed using MR images of a QUASARTM GRID3D QA phantom. One hundred and twenty‐five points were compared against known phantom geometry. Using linear interpolation, the model was applied retrospectively to 10 brain metastases patient data sets treated with LGK. The model estimated the corrected shot position accounting for distortion. A total of 44 metastases were investigated regarding the effects of MRI distortion on target coverage.
Results
The model indicated significantly reduced mean error by 0.30 mm and variance by 0.09 mm (P = 0.008). After model application, 23 (53%) metastases showed reduced coverage. Six of the 23 metastases were deemed to be potentially clinically significant changes. Results indicated MRI distortion had a greater effect on smaller targets (mean 0.06cc) located further away from the image isocentre (mean 64.88 mm).
Conclusion
This study developed a model to visualise the effect of MRI distortion on LGK SRS target coverage. Results suggest that MRI distortion can affect target coverage and the developed model may be one method to assess its impact. These results indicate that MRI distortion may have a greater effect on smaller targets located at the image periphery.
Keywords: Image distortion, Leksell Gamma Knife, magnetic resonance imaging, quality assurance, stereotactic radiosurgery
The aim of this study was to develop a model to visualise the effect of MRI distortion on Leksell Gamma Knife® (LGK) stereotactic radiosurgery target coverage using MR images of a QUASAR GRID QA phantom. The model was applied retrospectively to 10 brain metastases patient data sets treated with LGK. Results indicated that MRI distortion may have a greater effect on smaller targets located at the image periphery.
![]()
Introduction
Stereotactic radiosurgery (SRS) involves the precise delivery of ablative doses of ionising radiation to treat a variety of neurological diseases. Leksell Gamma Knife® (LGK) is a dedicated intracranial SRS platform capable of delivering some of the steepest dose gradients possible. For patients with a limited number of brain metastases, the addition of SRS to whole brain radiotherapy prolongs functional independence and can increase survival.1
Radiation therapy treatment planning (TP) relies on computed tomography (CT) images which may be registered to various imaging modalities.2 For SRS TP, target delineation based on magnetic resonance imaging (MRI) is generally preferred over CT due to increased soft tissue definition.3 However, it is also recognised that MRI is prone to intrinsic geometric distortion, potentially rendering the image spatially incorrect, and impacting delineation and true coverage of the target. 4 Therefore, CT images are used to define the stereotactic space as they are not inherently affected by distortion.
The MRI scan was defined in stereotactic space using Leksell GammaPlan® v11.1.1 (LGP) based on fiducial markers obtained from the indicator box attached to the Leksell® Coordinate Frame G (Elekta AB, Stockholm, Sweden) which was attached to the patient. The fiducial markers were identified on each image slice and an automatic registration process applied. A mean definition error (MDE) is generated by the LGP program for each defined image through comparing the predicted and actual locations of the fiducials.5 This value may reflect the magnitude of distortion present in the MRI but can also vary with magnetic field strength, specific MRI units and sequences acquired. The uncertainty associated with this variation may also change depending on the clinical context, and as such, there is no universal defined tolerance for an acceptable MDE.6 A single value for department MDE threshold has not been reported in this manuscript because it can require clinical judgement that is hard to quantify. Typically, a mean value less than the imaging slice thickness would be expected. It is important to investigate the implications of this shifting metric as the MDE value alone does not provide insight into the direction of distortion. Thus, regular quality assurance (QA) checks to confirm stability of this measured value are required to ensure precision of therapy. Specific MRI distortion should be investigated and measured for each unique clinical setting.2
Several authors have attempted to measure MRI distortion and its effects on LGK treatment.4, 5, 6, 7, 8 Specifically, both Seibert and Pappas et al. investigated distortion on a 3T scanner, similar to that used at the Gamma Knife® Centre of Queensland (GKCoQ).4, 6 These studies indicated MRI distortion increases towards the image periphery, when a LGK frame is present and when higher Tesla MRI scans are used. However, there is a lack of published literature on this topic examining potential impact on target coverage.
This study aimed to measure inherent MRI distortions for frame‐based treatments at a single centre used for LGK target delineation. It was envisaged that the findings of this investigation could provide a tool to contextualise the mean scanner distortion values provided by LGP for this department and also inform future research on this topic.
Methods
This study consisted of two parts: (1) the development of a model using previous scans of the QUASARTM GRID3D (Modus Medical Devices Inc., London, Canada) phantom from the primary MRI used for LGK TP at GKCoQ and (2) application of the model retrospectively to ten patients with brain metastases treated at GKCoQ. Institutional ethics approval was obtained for this quality improvement study from Metro South Human Research Ethics Committee, HREC/LNR/18/QMS/4787, and Queensland University of Technology, 1900000055.
Imaging
Imaging was performed using a Skyra 3T MRI scanner (Siemens Healthcare, Erlangen, Germany) with the frame located on the MRI couch, according to the departmental protocol for brain metastases LGK TP. The pulse sequence parameters used for 3D Magnetization Prepared‐Rapid Gradient Echo (MP‐RAGE) with repetition time, inversion time and echo time of 2300, 900 and 3.1 ms respectively. The bandwidth was 250 Hz/pixel. The slab select direction was superior‐inferior and the readout direction was posterior‐anterior. The reconstructed pixel size was 0.66 mm × 0.66 mm (right‐left × posterior‐anterior) and slice thickness of 1.5 mm (superior–inferior). The Leksell frame was located using the supplied adaptor.
Phantom study
Distortion correction data were acquired by imaging a phantom of known grid spacing in the MRI scanner used for the planning data sets. Imaging was performed with the frame base plate in situ. The QUASARTM GRID3D Image Distortion Analysis System phantom was used. This phantom is an acrylic grid with channels of 1 cm spacing, with specified accuracy of 0.1 mm, filled with copper sulphate solution (Fig. 1). There are 14 × 13 × 11 channels in the superior‐inferior, posterior‐anterior and right‐left directions respectively (where these anatomical axes correspond to those of a patient when positioned head‐first supine in the scanner).
Figure 1.
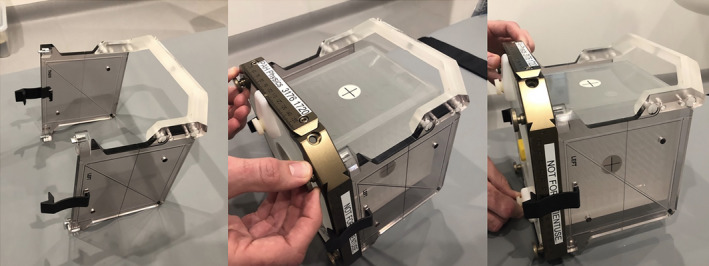
QUASARTM GRID3D Image Distortion Phantom and MRI localizer box.
Model development
Construction of ‘required correction’ versus ‘measured coordinate’ map
The MRI data set of the phantom was imported into the LGP software (v11.1.1, Elekta Instrument AB, Stockholm, Sweden). The stereotactic coordinate system was defined by rigidly registering the coordinate system of the image data set to the Leksell coordinate system based on the location of the fiducials in the marker box, which was fixed to the phantom. Positions of the phantom’s grid vertices were manually measured with a crosshair in the planning software. As it was not feasible to measure the location of all 2002 vertex positions, a coarser grid of 125 positions (5 × 5 × 5) was measured. The measured locations along each axis were 30, 70, 100, 130 and 160 mm for the superior‐inferior direction, 40, 70, 100, 130 and 160 mm for the anterior‐posterior direction and 50, 80, 100, 120 and 150 mm for the right‐left direction which covered the extent of channels in the phantom (Fig. 2, left).
Figure 2.
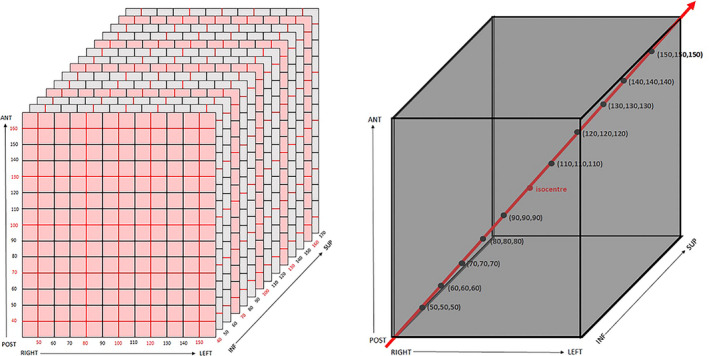
Schematics showing the 125 grid points used to construct interpolator (points at intersection of red lines and planes) and isocentre position (left), and the grid points used to check the interpolator accuracy (right).
The required correction along each of the three axes, for each measured grid location, was computed by subtracting the coordinate measured using the crosshair from the ‘true’ coordinate (within 0.1‐mm specification as supplied by the vendor’s documentation). Tri‐linear interpolation of this three dimensional ‘true’ versus ‘required correction’ provided the required correction along each direction for an arbitrarily measured LGP coordinate. This interpolator was constructed in Microsoft Excel (Microsoft Corporation, WA) using linear interpolation along the three spatial dimensions. The predicted correction was then applied to the initially measured coordinate to estimate the corrected position.
Checks of ‘required correction’ versus ‘measured coordinate’ map
A test of the correction technique was performed. The [x,y,z] coordinates (where x, y and z are the right‐left, post‐ant and sup‐inf directions respectively) of 10 grid points were measured (30 points total). These points were located along a diagonal of the phantom from (in millimetres) 50, 50, 50 to 150, 150, 150 in 10, 10, 10 increments (Fig. 2, right). This was the ‘pre‐correction’ data set. The coordinates of the pre‐correction data set were corrected using the interpolator. This was the ‘post‐correction’ data set. For both the pre‐ and post‐correction data sets, the absolute error of each measured coordinate was calculated. The mean of the absolute error () for the pre‐ and post‐correction data sets was compared using a one‐tailed t‐test. A one‐tailed t‐test was also used to compare the slopes of the regression lines of the absolute error versus distance from isocentre plots. Statistical analysis was performed using Excel (Microsoft Corporation, WA). A significance level of P = 0.05 was used.
Patient application
The model was applied retrospectively to a cohort of 10 patient plans to evaluate potential impact of MRI distortion‐based shot correction on target volume (TVol) coverage. Despite using a smaller patient cohort, multiple metastases were assessed. Patients included in this study were all treated for brain metastases using LGK at the GKCoQ. All included patients were
Treated with the LGK frame in a single fraction.
Treated between January 2018 and January 2019.
Recorded a MDE beyond the standard department value.
Treated with a single shot. Multiple shot plans were excluded to reduce uncertainty of the shot interaction. Single‐shot plans refer to the requirement of only one isocentre to cover the lesion.
Application of the model
For each shot treated for the 10 patients, the following was recorded: shot coordinates, tumour volume, MDE and dose prescription. The original ‘uncorrected’ shot coordinates were entered into the model and the ‘corrected’ shot coordinates were obtained. The original plan was copied in LGP, and the shot positions subsequently changed to reflect the ‘corrected’ shot position as indicated by the model. Copied plans were not recalculated. TVol coverage, selectivity (the proportion of the prescription isodose volume that is inside the TVol) gradient index, Paddick’s conformity index9 and minimum dose were recorded pre‐ and post‐shot correction. A vector of the three measurements from LGP (x,y,z) was calculated to determine the distance of the shots from the isocentre.
Radiation oncologist review
A radiation oncologist (RO) with expertise in LGK reviewed the results. Only plans receiving less than 98% coverage of the TVol of the prescribed dose after model correction were reviewed. Clinical significance of the changed TVol coverage was determined via a qualitative, experienced‐based approach by the RO based on various factors including tumour location, summative dose for multiple metastasis plans and effects of volume averaging on target delineation.
Results
Model results
A model was created in Excel, based on the ‘required correction’ versus the ‘measured coordinate’ map, which enabled the user to input a shot coordinate position, then view the models corrected shot position. Table 1 indicates tests of the model indicated significantly reduced mean error by 0.30 mm and variance by 0.09 mm (P = 0.008) for the post‐corrected shot coordinates. Furthermore, Figure 3 illustrates the decrease in absolute error and variance in the measured grid coordinates along a diagonal of the grid phantom for the pre‐ and post‐correction of the data set. A lower value for the post‐correction data set indicated that the correction technique reduced the effect of MRI distortion.
Table 1.
Results of a one‐tailed t‐test comparing the mean absolute error of measured grid coordinates along a diagonal of the pre‐ and post‐correction data sets.
| Total error of models prediction | ||
|---|---|---|
| Pre‐correction | Post‐correction | |
| Mean (mm) | 0.67 | 0.37 |
| Variance (mm2) | 0.10 | 0.01 |
P‐value = 0.008.
Figure 3.
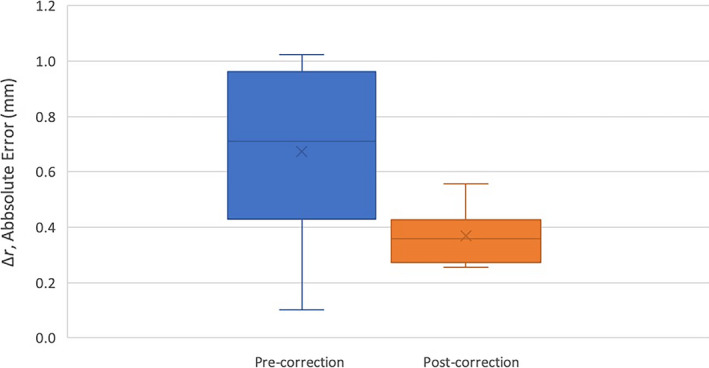
Absolute error, , of measured grid coordinates along a diagonal of the grid phantom for the pre‐ (left, blue) and post‐correction (right, orange) data sets (as illustrated in Fig. 2). The cross represents the mean. The lines in descending order represent the maximum, 3rd quartile, median, 1st quartile and minimum values of data.
Results of a one‐tailed t‐test comparing the slope, mr , of the absolute error versus distance from the isocentre indicated that the slope of the post‐correction error versus distance from the isocentre was significantly less than for the pre‐correction data (0.11 mm per cm from the isocentre versus 0.02 mm per cm, P = 0.001). Further, a one‐tailed t‐test showed that the post‐correction slope was not significantly different to zero (P = 0.09). Since MRI distortion is known to increase with distance from the isocentre, a lower post‐correction slope demonstrated by Figure 4 indicated improvement with the interpolator model applied to the data set.
Figure 4.
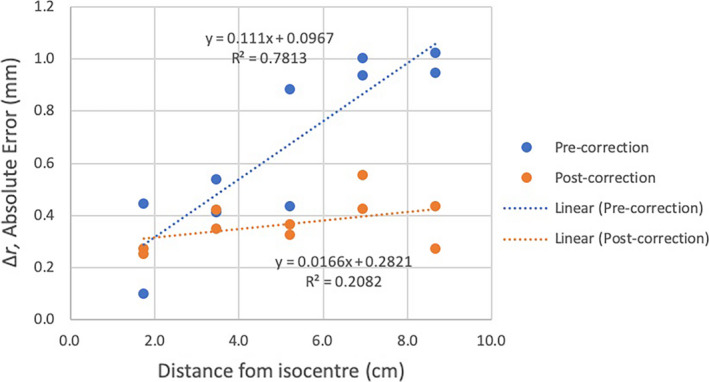
Plots of absolute error in measured grid position,, versus distance of grid point from isocentre for the pre‐correction (blue symbols) and post‐correction (orange symbols) data sets, together with corresponding linear regression plots (dotted lines).
Patient results
A total of 44 metastases located in all sections of the brain were investigated. These targets were previously defined by an experienced RO using the contouring tools available in LGP. The mean volume of the metastases was 0.12 cc (0.01cc–1.56 cc). Twenty‐one (47%) retained TVol coverage of 98‐100% and 23 (53%) demonstrated reduced coverage below 98% post‐shot correction. These 23 were assessed for clinical significance of the decreased coverage by the RO who was asked to review dose coverage directly on the MRI images in LGP. Six metastases were considered to demonstrate clinically relevant changes based on this qualitative review (Table 2). Figure 5 shows an example of a changed shot position which resulted in a clinically significant change in coverage. The metastases which retained coverage were located a mean distance of 56.21 mm (± 19.98 mm) from the image isocentre and had a mean volume of 0.17 cc (± 0.33 cc). In comparison, the 23 metastases which showed reduced coverage were located further away at a mean distance of 64.88 mm (± 13.29 mm) from the image isocentre and had a smaller mean volume of 0.06 cc (± 0.07 cc). There was one outlier which was located 35.96 mm from the isocentre and showed clinically significant reduced coverage. Metastases which indicated clinically significant changes were located a mean distance of 67.88 mm (± 17.96 mm) from the image isocentre and had a mean volume of 0.03 cc (± 0.01 cc). Additional statistics recorded including the Paddick’s conformity index did not distinguish any clinically meaningful differences between the groups.
Table 2.
Location, volume, distance from the image isocentre and change in coverage for metastases which recorded clinically significant TVol coverage change. (SD – standard deviation).
| Identification | Distance from image isocentre (mm) | Coverage – % change | Volume (cc) |
|---|---|---|---|
| Patient 1: Right Frontal Lobe | 80.24 | 4% | 0.015 |
| Patient 2: Right Parietal Lobe | 73.88 | 1% | 0.042 |
| Patient 7: Right Cerebellum | 35.96 | 9% | 0.025 |
| Patient 7: Right Frontal Lobe | 82.32 | 17% | 0.034 |
| Patient 9: Right Temporal Lobe | 57.56 | 7% | 0.032 |
| Patient 10: Right Parietal Lobe | 77.33 | 3% | 0.051 |
| Mean distance from the centre (SD): | 67.88 mm (± 17.96 mm) | ||
Figure 5.
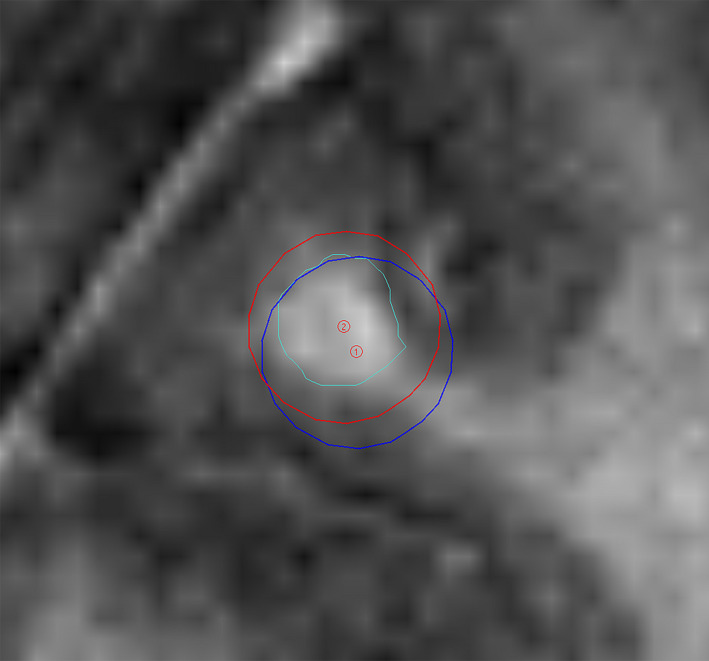
Example of a changed shot position for a right frontal lobe metastasis pre‐ (red) and post‐ (blue) interpolator correction (Metastasis – outlined in green).
Discussion
This investigation was a pilot study which provided insight into the inherent distortion apparent with the primary MRI used for LGK planning at the GKCoQ. Using Excel, a model was created to predict the changed shot position based on the total geometric distortion determined in the phantom study. This model predicted the potential change to the shot position for a specific MRI MDE and found that MRI distortion had greatest effect on target coverage for smaller targets (mean 0.06 cc) located further away from the image isocentre (mean 64.88 mm).
Several authors have previously investigated the effects of MRI distortion for LGK using various methods. A common approach was to compare ‘control point’ positions between CT and MRI scans to derive the effects of distortion.6, 7, 10 A different method utilised by Seibert et al.4 used the reversal of vendor correction on an MRI to compare the displacement of gross tumour volumes (GTV). The use of interpolation maps to calculate distortion was suggested by the earlier work of Wang, Doddrell and Cowin11 who used measured and known control point locations from a phantom to calculate the MRI distortion. The investigation summary suggested this approach could be applied in the radiosurgery setting. Interestingly, more recent work by Pappas et al.6 mapped the distortion in their study for LGK using interpolation, however, did not present a clinical tool for practitioners to calculate effects of distortion.
The method proposed in this study instead presented the results of distortion mapping as a tool which can be used to easily visualise effects of distortion during LGK TP. This method also varies from the work of Pappas et al.6 as a CT scan was not required for a reference position, instead known coordinate positions of the phantom grid points were assumed based on manufacture guidelines. This was done in an attempt to reduce co‐founding effects of human error when evaluating points on a CT scan. The resultant model was a tool for GKCoQ staff, only requiring the shot position values to be entered in Excel, avoiding the need for complex mathematical input. In a clinical scenario, such a model could be used by staff to contextualise the potential impact of MRI MDE.
The model correction technique was tested. The significantly lower for the post‐correction data set of 0.01 (P = 0.005) and reduced variance in residual error post‐correction indicated that the interpolator correction technique reduced the effect of MRI distortion on the shot coordinate position. The lower post‐correction slope for error versus distance from the isocentre demonstrated a decrease in absolute error following correction. The residual post‐correction error found was likely attributed to inaccuracies in measuring the grid point position using the crosshair tool, finite voxel size (0.66 × 0.66 × 1.50 mm3) and the 0.10‐mm specification of the true location of the grid points.
Several studies report increased distortion towards the image periphery2, 5, 8 which increasingly effected the coverage of these volumes.4, 6, 12 The results of this investigation suggested a similar trend. Metastases which maintained coverage were on average located closest to the imaging isocentre, whilst those with reduced coverage were further away from the imaging isocentre. Results also suggested that metastases which demonstrated reduced coverage were on average three times smaller than those which maintained coverage. This is consistent with the findings of Pappas et al.6 This is likely attributed to the greater probability a shot has at missing a larger percentage of a small lesion when compared with larger targets.
This pilot study may act as a guide for clinical decision making. The results demonstrated the treatment accuracy of metastases with LGK, however, there should be an awareness of the potential clinical effects of MRI distortion. In circumstances where MDE levels beyond standard department values are identified, and a small metastasis is located near the image periphery, the RO should be notified and potential effects investigated.
Various methods have been described in the literature for accounting for the impact of image distortion on TVol coverage. Karaiskos et al.12 suggested the use of 1‐mm margins to account image uncertainty, however, acknowledged that this can increase the brain toxicity risk. Seibert et al.4 echoed this, adding that predicting the appropriate margin for a volume can be difficult. This was not included within the scope of this work. It should be acknowledged that there are multiple factors which can introduce error into accurately delivering treatment including not only MRI distortion but also inter‐user variability with target voluming and treatment design, effects of volume average thickness and patient‐specific factors.5
There were several limitations to this study. This model only predicts the changed shot coordinate position for a specific MDE imaged using the MRI machine and conditions specified. Therefore, the model may not accurately predict for cohorts of patients outside of these parameters. Moreover, the phantom‐based model does not take into account factors such as chemical shift which may occur for patients.5 Additionally, the model is only based on a single scan, not an average of scans performed over a period of time meaning there may have been factors unknowingly affecting the phantom MRI image on that day. It is also important to acknowledge that outlining the GTV on the MRI scans may have also originally been affected by inherent distortion. Moreover, it is possible that error was introduced by the manual measurement of the vertices points for the model creation. Finally, the model was only retrospectively applied to a cohort of 10 patients which is not an adequate sample size to calculate statistical significance of the map correction or impact of tumour pathology. In future, this work could be extended to include further cases to address this.
Conclusion
A model was created in this pilot study which allowed potential effects of MRI distortion on LGK shot placement to be studied. The distortion was mapped, and an interpolator was constructed in Excel to estimate the changed shot position due to distortion. This simple spreadsheet allows practitioners to contextualise the implications of distortion for shot placement. Results suggest MRI distortion can affect target coverage and the developed model may be one method to assess its impact. Furthermore, MRI distortion may have a greater effect on smaller targets located at the image periphery. This project may prompt further investigations at the GKCoQ including model validation in other cohorts such as frameless treatments.
Conflicts of Interest
The authors declare no conflict of interest.
Acknowledgements
The authors wish to acknowledge the staff and management of ROPAIR and GKCoQ for their support of the study.
J Med Radiat Sci. 68(2021) 274–281
References
- 1.Andrews D, Scott C, Sperduto P, et al. Whole brain radiation therapy with or without stereotactic radiosurgery boost for patients with one to three brain metastases: phase III results of the RTOG 9508 randomised trial. Lancet 2004; 363: 1665–72. [DOI] [PubMed] [Google Scholar]
- 2.Alzahrani M, Broadbent D, Chuter R, et al. Audit feasibility for geometric distortion in magnetic resonance imaging for radiotherapy. Phys Imaging Radiat Oncol 2020; 15: 80–4. [DOI] [PMC free article] [PubMed] [Google Scholar]
- 3.Weygand J, Fuller CD, Ibbott GS, et al. Spatial precision in magnetic resonance imaging‐guided radiation therapy: the role of geometric distortion. Int J Radiat Oncol, Biol, Phys 2016; 95: 1304–16. [DOI] [PubMed] [Google Scholar]
- 4.Seibert TM, White NS, Kim G‐Y, et al. Distortion inherent to magnetic resonance imaging can lead to geometric miss in radiosurgery planning. Pract Radiat Oncol 2016; 6: 319–28. [DOI] [PMC free article] [PubMed] [Google Scholar]
- 5.Moutsatsos A, Karaiskos P, Petrokokkinos L, et al. Assessment and characterization of the total geometric uncertainty in Gamma Knife radiosurgery using polymer gels. Med Phys 2013; 40: 31704. [DOI] [PubMed] [Google Scholar]
- 6.Pappas E, Alshanqity M, Moutsatsos A, et al. MRI‐related geometric distortions in stereotactic radiotherapy treatment planning: evaluation and dosimetric impact. Technol Cancer Res Treat 2017; 16: 1120–9. [DOI] [PMC free article] [PubMed] [Google Scholar]
- 7.Pappas E, Seimenis I, Moutsatsos A, Georgiou E, Nomikos P, Karaiskos P. Characterization of system‐related geometric distortions in MR images employed in gamma knife radiosurgery applications. Phys Med Biol 2016; 61: 6993–7011. [DOI] [PubMed] [Google Scholar]
- 8.Calusi S, Noferini L, Marrazzo L, et al. γTools: a modular multifunction phantom for quality assurance in GammaKnife treatments. Phys Med 2017; 43: 34–42. [DOI] [PubMed] [Google Scholar]
- 9.Stanley J, Breitman K, Dunscombe P, Spencer D, Lau H. Evaluation of stereotactic radiosurgery conformity indices for 170 target volumes in patients with brain metastases. J Appl Clin Med Phys 2011; 12: 245–53. [DOI] [PMC free article] [PubMed] [Google Scholar]
- 10.Abbas AS, Moseley D, Kassam Z, Kim SM, Cho C. Volumetric‐modulated arc therapy for the treatment of a large planning target volume in thoracic esophageal cancer. J Appl Clin Med Phys 2013; 14: 192–202. [DOI] [PMC free article] [PubMed] [Google Scholar]
- 11.Wang D, Doddrell DM, Cowin G. A novel phantom and method for comprehensive 3‐dimensional measurement and correction of geometric distortion in magnetic resonance imaging. Magn Reson Imaging 2004; 22: 529–42. [DOI] [PubMed] [Google Scholar]
- 12.Karaiskos P, Moutsatsos A, Pappas E, et al. A simple and efficient methodology to improve geometric accuracy in gamma knife radiation surgery: implementation in multiple brain metastases. Int J Radiat Oncol Biol Phys 2014; 90: 1234–41. [DOI] [PubMed] [Google Scholar]


