Abstract
Emerging appreciation for the hyperdirect pathway (HDP) as an important cortical glutamatergic input to the subthalamic nucleus (STN) has motivated a wide range of recent investigations on its role in motor control, as well as the mechanisms of subthalamic deep brain stimulation (DBS). However, the pathway anatomy and terminal arbor morphometry by which the HDP links cortical and subthalamic activity are incompletely understood. One critical hindrance to advancing understanding is the lack of anatomically detailed population models which can help explain how HDP pathway anatomy and neuronal biophysics give rise to spatiotemporal patterns of stimulus-response activity observed in vivo. Therefore, the goal of this study was to establish a population model of motor HDP axons through application of generative algorithms constrained by recent histology and imaging data. The products of this effort include a de novo macaque brain atlas, detailed statistical analysis of histological reconstructions of macaque motor HDP axons, and the generation of 10,000 morphometrically constrained synthetic motor HDP axons. The synthetic HDP axons exhibited a 3.8% mean error with respect to parametric distributions of the fiber target volume, total length, number of bifurcations, bifurcation angles, meander angles, and segment lengths measured in BDA-labeled HDP axon reconstructions. As such, this large population of synthetic motor HDP axons represents an anatomically based foundation for biophysical simulations that can be coupled to electrophysiological and/or behavioral measurements, with the goal of better understanding the role of the HDP in motor system activity.
Keywords: Basal ganglia, Brain atlas, Monkey, Subthalamic nucleus
1. Introduction
Neuroanatomical and electrophysiological studies have provided an ever-evolving understanding of the interactions between the cerebral cortex and basal ganglia (BG) [Parent & Hazrati, 1995; Nelson & Kreitzer, 2014]. Disruption to the direct and indirect pathways have long been considered contributors to the pathophysiology of Parkinson’s disease [Alexander et al., 1991]. However, the hyperdirect pathway (HDP), which provides a direct connection from cerebral cortex to the subthalamic nucleus (STN), has also been recognized as an important component of the network interactions of the BG [Nambu et al., 2002].
The majority of glutamatergic inputs to the STN arise from layer V cortical pyramidal neurons that form the HDP [Haynes & Haber, 2013; Mathai et al., 2015]. The HDP bypasses the striatum to provide a short latency mechanism for cortical information to reach the BG [Nambu et al., 1996; Polyakova et al., 2020]. As such, the role of the HDP in the network processing of the BG, as well as the mechanisms of subthalamic deep brain stimulation (DBS), have become focuses of recent research.
To better understand the neuroanatomy of the motor HDP, Coudé et al. [2018] reconstructed 24 macaque HDP axons from biotinylated-dextran amine (BDA) injections in the primary motor cortex (M1). Similar to results observed from rodent HDP axons [Kita & Kita, 2012], they found that HDP axon collaterals to the STN arise from long-range corticofugal fibers (Figure 1). However, the anatomical and morphometric diversity of these reconstructed axons suggests that the HDP from M1 is not exclusively devoted to the dorso-lateral STN and there exists substantial variability in the subthalamic axon arbor [Coudé et al., 2018]. While 24 samples are unlikely to represent the complete morphometrics of the motor HDP, those results do provide invaluable data for defining initial estimates on parametric distributions to characterize the axonal trajectories and branching of motor HDP axons. Understanding those axonal characteristics is important for estimating the structural connectivity of the motor HDP with the BG [Haynes & Haber, 2013; Plantinga et al., 2018], as well as characterizing the neural response to electrical [Bower & McIntyre, 2020] or optical [Yu et al., 2020] stimulation.
Figure 1.
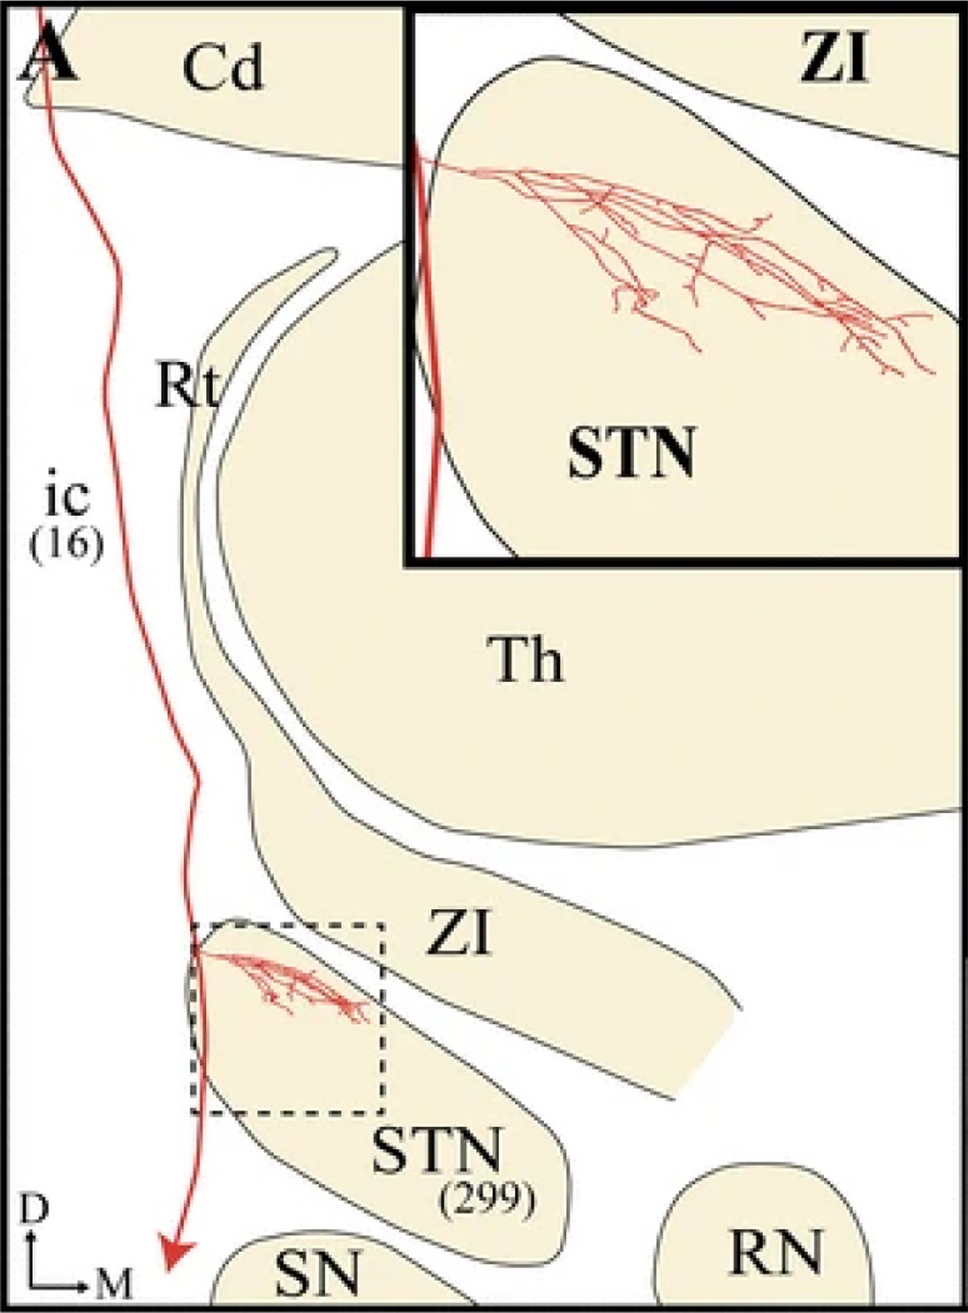
Hyperdirect pathway axon. Composite two-dimension reconstructions from serial horizontal sections of a single BDA-labeled M1 axon projecting to the subthalamic nucleus (STN) and toward lower brainstem regions (red line). This reconstruction was obtained by superposing all serial sections containing labeled axonal profiles onto a single two-dimension frame (adapted from Coudé et al. [2018]).
The first goal of this project was to perform statistical analyses of the Coudé et al. [2018] reconstructed axons to obtain morphometric estimates for the motor HDP. Characterizing the morphometrics provides the necessary inputs for generative methods to create models of HDP axonal arbors in the subthalamic region. Therefore, the second goal of this project was to create a large population of synthetic motor HDP axons that corresponded with the morphometrics of the histologically reconstructed motor HDP axons. The results of this project provide an anatomical framework for future exploration of the biophysical mechanisms underlying motor HDP responses to endogenous or exogenous inputs.
2. Methods
2.1. Cynomolgus Macaque Brain Atlas
An important component for understanding the anatomy of reconstructed fibers is being able to visualize them within a detailed representation of the overall brain volume. Coudé et al. [2018] focused on documenting the single neuron anatomy of HDP axons from primary motor cortex. Unfortunately, whole brain imaging data was not available to construct an accurate 3D brain model containing the labeled cortical and subcortical volumes associated with their HDP axonal reconstructions. Therefore, we set out to contextualize the Coudé et al. [2018] results in an atlas-based brain volume model of the cynomologus macaque.
Construction of the 3D brain volume involved multiple steps that are outlined in Figure 2. The inputs were a brain imaging dataset from Frey et al. [2018], as well as a cortical and subcortical rhesus macaque atlas of nuclei from Chakravarty et al. [2008]. The brain imaging dataset was an average of 18 T1-weighted MRIs of normal young adult cynomolgus macaque brains from [Frey et al., 2011]. Briefly, the skull and ocular orbital region were stripped to isolate the pial, cortical, and subcortical regions using AFNI v20.0.06 and FreeView (a GUI tool distributed with FreeSurfer v6.0.0)(Figure 2.1) [Cox, 1996; Fischl, 2012]. Nonlinear transformation of the skull-stripped cynomolgus brain into the rhesus macaque brain space was accomplished using the affine AFNI 3dwarp program (Figure 2.2). Then the rhesus macaque atlas was applied as a mask to the transformed cynomolgus brain and to assign cortical and subcortical structural labels. Holes in the output were inspected and repaired using FreeView (Figure 2.3) [Fischl 2012]. The fourth step was to reverse the spatial transformation applied to the cynomolgus brain in the second step (Figure 2.4). The fifth step was application of AFNI 3dAutomask (Figure 2.5), which uses the nearest neighbor algorithm to automatically fill holes that might have appeared during the reverse spatial transformation process. A script of AFNI and FreeSurfer commands corresponding to steps 1–5 (Figure 2) are provided as supplemental material. The last step was to apply 3D Poisson surface reconstruction to yield a water-tight mesh for visualization (Figure 2.6)
Figure 2.

3D brain volume creation. Steps in co-registration of averaged cynomolgus brain with rhesus macaque atlas. Steps 2, 3, and 4 were performed with the software tool AFNI [Cox 1996]. Steps 1 and 5 required AFNI subroutines and FreeView for visual validation and manual correction [Fischl 2012]. Step 6 was implemented using the methods of Kazhdan & Hoppe [2013].
Figure 3 displays 14 slices from the rhesus macaque atlas mask with the transformed averaged cynomolgus brain as a background. The resampled atlas brain consisted of 187 horizontal, 294 coronal, and 233 lateral sections with a resolution of 250μm-cubed. The atlas contained 254 labeled structures [Chakravarty, et al. 2008]. An additional mask was created from the original rhesus atlas to represent more general white and grey matter segmentation and was used as a sandwiched layer between the structural atlas and the transformed cynomolgus brain. Once these structures were pasted down and the transformation was reversed, nearest neighbor smoothing was applied to smooth a few discontinuities which were introduced during the remapping. In the case of a few labeled regions which were smoothed out (≈5 of 254), FreeView was used to manually add them back in to ensure that the new structural mapping agreed with the original rhesus labels. Poisson surface reconstruction (PSR) was then used to create surface meshes for the pial surface and the STN using the method of Kazhdan & Hoppe [2013]. The method was parameterized with an oct-tree depth of 5 and default values were used for all other parameters. Pial and STN meshed surfaces are presented in Figure 3.
Figure 3.

3D brain volume. Diorama showing horizontal and coronal slices of the co-registration of the rhesus atlas and cynomolgus brain in cynomolgus brain space. The registration resulted in 233 sagittal, 294 coronal, and 187 horizontal slices at a spatial resolution of 250 μm3. To the right, Poisson surface reconstructions of pial (grey) and STN (red) structures, displayed from a lateral view.
2.2. Explicit Motor HDP Reconstructions
The original HDP fiber models used in our analyses were derived from the explicit reconstructions reported in Coudé et al. [2018], without any gross modifications. There were, however, necessary preprocessing steps. For example, some of the 3D points in the histological reconstructions were originally documented in reverse order or with minor discontinuities that were manually addressed using NeuroMorphoVis and Neotube [Feng,et al. 2015; Abdellah, et al. 2018]. Neotube was then used to isolate the relevant terminal arbor from the entire morphology for later analysis. This was done with great care to ensure that the isolated terminal arbors were only those which entered the STN.
The explicit reconstructions from Coudé et al. [2018] yielded a total of 24 different HDP axonal arbors from 4 cynomolgus macaque brains (Figure 4). From these, we extracted 5 fundamental statistical distributions describing their global morphometric and axonal branching features. These morphometrics were then used to constrain algorithms for generating unique synthetic morphologies that were intended to be representative of motor HDP axons.
Figure 4.
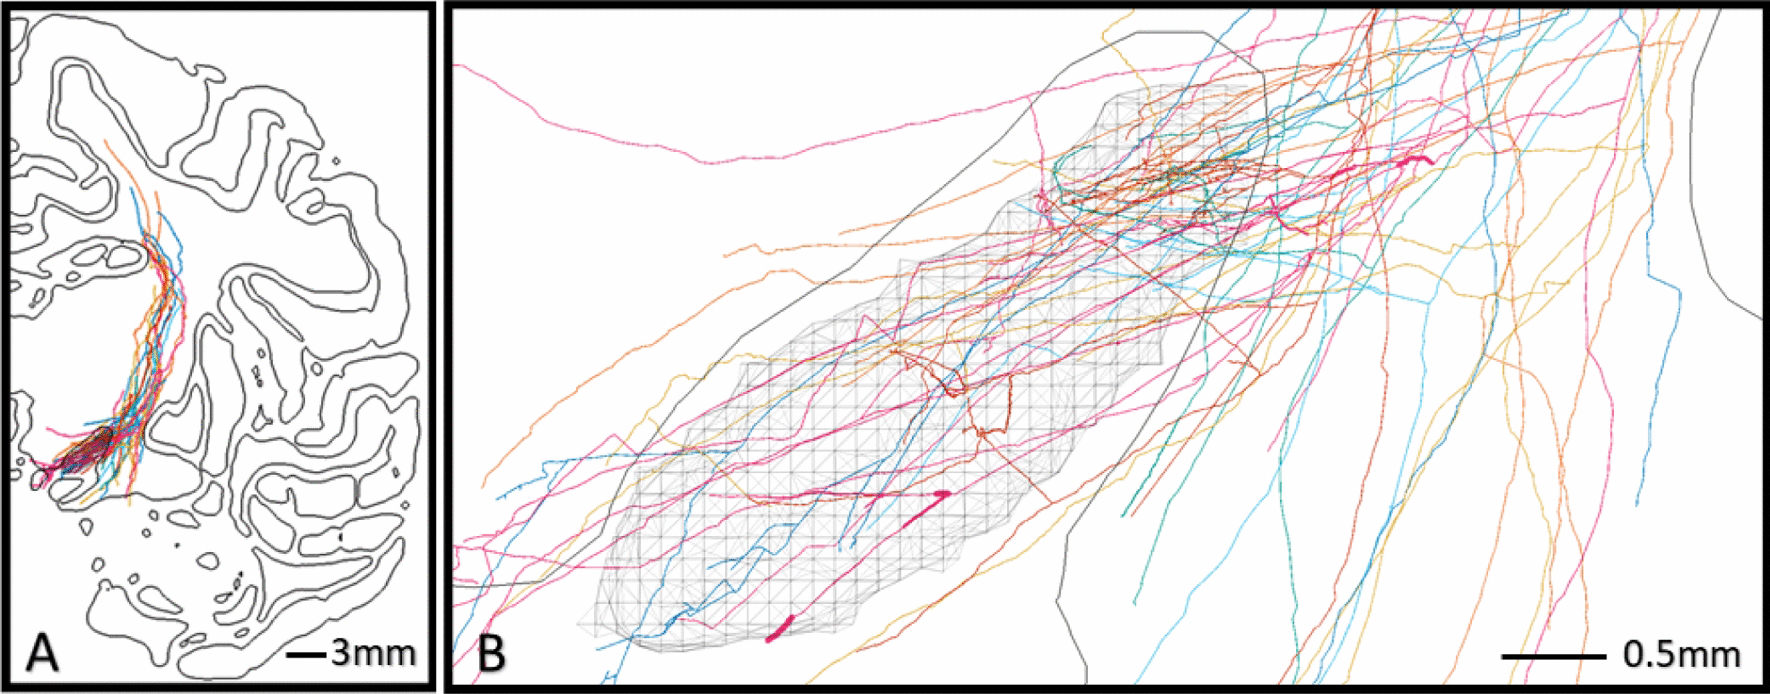
Explicit motor HDP reconstructions in the STN. Visualization of 24 HDP axons registered with the 3D cynomolgus brain atlas. A) Cut-plane view of the left hemisphere showing organization of axons within the internal capsule and collateralizations which principally target the STN (hatched volume). B) Topography of collaterals within the subthalamic region shows a focus on the dorsal STN, but axon collaterals also innervate the medial and ventral regions of the STN.
The 24 explicit motor HDP fiber models were imported into the cynomolgus macaque brain atlas. All of the fiber models were consolidated to the left hemisphere of the brain atlas, such that they satisfied both the contour tracings provided by Coudé et al. [2018] and the surface reconstruction of the STN in the brain atlas. This was accomplished without the need for any anatomical distortions or global scaling in either the fibers or the cynomolgus atlas brain (Figure 4).
2.3. Synthetic HDP Model
The motor components of the HDP connect the motor cortex to the brain stem, and send an axon collateral to the STN. Generation of a synthetic motor HDP fiber system comprised of two main stages: 1) spline-based corticofugal fiber creation with algorithmic jittering (Figure 5A & 6A), and 2) algorithmic generation of subthalamic axon collaterals (Figure 5B & 6B–E). The first step in approximating the HDP was identifying the trajectory of the corticofugal fiber (CCF). To facilitate this process, we made a few assumptions in the generation of synthetic CCFs. First, we assumed that jitter in the explicitly reconstructed fibers that occurred at large length-scales (>75μm) was smoother than it appeared in the histology due to slicing artifacts and multi-subject co-registration. Second, jitter occurring at small length-scales (<75μm) was likely accurate but dependent on segment length (the distance between control points used for reconstruction).
Figure 5.
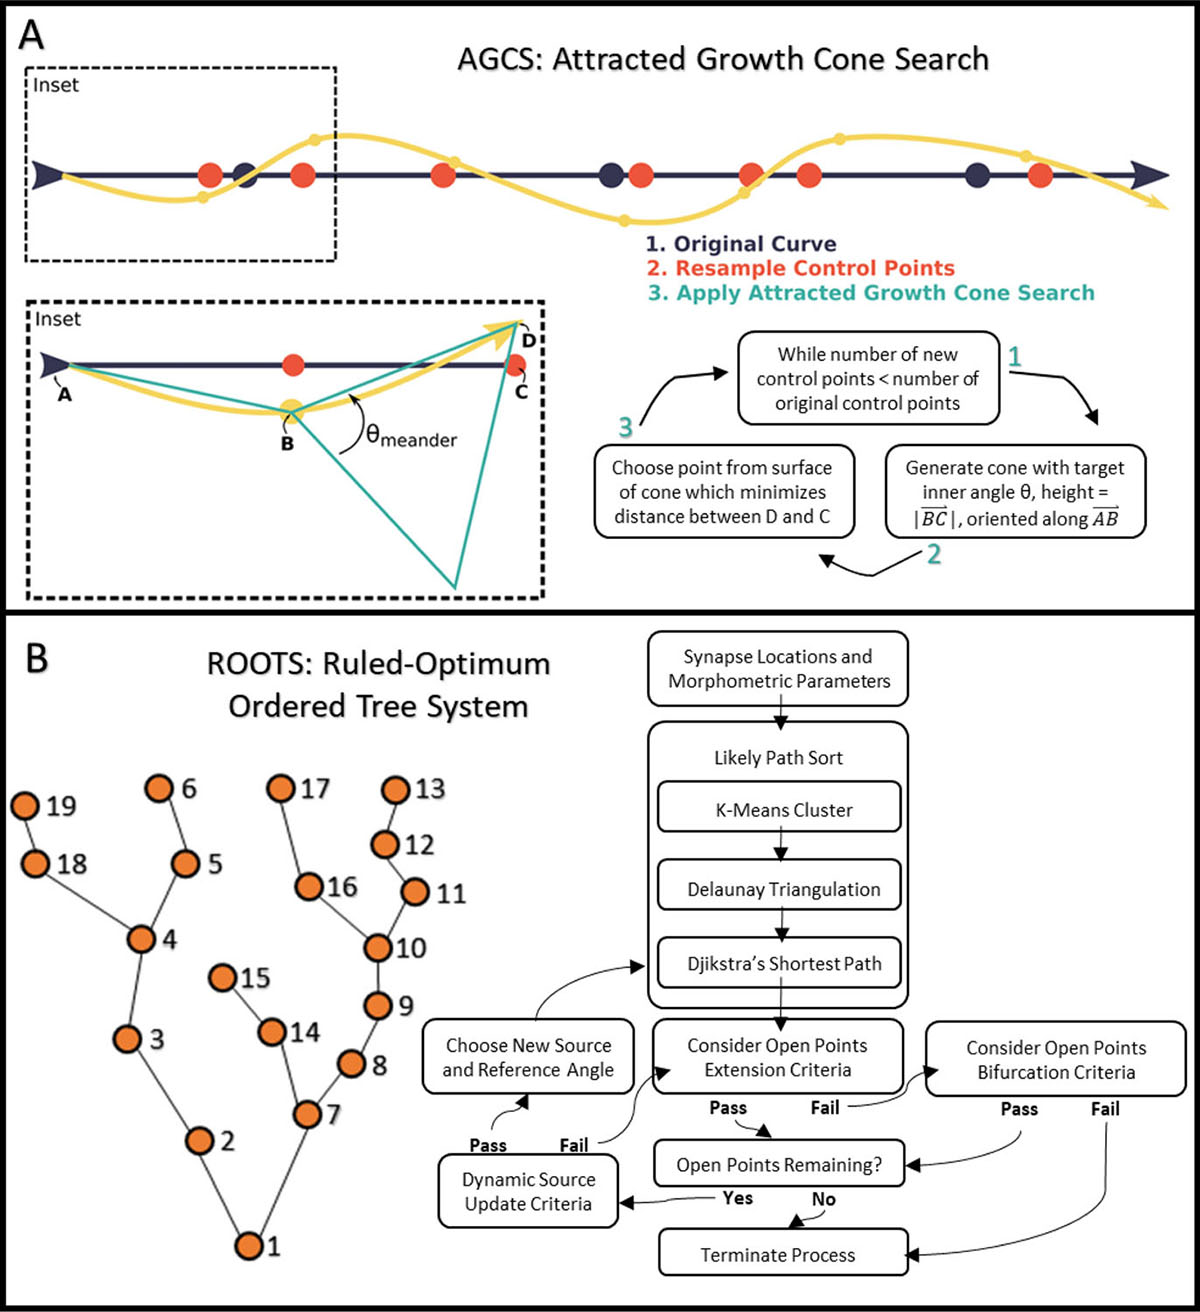
Methods for synthetic axon generation. A) Depiction of the novel Attracted Growth Cone Search algorithm which can be used to ensure meander angles are appropriate at an experimentally determined sampling resolution (spatial scale). B) Example of the Ruled-Optimum Ordered Tree System (ROOTS) generating a constrained tree through a set of predefined control points [Bingham, et al. 2020].
Figure 6.
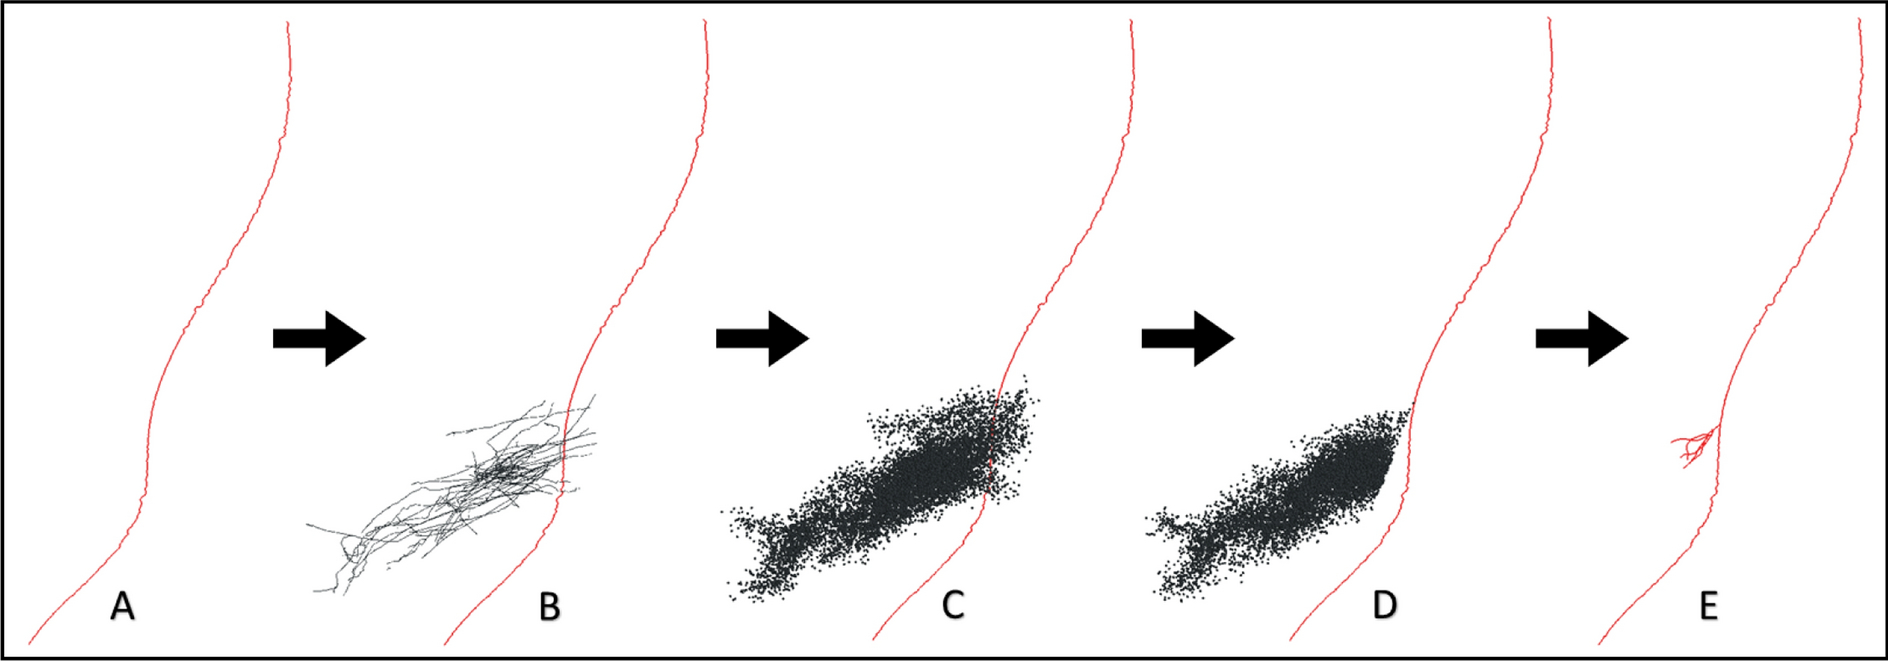
Synthetic HDP generation. A) Example synthetic corticofugal (CCF) fiber (red line). B) Control points from the explicit HDP reconstructions (black lines) were spatially combined with the synthetic CCF. C) Explicit HDP control points were spatially resampled (black dots) to bootstrap the volume that synthetic arbors may target within the STN region. D) A bifurcation point and cone filter was chosen for each CCF to target the dorso-lateral STN. E) The ROOTS algorithm was applied to the cone filtered control points to generate a synthetic HDP terminal arbor.
Given our first assumption, we justified taking a simple spline-based approach to constructing synthetic CCFs. Following averaging of explicit CCFs and manual fine-tuning of the initial spline, a generator function was written which outputted a single CCF with random co-shifts of spline control points to yield a unique curve for each instance (Figure 6A). An attracted growth cone search algorithm (AGCS; Figure 5A) was developed and applied to ensure that both segment lengths and meander angles were reconstituted in the synthetic CCFs. Iterating through each control point, a cone with a specified internal angle was created and a point from the rim of this cone was selected to minimize the distance from the new point and the control curve (spline basis). This process was executed until a new curve with appropriate jitter was created.
Prior to generating synthetic HDP terminal arbors in the subthalamic region, an inventory of known features was collected from the histological reconstructions (see Results). These included a volume within which control points may be found that coincided with statistical distributions of bifurcation count, bifurcation angles, and total arbor length. While the topography of known growth targets exerts ample constraint on possible branching patters, the number of possible trees may still be as many as n*(n−2) trees that span a set of targets (n) [Morales-Napoles et al., 2010]. Therefore, we employed the ROOTS (Ruled-Optimum Ordered Tree System) algorithm to generate anatomically plausible terminal arbors [Bingham, et al. 2020; Bingham, et al. 2018] (Figure 5B). ROOTS minimizes the quantity of membrane required to span a set of growth targets while satisfying user-specified branching criteria. For this study, those criteria included branch meander angle and length (“Extension Criteria”), bifurcation angle and length (“Bifurcation Criteria”). The number of bifurcations and total length were additional global constraints [Bingham, et al. 2020].
ROOTS did require some preprocessing to ensure that the control points passed to the algorithm resulted in a sensible and unique morphology. These included spatially resampling explicit HDP control points to bootstrap the volume that synthetic arbors could target within the STN region (Figure 6C), random selection of a bifurcation point from proximal candidate control points from each CCF (Figure 6D), and application of a cone filter to the STN control points using the bifurcation point as a source and the dorso-lateral STN as a target. The ROOTS algorithm was then applied to the cone-filtered control points with the bifurcation point as a source to generate synthetic HDP terminal arbors (Figure 6E).
2.4. Statistical Analysis
Morphometrics and validative comparison between synthetic and explicit morphologies were defined using kernel density estimates (KDE) constructed using a gaussian basis-kernel. The bandwidth (BDW) of gaussian basis-kernels were independently assigned for each metric according to the following equations:
| (1) |
| (2) |
Where A is the smaller of the standard deviation (STD) and the interquartile range (IQR) (divided by 1.34) of the measurements (x) and n is the number of independent measurements (length of x) [Silverman, 2018]. The use of KDEs and Silverman’s ‘rule-of-thumb’ estimate for bandwidth is an attempt to mitigate the arbitrariness of histogram representations. Density estimates also yield enhanced utility in downstream application of the results to cases where the nonparametric distributions may be resampled by generative models of axon morphology. Full range 2-D residuals with histological reconstructions as the reference were used to calculate Mean Normalized Root Mean Square Error (NRMSE) between KDEs. Mean NRMSE was used to quantify the error between morphometric distributions.
3. Results
3.1. Explicit HDP Reconstructions
The explicit reconstructions from histological data consisted of 24 HDP fibers that descend past the thalamus and caudate nucleus, within the internal capsule, and collateralized near the dorso-lateral STN (Figure 4). The initial axon collateral branch in the reconstructed fibers had a primary bifurcation from the CCF to the STN within a ~3mm region on the CCF in the internal capsule, which was ~1mm dorsal to the dorsal surface of the STN [Coudé et al., 2018]. Consequently, angles of approach for the HDP collaterals to the STN varied between longitudinal and horizontal. The subthalamic HDP collaterals then arborized with very high anatomic variability throughout the STN volume, with the highest density of fibers in the dorso-lateral STN. Notably, 10 collaterals exhibited very little arborization and perforated the STN en route elsewhere (Figures 4 & 7B-yellow example). In contrast, the remaining fibers arborized with complexity in the STN (Figures 4 & 7B-red example). Substantial spatial jitter was present in reconstructed fibers at a scale of ~25μm (Figure 7C).
Figure 7.
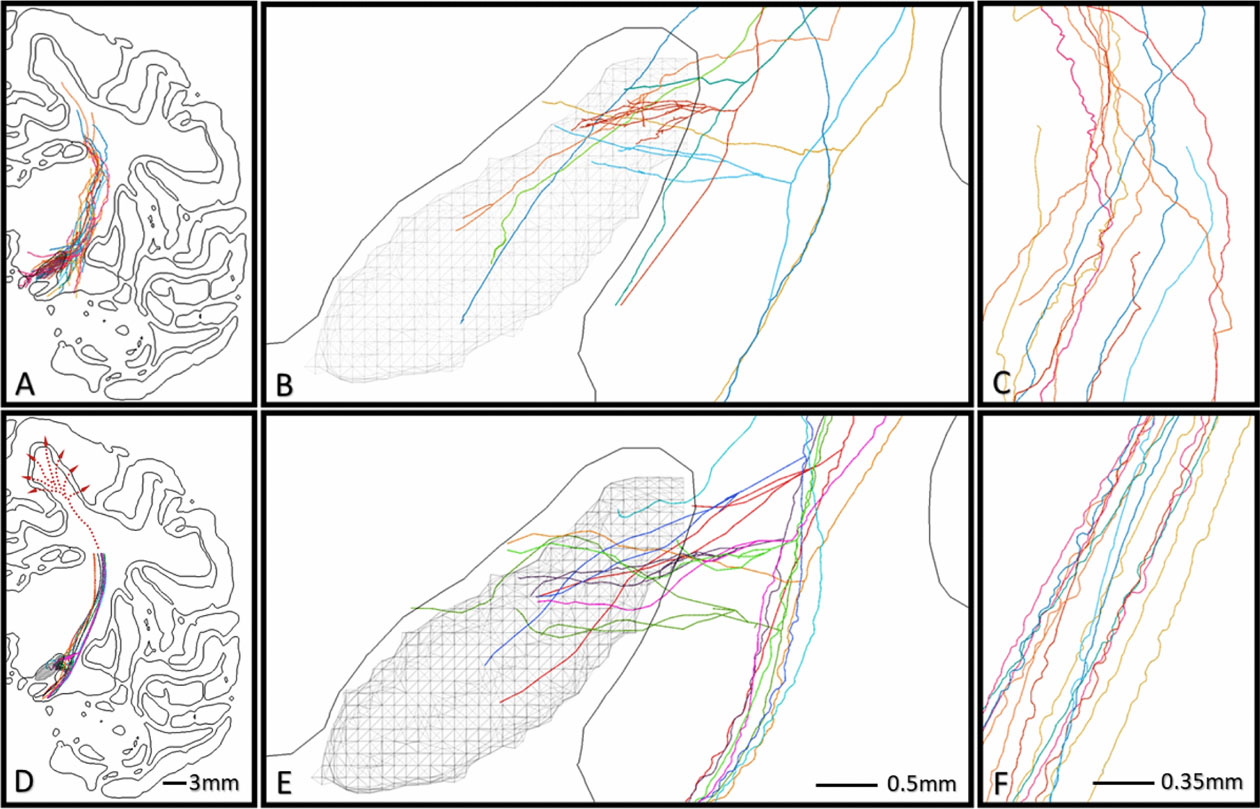
Comparison of HDP reconstructions. A-C) Example explicit reconstructions, and D-F) Example synthetic fibers, as they lay within the subthalamic region (B/E) and internal capsule (C/F).
3.2. Synthetic HDP Model
Morphometric measurements from the explicit HDP reconstructions were sampled and used to constrain the ROOTS and AGCS algorithms to generate 10,000 synthetic HDP axon models. Figure 7 presents a subset of synthetic fibers (D, E, F) alongside example explicit fibers (A, B, C) to provide a qualitative comparison of conformation to constrained volumes, bifurcation toward and eventual perforation of the STN, and plausible arborization within the nucleus. The synthetic HDP axon models had CCFs that were within the internal capsule, exhibited an initial HDP collateral bifurcation near the dorso-lateral STN, and then arborized within the STN in patterns recognizable with the explicitly reconstructed axons (Figure 7). However, it should be noted that the explicit CCFs had more variability in their trajectory than the synthetic CCFs. Nonetheless, ROOTS was able to capture the range of approach angles to the dorso-lateral STN, the variable complexity of arbors, and the meandering behavior seen in situ. Additional representations of synthetic HDP terminal arbors are presented in Supplemental Figure 1.
100 synthetic HDP fibers were selected from the larger pool of 10,000 for statistical comparison with the 24 explicitly reconstructed HDP fibers. This analysis was performed for meander angle, segment length, total length, bifurcation angle, and number of bifurcations (Figure 8). Figure 8A–B presents the performance of the AGCS algorithm in reconstituting spatial jitter with comparison to histologically reconstructed explicit fibers. Results from random jitter, which represents an alternative method to simulate the fibers, are also provided for reference. AGCS generated CCFs with segment length and meander angle mean NRMSE of 1.2% and 7.4%, respectively. The KDEs presented in Figure 8A–B show that random jitter resulted in small modifications of segment lengths but dramatic distortion of fiber meander. Figure 8C–D presents the morphometric comparison of the synthetic HDP arbors in the subthalamic region to the explicitly reconstructed terminal arbors. Synthetic HDP arbors had total length, bifurcation angles, and number of bifurcations mean NRMSEs of 4.3%, 1.1%, and 5.4%, respectively. The multi-objective (straight averaged) mean NRMSE was 3.6% for terminal domain features.
Figure 8.
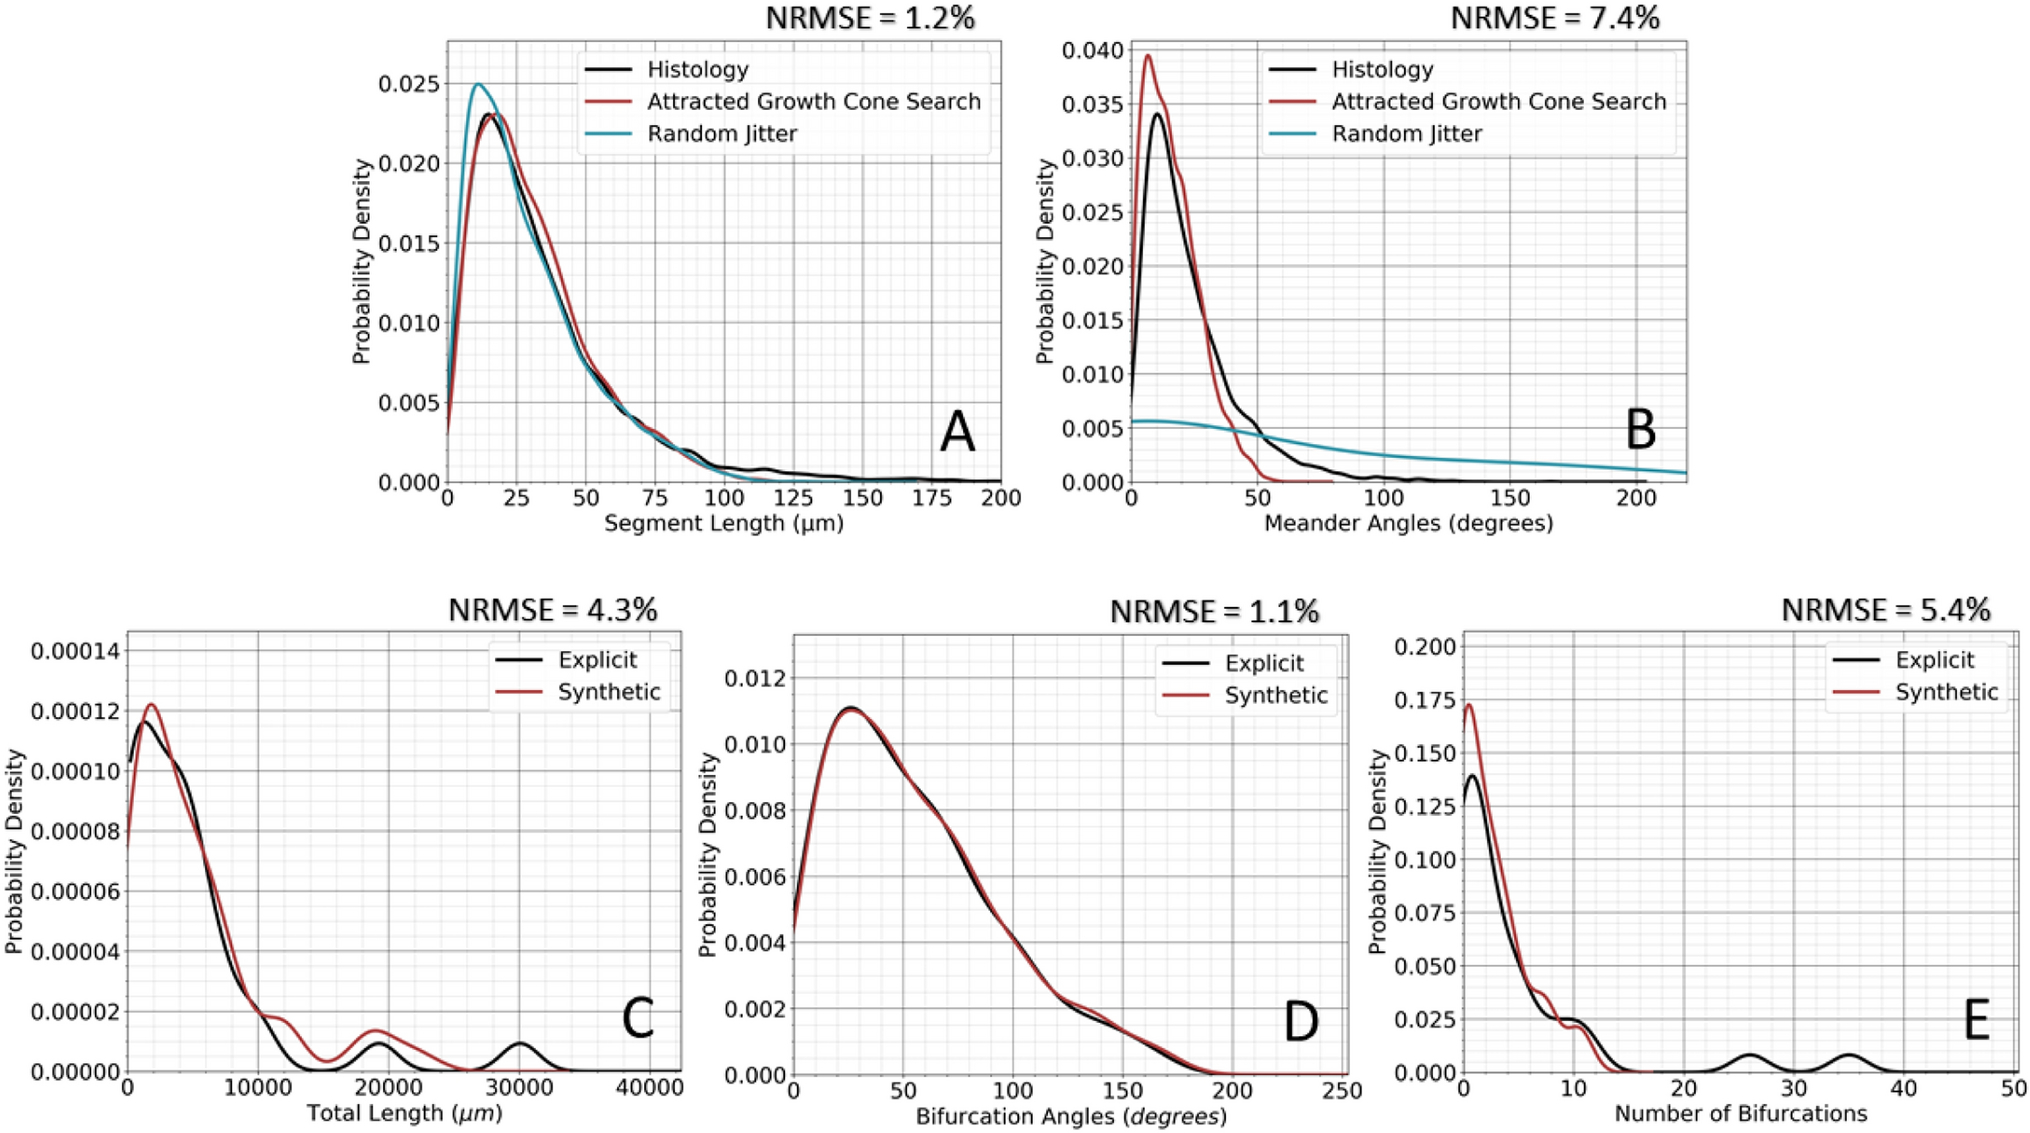
Morphometric comparison. A) Spatial and B) Angular morphometry. C-E) Morphometrics of the reconstructed hyperdirect collaterals. The ROOTS and AGCS algorithms were able to generate HDP fibers with ~3.6% mean NRMSE for (C) total arbor length, (D) number of bifurcations, and (E) bifurcation angles.
The cynomolgus macaque brain atlas and HDP fiber models, as well as supporting scripts, are available on ModelDB and Neuromorpho. Specifically, the explicit and synthetic HDP morphological descriptions are available as SWC files, and the surface meshed brain volume and STN model are available as STL files.
4. Discussion
The goal of this work was to develop a synthetic population model of motor HDP axons that was based on anatomical reconstructions of individual HDP axons. The results were derived from multiple brain imaging and computational methods, including BDA-stained reconstructed axons, MRI data, and registration with a structural brain atlas. These fundamental components provided the basis for innovative generative methods to create a large population of HDP fibers, which adhered to the anatomic variability of the motor HDP.
The point and purpose of our motor HDP population model is to provide a platform for detailed biophysical simulations that can begin to address HDP stimulus-response dynamics. These future studies of HDP function are likely to include analyses of action potential generation and signal transmission in the HDP [Anderson et al., 2018; Gunalan & McIntyre, 2020], as well as opportunities to represent spatially accurate locations for putative subthalamic synapses associated with individual HDP neurons [Haynes and Haber, 2013; Maling et al., 2018]. These simulation opportunities represent useful adjuncts to network analyses of the interaction between the cerebral cortex and the BG [Hahn & McIntyre, 2010; Kumaravelu et al., 2018], as well as neurophysiology studies on the mechanisms of DBS [Miocinovic et al., 2018; Johnson et al., 2020]. In addition, the HDP population model may find utility in translational investigations on the response of the HDP to non-invasive stimulation modalities, including transcranial direct current [Datta et al., 2009] or magnetic [Opitz et al., 2013] stimulation.
A key foundation for detailed biophysical modeling of neural activity are anatomical reconstructions of the neural elements being studied. However, detailed single neuron histological reconstructions are especially difficult and tedious to define in 3D, and are only able to provide results from a small fraction of the neuronal population. Generative methods employed in this manuscript (ROOTS and AGCS) were designed to address the need to simulate specific components of neuron morphometrics on a large scale, while being constrained by the available histological results [Bingham, et al., 2020]. Further, these methods alleviate the use of ‘copy-pasting’ a small number of explicit morphologies into large populations for neural simulations [Markram et al. 2015], which precludes the anatomic variability known to exist across multiple spatial scales, and likely important in simulating in situ brain behavior [Wearne et al. 2005; Marder & Tayler 2011].
The topological and gross anatomical similarities between humans and macaques, suggest that our HDP population model may also provide a dataset from which cross-species generative modeling efforts could be launched. Theoretically, generative methods such as ROOTS and AGCS can make direct use of the statistical distributions of branching parameters to generate synthetic axonal representations in any new brain volume model. Therefore, such efforts could be used to improve the anatomical realism of currently available human HDP fiber models [Petersen, et al. 2019].
4.1. Limitations
While the motor HDP population model achieved its goal of simulating the axonal arbor diversity of cortical projections to the subthalamic region, it also suffers from a range of limitations that should be noted. First, errors may have been introduced by the original explicit reconstruction methods. Use of alcohol and aldehydes for dehydration and fixation can result in substantial shrinkage [Fox, et al. 1985; Gusnard & Kirschner 1977]. Shrinkage, which occurs mainly across slices (z-axis), was partially mitigated by normalizing z-axis coordinates by cut thickness rather than mounted-section thickness, though effects of PFA-fixation could not be corrected. Further, because thin slices (70μm) were used to serially image the BDA-stained axons of the HDP, motion artifacts and misalignments may have been introduced to the final reconstructed morphologies [Ourselin, et al. 2001]. Another caveat is that because of the strong convergence of the filled CCFs in the internal capsule, Coudé et al. [2018] were not able to directly link the individual fibers with respective somas that were identified in layer 5 of M1. We should also note that the histological reconstruction effort was intensely focused on the STN region, so a small subset of HDP collaterals may have proceeded to other nearby nuclei, but were not accounted for in the reconstructions. While strategies to mitigate these artifacts or omissions were implemented and discussed in Coudé et al. [2018], the potential for error in the explicit HDP histological reconstructions remains.
Given the 24 histological reconstructions of HDP fibers, the next step in our modeling process was the manual alignment of each neuron into a 3D brain atlas volume. This step inevitably introduced some spatial errors in the specific placement of individual HDP fibers into the subthalamic region. However, a common coordinate system was needed to assemble the collection of axons into a larger pathway model. Therefore, great care was taken to ensure that the placement of each HDP axon was consistent with nuclei tracings provided by Coudé et al. [2018]. Nonetheless, there was substantial inherent variability in the individual HDP fibers (Figure 7). As such, even with the possibility of aberrant placement of ~100 microns or more from a truer location in the brain atlas volume, we propose that it would still be plausible for a similar HDP fiber to be found in that specific position in our model representation of the macaque subthalamic region.
Another important limitation of this study is that the morphometrics (local and global) we used are an incomplete set of the possible anatomical constraints that could be applied to the generation of synthetic morphologies. In part, this is a software challenge. But even if more complexity was added to ROOTS, there remain measures of axonal behavior not captured in ground truth data and impractical to record using any single reconstruction approach. Despite this limitation, the morphometrics used to constrain the synthetic HDP models presented here, along with the known volume of explicitly reconstructed arbor control points within the STN, strongly reduce the set of axonal trees that can be generated (Figures 7 & 8). As such, our synthetic arbor model represents the most sophisticated anatomical representation of the motor HDP that is currently available.
4.2. Conclusions
Populations of explicitly reconstructed axonal morphologies are highly valuable for model-based studies of complex neural systems, but they remain rare because of the experimental difficulty associated with their creation. However, even a small number of reconstructions (24 in this report) can yield morphometrics which can be used to describe the spatial and branching behaviors of a fiber system. This study demonstrated the application of novel methods for generating synthetic axonal morphologies that were constrained by probability density functions of critical anatomical features from histological reconstructions. As such, this study presented a detailed model-based representation of the primate motor HDP, which will be central to future in silico investigations on the role of the HDP in basal ganglia network analysis, and subthalamic DBS.
Supplementary Material
ACKNOWLDEGEMENTS
This work was supported by grants from the National Institutes of Health (R01 NS105690; R01 NS086100) and the Canadian Institutes of Health Research (CIHR MOP-153068). The authors thank Kelsey Bower, Sohail Noor, and Mevlut Yalaz for reviewing and suggesting edits to the study and manuscript ahead of submission. We also acknowledge Constantin Delmas for assisting in the organization and description of the histology data.
Funding: National Institutes of Health (R01 NS105690; R01 NS086100), Canadian Institutes of Health Research (CIHR MOP-153068)
Footnotes
Conflict of Interest/Competing Interests: CCM is a paid consultant for Boston Scientific Neuromodulation, receives royalties from Hologram Consultants, Neuros Medical, Qr8 Health, and is a shareholder in the following companies: Hologram Consultants, Surgical Information Sciences, CereGate, Autonomic Technologies, Cardionomic, Enspire DBS.
DECLARATIONS:
Availability of data and material: Unique morphologies and brain atlas will be available for download from public repositories following publication.
Code availability: Code is available upon request.
Ethics approval: Not applicable.
Consent to participate: Not applicable.
Consent for publication: Not applicable.
References
- Abdellah M, Hernando J, Eilemann S, Lapere S, Antille N, Markram H, & Schürmann F (2018). NeuroMorphoVis: a collaborative framework for analysis and visualization of neuronal morphology skeletons reconstructed from microscopy stacks. Bioinfo. [DOI] [PMC free article] [PubMed] [Google Scholar]
- Alexander GE, Crutcher MD, & DeLong MR (1991). Basal ganglia-thalamocortical circuits: parallel substrates for motor, oculomotor,“prefrontal” and “limbic” functions. Progress in brain research. 85:119–146. [PubMed] [Google Scholar]
- Anderson R, Farokhniaee A, Gunalan K, Howell B, & McIntyre C (2018). Action potential initiation, propagation, and cortical invasion in the hyperdirect pathway during subthalamic deep brain stimulation. Brain Stimulation, 11(5), 1140–1150. [DOI] [PMC free article] [PubMed] [Google Scholar]
- Bingham CS, Bouteiller JM, Song D, & Berger TW (2018). Graph-Based Models of Cortical Axons for the Prediction of Neuronal Response to Extracellular Electrical Stimulation. 2018 40th Annual International Conference of the IEEE Engineering in Medicine and Biology Society (EMBC). [DOI] [PMC free article] [PubMed] [Google Scholar]
- Bingham C, Mergenthal A, Bouteiller J-M, Song D, Lazzi G, & Berger T (2020). ROOTS: An algorithm to generate biologically realistic cortical axons and an application to electroceutical modeling. Frontiers in Computational Neuroscience. [DOI] [PMC free article] [PubMed] [Google Scholar]
- Bower KL, & McIntyre CC (2020). Deep brain stimulation of terminating axons. Brain Stimulation, 13(6), 1863–1870.. [DOI] [PMC free article] [PubMed] [Google Scholar]
- Chakravarty MM, S., F., Collins DL, Paxinos G, Huang XF, Petrides M, & Toga AW (2008). Digital atlas of the monkey brain in stereotactic co-ordinates. In The Rhesus Monkey Brain In Stereotactic Coordinates. San Diego, CA: Academic. [Google Scholar]
- Coudé D, Parent A, & Parent M (2018). Single-axon tracing of the corticosubthalamic hyperdirect pathway in primates. Brain Structure and Function, 223(9), 3959–3973. [DOI] [PubMed] [Google Scholar]
- Cox RW (1996). AFNI: software for analysis and visualization of functional magnetic resonance neuroimages. Computers and Biomedical research, 29(3), 162–173. [DOI] [PubMed] [Google Scholar]
- Datta A, Bansal V, Diaz J, Patel J, Reato D, & Bikson M (2009). Gyri-precise head model of transcranial direct current stimulation: improved spatial focality using a ring electrode versus conventional rectangular pad. Brain stimulation, 2(4), 201–207. [DOI] [PMC free article] [PubMed] [Google Scholar]
- Feng L, Zhao T, & Kim J (2015). neuTube 1.0: A New Design for Efficient Neuron Reconstruction Software Based on The SWC Format. eNeuro. [DOI] [PMC free article] [PubMed] [Google Scholar]
- Fischl B (2012). FreeSurfer. Neuroimage, 62(2), 774–781. [DOI] [PMC free article] [PubMed] [Google Scholar]
- Fox CH, Johnson FB, Whiting J, & Roller PP (1985). Formaldehyde fixation. Journal of Histochemistry & Cytochemistry, 33(8), 845–853. [DOI] [PubMed] [Google Scholar]
- Frey S, Pandya DN, Chakravarty MM, Bailey L, Petrides M, & Collins DL (2011). An MRI based average macaque monkey stereotaxic atlas and space (MNI monkey space). NeuroImage, 55(4), 1435–1442. [DOI] [PubMed] [Google Scholar]
- Gunalan K, McIntyre CC (2020). Biophysical reconstruction of the signal conduction underlying short-latency cortical evoked potentials generated by subthalamic deep brain stimulation. Clin Neurophysiol. 131(2):542–547 [DOI] [PMC free article] [PubMed] [Google Scholar]
- Gusnard D, & Kirschner RH (1977). Cell and organelle shrinkage during preparation for scanning electron microscopy: effects of fixation, dehydration and critical point drying. Journal of microscopy, 110(1), 51–57. [DOI] [PubMed] [Google Scholar]
- Hahn PJ, McIntyre CC (2010). Modeling shifts in the rate and pattern of subthalamopallidal network activity during deep brain stimulation. J Comput Neurosci. 28(3):425–41. [DOI] [PMC free article] [PubMed] [Google Scholar]
- Haynes WI, & Haber SN (2013). The organization of prefrontal-subthalamic inputs in primates provides an anatomical substrate for both functional specificity and integration: implications for Basal Ganglia models and deep brain stimulation. Journal of Neuroscience, 33(11), 4804–4814. [DOI] [PMC free article] [PubMed] [Google Scholar]
- Johnson LA, Wang J, Nebeck SD, Zhang J, Johnson MD, & Vitek JL (2020). Direct activation of primary motor cortex during subthalamic but not pallidal deep brain stimulation. Journal of Neuroscience, 40(10), 2166–2177. [DOI] [PMC free article] [PubMed] [Google Scholar]
- Kazhdan M, & Hoppe H (2013). Screened poisson surface reconstruction. ACM Transactions on Graphics (ToG), 32(3), 29. [Google Scholar]
- Kita T, & Kita H (2012). The subthalamic nucleus is one of multiple innervation sites for long-range corticofugal axons: a single-axon tracing study in the rat. Journal of Neuroscience, 32(17), 5990–5999. [DOI] [PMC free article] [PubMed] [Google Scholar]
- Kumaravelu K, Oza CS, Behrend CE, & Grill WM (2018). Model-based deconstruction of cortical evoked potentials generated by subthalamic nucleus deep brain stimulation. Journal of neurophysiology, 120(2), 662–680. [DOI] [PMC free article] [PubMed] [Google Scholar]
- Maling N, Lempka SF, Blumenfeld Z, Bronte-Stewart H, & McIntyre CC (2018). Biophysical basis of subthalamic local field potentials recorded from deep brain stimulation electrodes. Journal of neurophysiology, 120(4), 1932–1944. [DOI] [PMC free article] [PubMed] [Google Scholar]
- Marder E, & Taylor AL (2011). Multiple models to capture the variability in biological neurons and networks. Nature neuroscience, 14(2), 133–138. [DOI] [PMC free article] [PubMed] [Google Scholar]
- Markram H, Muller E, Ramaswamy S, Reimann MW, Abdellah M, Sanchez CA, & Kahou GA (2015). Reconstruction and simulation of neocortical microcircuitry. Cell, 132(2), 456–492. [DOI] [PubMed] [Google Scholar]
- Mathai A, Ma Y, Paré JF, Villalba RM, Wichmann T, & Smith Y (2015). Reduced cortical innervation of the subthalamic nucleus in MPTP-treated parkinsonian monkeys. Brain, 138(4), 946–962. [DOI] [PMC free article] [PubMed] [Google Scholar]
- Miocinovic S, de Hemptinne C, Chen W, Isbaine F, Willie JT, Ostrem JL, & Starr PA (2018). Cortical potentials evoked by subthalamic stimulation demonstrate a short latency hyperdirect pathway in humans. Journal of Neuroscience, 38(43), 9129–9141. [DOI] [PMC free article] [PubMed] [Google Scholar]
- Morales-Napoles O, Cooke RM, & Kurowicka D (2010). About the number of vines and regular vines on n nodes. Delft: Delft University of Technology. [Google Scholar]
- Nambu A, Takada M, Inase M, & Tokuno H (1996). Dual somatotopical representations in the primate subthalamic nucleus: evidence for ordered but reversed body-map transformations from the primary motor cortex and the supplementary motor area. Journal of Neuroscience, 16(8), 2671–2683. [DOI] [PMC free article] [PubMed] [Google Scholar]
- Nambu A, Tokuno H, & Takada M (2002). Functional significance of the cortico–subthalamo–pallidal ‘hyperdirect’ pathway. Neuroscience Research, 43(2), 111–117. [DOI] [PubMed] [Google Scholar]
- Nelson AB, & Kreitzer AC (2014). Reassessing models of basal ganglia function and dysfunction. Annual review of neuroscience, 37, 117–135. [DOI] [PMC free article] [PubMed] [Google Scholar]
- Opitz A, Legon W, Rowlands A, Bickel K, Paulus W, Tyler WJ (2013). Physiological observations validate finite element models for estimating subject-specific electric field distributions induced by transcranial magnetic stimulation of the human motor cortex. Neuroimage, 81, 253–264. [DOI] [PubMed] [Google Scholar]
- Ourselin S, Roche A, Subsol G, Pennec X, & Ayache N (2001). Reconstructing a 3D structure from serial histological sections. Image and vision computing, 19(1–2), 25–31. [Google Scholar]
- Parent A, & Hazrati LN (1995). Functional anatomy of the basal ganglia. I. The cortico-basal ganglia-thalamo-cortical loop. Brain research reviews, 20(1), 91–127. [DOI] [PubMed] [Google Scholar]
- Petersen MV, Mlakar J, Haber SN, Parent M, Smith Y, Strick PL, & McIntyre CC (2019). Holographic reconstruction of axonal pathways in the human brain. Neuron, 104(6), 1056–1064. [DOI] [PMC free article] [PubMed] [Google Scholar]
- Plantinga BR, Temel Y, Duchin Y, Uludağ K, Patriat R, Roebroeck A, … & Harel N (2018). Individualized parcellation of the subthalamic nucleus in patients with Parkinson’s disease with 7T MRI. Neuroimage, 168, 403–411. [DOI] [PMC free article] [PubMed] [Google Scholar]
- Polyakova Z, Chiken S, Hatanaka N, Nambu A (2020). Cortical Control of Subthalamic Neuronal Activity through the Hyperdirect and Indirect Pathways in Monkeys. J Neurosci. 40(39):7451–7463. [DOI] [PMC free article] [PubMed] [Google Scholar]
- Silverman BW (2018). Density estimation for statistics and data analysis. Routledge. [Google Scholar]
- Wearne SL, Rodriguez A, Ehlenberger DB, Rocher AB, Henderson SC, & Hof PR (2005). New techniques for imaging, digitization and analysis of three-dimensional neural morphology on multiple scales. Neuroscience, 136(3), 661–680. [DOI] [PubMed] [Google Scholar]
- Yu C, Cassar IR, Sambangi J, & Grill WM (2020). Frequency-specific optogenetic deep brain stimulation of subthalamic nucleus improves Parkinsonian motor behaviors. Journal of Neuroscience, 40(22), 4323–4334. [DOI] [PMC free article] [PubMed] [Google Scholar]
Associated Data
This section collects any data citations, data availability statements, or supplementary materials included in this article.


