

Keywords: autosomal dominant tubulointerstitial kidney disease, biomarker, endoplasmic reticulum stress, plasmon-enhanced fluorescence-linked immunosorbent assay
Abstract
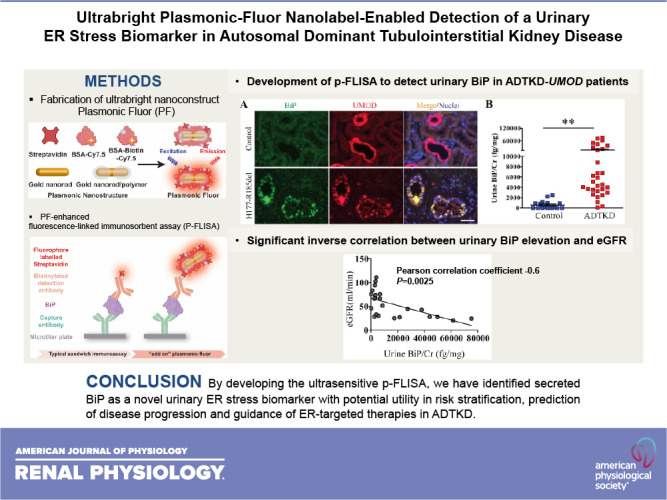
Autosomal dominant tubulointerstitial kidney disease (ADTKD)-uromodulin (UMOD) is the most common nonpolycystic genetic kidney disease, but it remains unrecognized due to its clinical heterogeneity and lack of screening test. Moreover, the fact that the clinical feature is a poor predictor of disease outcome further highlights the need for the development of mechanistic biomarkers in ADTKD. However, low abundant urinary proteins secreted by thick ascending limb cells, where UMOD is synthesized, have posed a challenge for the detection of biomarkers in ADTKD-UMOD. In the CRISPR/Cas9-generated murine model and patients with ADTKD-UMOD, we found that immunoglobulin heavy chain-binding protein (BiP), an endoplasmic reticulum chaperone, was exclusively upregulated by mutant UMOD in the thick ascending limb and easily detected by Western blot analysis in the urine at an early stage of disease. However, even the most sensitive ELISA failed to detect urinary BiP in affected individuals. We therefore developed an ultrasensitive, plasmon-enhanced fluorescence-linked immunosorbent assay (p-FLISA) to quantify urinary BiP concentration by harnessing the newly invented ultrabright fluorescent nanoconstruct, termed “plasmonic Fluor.” p-FLISA demonstrated that urinary BiP excretion was significantly elevated in patients with ADTKD-UMOD compared with unaffected controls, which may have potential utility in risk stratification, disease activity monitoring, disease progression prediction, and guidance of endoplasmic reticulum-targeted therapies in ADTKD.
NEW & NOTEWORTHY Autosomal dominant tubulointerstitial kidney disease (ADTKD)-uromodulin (UMOD) is an underdiagnosed cause of chronic kidney disease (CKD). Lack of ultrasensitive bioanalytical tools has hindered the discovery of low abundant urinary biomarkers in ADTKD. Here, we developed an ultrasensitive plasmon-enhanced fluorescence-linked immunosorbent assay (p-FLISA). p-FLISA demonstrated that secreted immunoglobulin heavy chain-binding protein is an early urinary endoplasmic reticulum stress biomarker in ADTKD-UMOD, which will be valuable in monitoring disease progression and the treatment response in ADTKD.
INTRODUCTION
Autosomal dominant tubulointerstitial kidney disease (ADTKD) due to uromodulin (UMOD) mutations (ADTKD-UMOD), the most frequent nonpolycystic genetic kidney disease (1), is a monogenic form of kidney tubulointerstitial fibrosis characterized by variable progression to end-stage kidney disease (2, 3). UMOD (Tamm-Horsfall protein) is primarily expressed in the thick ascending limb (TAL). More than 120 UMOD mutations have been identified, and most of them are missense mutations (3). Genetic mutations can disrupt protein folding and trafficking, and accumulation of misfolded proteins in the endoplasmic reticulum (ER) lumen evokes ER stress and the unfolded protein response (UPR) (4). The UPR aims to restore ER homeostasis through transcriptional remodeling of ER proteostasis (4, 5). Mutant UMOD causes protein aggregation and ER dysfunction, eventually leading to TAL damage, inflammation, and fibrosis (6–10).
Immunoglobulin heavy chain-binding protein (BiP), a highly conserved member of the 70-kDa heat shock protein family, is a well-characterized ER resident chaperone that assists protein folding in the ER. It is inducible by ER stress due to multiple copies of the ER stress response element (CCAAT-N9-CCACG) in its promoter region (11, 12) and activates the UPR by binding to misfolded/unfolded proteins and dissociating from the three ER sensors inositol-requiring enzyme 1, protein kinase R-like ER kinase, and activating transcription factor 6 (13). Increased amounts of BiP are secreted by thapsigargin-treated human rabdomiosarcoma and neuroblastoma cells (14, 15), by bortezomib-resistant solid tumor cells (16), and into the inflamed synovium and sera of patients with rheumatoid arthritis (17). Thus, BiP is an excellent ER stress biomarker candidate. Previously, we identified the first urinary ER stress biomarker, cysteine-rich with EGF-like domains 2 (CRELD2), in patients with ADTKD-UMOD (18). A drawback of CRELD2 measurement was that to reach the detection threshold of the ELISA, we had to chemically precipitate ∼1−1.5 mL of urine [normalized to 450 µg of urine creatinine (Cr)] to enrich the protein concentration (18), which would be unfeasible for a clinical diagnostic laboratory running this assay. Thus, there is a critical need to develop an ultrasensitive assay in the ADTKD biomarker development pipeline.
Plasmonic Fluor (PF), a newly developed ultrabright fluorescent nanoconstruct, enables a highly sensitive and accurate biosensor that surpasses the sensitivity of available bioassays and vastly outperforms existing nanoengineered fluorescent structures (19). As shown in Fig. 1, the components of PF include a BSA layer bearing around 210 fluorophores (e.g., near-infrared Cy7.5 or 800CW) as light emitters, a polymer-coated gold nanorod as a fluorescence enhancer, and a biotin-streptavidin affinity pair as biolinkers (19). Signal enhancement in the electromagnetic field at the surface of the plasmonic nanostructures results in an enormous augmentation of fluorescence emission from surrounding fluorophores. As a key design element, BSA can prevent aggregation of the nanoconstructs and block nonspecific binding of the PF to arbitrary surfaces and biomolecules, enabling the achievement of high signal-to-background ratios. In this study, we investigated the applicability of this cutting-edge fluorescent nanolabeling for determining the utility of secreted BiP as a urinary ER stress biomarker in ADTKD-UMOD.
Figure 1.

Scheme showing the structure of a plasmonic Fluor (PF), which comprises a BSA layer bearing around 210 fluorophores (Cy7.5) as light emitters, a polymer-coated gold nanorod as a fluorescence enhancer, and a biotin-streptavidin affinity pair as biolinkers. BSA is used as a scaffold to assemble all components into the functional nanoconstruct and to block nonspecific binding.
MATERIALS AND METHODS
Antibodies and Reagents
Commercially available antibodies were obtained as follows: rabbit anti-human BiP antibody (LS-B2038) from LSBio (Seattle, WA), rabbit anti-mouse (or human) BiP antibody (no. 11587-1-AP) from Proteintech (Chicago, IL), rat anti-mouse UMOD antibody (MAB5175) from R&D (Minneapolis, MN), and mouse anti-human UMOD antibody (no. 119–13298) from RayBiotech (Norcross, GA). Horseradish peroxidase-conjugated anti-mouse β-actin antibody (A3854) was from Sigma (St. Louis, MO). GAPDH antibody (no. 5174) was from Cell Signaling Technology (Danvers, MA). Alexa 488- and Alexa 594-conjugated secondary antibodies were purchased from Molecular Probes (Carlsbad, CA). Horseradish peroxidase-conjugated secondary antibodies were from Cell Signaling Technology. Hoechst 33258 was from Thermo Fisher Scientific.
Animals
UmodC147W/+ mice have been previously described (20). C57BL/6J mice were obtained from The Jackson Laboratory. All animal experiments conformed with the National Institutes of Health Guide for the Care and Use of Laboratory Animals and were approved by the Washington University Animal Studies Committee.
Purification of Mouse TAL Epithelial Cells
Mouse UMOD-producing epithelial cells were purified by preparing single cell digests from wild-type (WT) and UmodC147W/+ mouse kidneys, as previously described (20). Briefly, kidneys were decapsulated, minced, and then incubated in a shaking water bath (180 rpm) at 37°C for 50 min with collagenase type 1 (2 mg/mL, Sigma-Aldrich) and DNase (100 U/mL, Sigma-Aldrich) in serum-free DMEM-F-12 (Sigma-Aldrich) with vortexing every 15 min. After incubation, enzymatic digestion was halted by the addition of 1 volume of DMEM-F-12 with 10% serum. The tissue digest was mixed thoroughly and filtered (40 μm), and the single cell suspension was incubated with rabbit anti-mouse UMOD antibody (J65429, Alfa Aesar) at 4°C for 1 h. UMOD-producing cells were then selected by an incubation with sheep anti-rabbit Dynabead magnetic beads (no. 11203 D, Thermo Fisher Scientific) in a final volume of 1 mL at 4°C for 1 h. Beads and UMOD-producing cells were then trapped against a magnet, and residual UMOD-negative cells were also collected.
Immunofluorescence Staining
For dual staining of BiP with UMOD in mouse kidneys, 4% paraformaldehyde-fixed, paraffin-embedded sections were used. After dewaxing, kidney sections from Umod+/+ and UmodC147W/+ mice at 16 wk were subjected to antigen retrieval by immersion in 10 mM citric acid buffer (pH 6.0) for 5 min at 95°C. Nonspecific binding was blocked by incubating kidney sections with 1% BSA for 30 min at room temperature. Slides were stained with rabbit anti-mouse BiP antibody (Proteintech) together with rat anti-mouse UMOD antibody (R&D) overnight at 4°C, followed by Alexa 488-conjugated anti-rabbit secondary antibody and Alexa 594-conjugated anti-rat secondary antibody, respectively.
Formalin-fixed, paraffin-embedded sections of human kidneys underwent the same process of deparaffinization and antigen retrieval and blocking. Nonspecific avidin binding was blocked by an avidin/biotin blocking kit (Vector Laboratories). Slides were incubated with rabbit anti-human BiP antibody (LSBio) in combination with mouse IgG2b antibody against human UMOD (RayBiotech). Biotinylated anti-mouse antibody was used to amplify fluorescence signals for UMOD, followed by the corresponding Alexa 488-conjugated anti-rabbit secondary antibody or Alexa 594-labeled streptavidin to detect BiP and UMOD, respectively. Nuclei were counterstained with Hoechst 33342. Slides were analyzed under a fluorescence microscope (Nikon).
Light Microscopy
For light microscopy, mouse kidneys were fixed in 4% paraformaldehyde and human kidneys were fixed in 10% formalin, dehydrated through graded ethanols, embedded in paraffin, sectioned at 4 µm, and stained with Masson’s trichrome by standard methods.
Western Blot Analysis
Isolated TAL-positive and TAL-negative epithelium were lysed by RIPA buffer (Sigma) containing protease inhibitor cocktail (Roche, Indianapolis, IN). Umod+/+and UmodC147W/+ kidneys were extracted using the same lysis buffer with the protease inhibitors and homogenized by sonication. Protein concentrations of cell and kidney lysates were determined by a Bio-Rad protein assay (Hercules, CA) using BSA as the standard. Urine volume from individual human patients was normalized to urine Cr excretion. Denatured proteins were separated by SDS-PAGE and then transferred to PVDF membranes. Blots were blocked with 5% nonfat milk for 1 h at room temperature and then incubated overnight with primary antibodies at 4°C. Membranes were washed with Tris-buffered saline-Tween buffer and incubated with the appropriate horseradish peroxidase-conjugated secondary antibodies. Proteins were then visualized in an X-ray developer using ECL plus detection reagents (GE, Pittsburgh, PA). To ensure equal protein loading, the same blot was stripped with stripping buffer (25 mM glycine + 1% SDS, pH 2.0) and then incubated with horseradish peroxidase-conjugated anti-mouse β-actin antibody or anti-mouse GAPDH antibody. Relative intensities of protein bands were quantified using ImageJ (National Institutes of Health) analysis software.
mRNA Quantification by Real-Time PCR
Total RNA from whole kidneys was extracted using the RNeasy kit (Qiagen, Valencia, CA) with subsequent DNase I treatment. Kidney RNA (1 µg) was then reverse transcribed using an RT-PCR kit (Superscript III, Invitrogen). Gene expression was evaluated by quantitative real-time PCR. One microliter of cDNA was added to SYBR Green PCR Master Mix (Applied Biosystems) and subjected to PCR amplification (1 cycle at 95°C for 20 s and 40 cycles at 95°C for 1 s and 60°C for 20 s) in an Applied Biosystems QuantStudio 6 Flex Real-Time PCR System (Life Technologies, Grand Island, NY). Quantitative PCR was conducted in triplicate for each sample. The sequences of primers were as follows: mouse BiP, forward 5′- TTCAGCCAATTATCAGCAAACTCT-3′ and reverse 5′- TTTTCTGATGTATCCTCTTCACCAGT-3′; and mouse GAPDH, forward 5′- TGTAGACCATGTAGTTGAGGTCA-3′ and reverse 5′- AGGTCGGTGTGAACGGATTTG-3′.
Cr Measurement
Serum Cr was measured using a QuantiChromCr assay kit (DICT-500, BioAssay Systems, Hayward, CA).
Urinalysis
Mouse urine was collected by manual restraint or using a metabolic cage. Mouse urine was centrifuged at 1,800 g for 10 min, and human urine was spun at 1,600 g for 10 min to remove debris before being frozen at −70°C. Urinary Cr concentration was quantified by a QuantiChromcreatinine assay kit (DICT-500, BioAssay Systems).
Measuring Fluorescence Intensity Enhancement of PF Compared With a Conventional Fluorophore
First, BSA-biotin was immobilized on the bottom of a 96-well plate by incubating the well with 25 ng/mL BSA-biotin in 1× PBS at room temperature for 10 min. After being washed three times with 0.05% Tween 20 in 1× PBS (PBST) and blocked with 3% BSA in PBS, wells were incubated with either 1 μg/mL of streptavidin-800CW (no. 926–32230, Li-Cor) or streptavidin-bearing PF-Cy7.5 (extinction 2) in duplicate for 10 min under orbital shaking. The plate was then washed three times using PBST to remove free streptavidin-CW800 or PF. Finally, the fluorescence signal in each well was recorded using the Li-Cor CLx fluorescence imager with the following scanning parameters: laser power ∼L2, resolution ∼169 μm, channel 800, height 1.5 mm, and wavelength around 780 nm.
Plasmon-Enhanced Fluorescence-Linked Immunosorbent Assay of Human Urine BiP
BiP concentrations in human urine samples were determined by plasmon-enhanced fluorescence-linked immunosorbent assay (p-FLISA). PF-Cy7.5 was synthesized as previously described (19). A human BiP ELISA kit (LSBio) was used in this study. BiP p-FLISA was implemented according to the protocol provided by the kit vendor except that horseradish peroxidase-labeled streptavidin (Detection Reagent B in the kit) was replaced by PF-Cy7.5-bearing streptavidin. Briefly, 100 µL of serially diluted human recombinant BiP standards and patient urine samples were added into different wells of the microtiter plate precoated with BiP-capturing antibody, and the plate was incubated at 37°C for 4.5 h. After the samples had been aspirated, each well was incubated with biotinylated anti-BiP detection antibody (Detection Reagent A in the kit) at 37°C for 1 h, followed by three washes with the wash buffer provided in the kit. Subsequently, 50 µL PF-Cy7.5 was added (extinction ∼2) and incubated for 5 min under orbital shaking, and the plate was washed five times with wash buffer. Microtiter plates were imaged using the Li-Cor CLx fluorescence imager with the following scanning parameters: laser power ∼L2, resolution ∼21 µm, channel 800, and height 1.5 mm. The fluorescence intensity from individual patient’s urine samples was plotted against known concentrations of human recombinant BiP, and urinary BiP concentration in each patient was determined.
Study Approval
All human urine samples from patients with ADTKD and their genetically unaffected controls, as well as their paraffin-embedded slides, were obtained from the Wake Forest Cohort under the protocol approved by the Institutional Review Board of Wake Forest School of Medicine.
Statistics
Statistical analyses were performed using GraphPad Prism software. Data are expressed as means ± SD or plots. A two-tailed Student’s t test was used to compare two groups. One-way ANOVA with a post hoc Tukey test was used to compare multiple groups. Pearson linear regression analysis was used to test the correlation between urinary BiP concentrations indexed to urinary Cr and estimated glomerular filtration rate (eGFR) as calculated by the Modification of Diet in Renal Disease formula. P < 0.05 was considered significant.
RESULTS
Secreted BiP in the Urine Is an Early Diagnostic Biomarker of ER Stress in the TAL in an ADTKD-UMOD Mouse Model
We first investigated whether BiP was induced and secreted by ER-stressed TAL cells in early stages of disease using a CRISPR/Cas9-generated mouse ADTKD model induced by a Umod mutation, p.Cys147Trp, the mouse equivalent of the human C148W mutation (20). The C147W mutation causes UMOD protein aggregation, which induces ER stress-mediated cell death. At 24 wk, UmodC147W/+ mice develop full-blown CKD as manifested by elevation of serum Cr as well as widespread interstitial fibrosis in both the cortex and medulla (20). In the present study, we sought to determine whether BiP was induced and secreted by ER-stressed TAL cells at the early stage of CKD. At 16 wk, there was no difference in serum Cr between UmodC147W/+ and control littermates (Fig. 2A), although trichrome staining showed that mutants exhibited mild interstitial fibrosis (Fig. 2B). Real-time PCR demonstrated that BiP transcript levels were significantly increased in the mutant kidneys at 12 and 16 wk compared with WT kidneys (Fig. 2C), which is consistent with UMOD accumulation in the mutant kidneys by 12 wk (Fig. 2D). Western blot analysis of BiP also revealed slight upregulation at 12 wk (Fig. 2D) and a further increase at 16 wk (Fig. 2E) in UmodC147W/+ versus WT kidneys.
Figure 2.

Immunoglobulin heavy chain-binding protein (BiP) is a urinary biomarker for detecting thick ascending limb endoplasmic reticulum stress at the early stage of chronic kidney disease in uromodulin (Umod)C147W/+ mice. A: serum creatinine levels from Umod+/+(n = 9) and UmodC147W/+ (n = 14) mice at 16 wk of age. B: Masson’s trichrome staining of paraffin-embedded kidney sections from Umod+/+and UmodC147W/+ mice at 16 wk of age. Scale bar = 100 µm. C: quantitative RT-PCR analysis of relative transcript levels of BiP in whole kidneys from Umod+/+(n = 9) and UmodC147W/+ mice at 12 and 16 wk of age (n = 3 and n = 6, respectively). *P< 0.05. D: whole kidney lysates from 12-wk-old Umod+/+(n = 3) and UmodC147W/+ (n = 3) mice were analyzed by Western blot for levels of UMOD, BiP, and GAPDH, with densitometry analysis of BiP. *P< 0.05. E: Western blots of whole kidney lysates from Umod+/+(n = 4) and UmodC147W/+ (n = 5) mice at 16 wk to detect BiP and GAPDH, with quantification of BiP. **P< 0.01. F: Western blot analysis of isolated UMOD-positive (n = 3 per genotype) and UMOD-negative (n = 3 per genotype) primary murine epithelial cells at 16 wk for UMOD, BiP, and β-actin. Densitometry analysis of BiP was performed for UMOD-positive and UMOD-negative cells, respectively, from wild-type and UmodC147W/+ mice. *P< 0.05. G: dual immunofluorescence staining of BiP (green) and UMOD (red) on 4% paraformaldehyde-fixed, paraffin-embedded kidney sections from Umod+/+and UmodC147W/+ mice at 16 wk of age. Arrows indicate increased BiP expression in thick ascending limb (UMOD-positive) tubules in the mutant mouse. Scale bar = 40 µm. H: representative Western blots showed urinary BiP excretion from Umod+/+and UmodC147W/+ mice at 12 wk (n = 3 and n = 3, respectively) and 16 wk (n = 3 and n = 5, respectively) of age. Urinary BiP excretion was normalized to urine creatinine excretion such that the urine volume applied to the gel reflected the amount of urine containing 4 µg of creatinine. NS, not significant.
Next, we examined whether BiP was exclusively induced by mutant UMOD in TAL cells, the primary cell type that synthesizes and secretes UMOD in the urine. UMOD-producing TAL cells were isolated from control and mutant kidneys at 16 wk of age. Mutant UMOD-positive cells exhibited intracellular UMOD accumulation and a marked increase in BiP compared with WT UMOD-positive cells. In contrast, UMOD-negative cells did not show differences in BiP expression between mutant and WT kidneys (Fig. 2F). In addition, immunofluorescence staining showed that BiP expression was enhanced and colocalized exclusively with intracellular UMOD aggregates in mutant TALs at the early stage of the disease (Fig. 2G, arrows). Finally, we determined whether BiP secreted from ER-stressed TALs can be captured in the urine. Using urinary Cr concentrations to normalize for sample loading, Western blot analysis demonstrated that BiP was easily detected in as little as 10−20 μL of urine specimens from UmodC147W/+ mice as early as 12 wk but not from WT control littermates at any age (Fig. 2H). Taken together, these data indicate that urinary BiP excretion signifies ER stress in the TAL during the development of ADTKD and can be detected at an early stage.
BiP Expression Is Increased in TAL Cells in Patients With ADTKD-UMOD
After we identified secreted BiP as a novel urinary ER stress biomarker in the ADTKD-UMOD mouse model, we further investigated the utility of BiP in patients with ADTKD. As evidenced by dual immunofluorescence staining of BiP and UMOD in the kidney biopsy of a patient harboring UMOD H177-R185 deletion, one of the most prevalent mutations in patients with ADTKD-UMOD in the United States, mutant UMOD displayed a perinuclear punctate pattern within TAL cells compared with WT UMOD (Fig. 3A). Moreover, BiP exhibited increased abundance and colocalized with mutant UMOD aggregates in the TAL (Fig. 3A). We further assessed whether urinary BiP concentrations were increased in patients with ADTKD-UMOD. However, when we attempted to quantify urinary BiP levels using ELISA, the BiP concentration in unconcentrated urine samples from patients with ADTKD was under the detection threshold of the most sensitive ELISA kits (15.6 pg/mL).
Figure 3.

Detection of immunoglobulin heavy chain-binding protein (BiP) in the urine from patients with autosomal dominant tubulointerstitial kidney disease (ADTKD)-uromodulin (UMOD) by plasmon-enhanced fluorescence-linked immunosorbent assay (p-FLISA). A: representative immunofluorescence images of human kidney biopsies obtained from a patient with p.H177-R185del and from a normal kidney stained for BiP (green) and UMOD (red) with a nuclear counterstain (Hoechst 33342, blue). Scale bar = 40 µm. B: schematic illustration depicting the concept of p-FLISA of urine BiP implemented in a standard 96-well plate. C: fluorescence intensity of streptavidin-800CW or streptavidin-plasmonic Fluor (PF)-Cy7.5 followed by the specific binding to BSA-biotin that was immobilized on the bottom of a 96-well plate, showing an average of a 1,440 (±36)-fold increase in fluorescence intensity. **P< 0.01. D: dot-plot representation of urine BiP/creatinine (Cr) values measured by p-FLISA in 30 patients with ADTKD-UMOD harboring various UMOD mutations and 17 genetically unaffected controls. Data are presented as means ± SE. **P< 0.01 by a t test.
Development of p-FLISA to Detect Urinary BiP in Patients With ADTKD-UMOD
To increase the detection sensitivity, we tested the efficacy of PF as an ultrabright nanolabel for realizing an ultrasensitive p-FLISA. As shown in Fig. 3B, p-FLISA of urine BiP comprised a standard sandwich immunoassay format of immobilizing a BiP-capturing antibody on the bottom of a 96-well plate, exposing to urine BiP, and binding of biotinylated anti-BiP detection antibody to the captured BiP, followed by exposure to streptavidin-PF (PF-Cy7.5 in this study), which binds to biotin on the anti-BiP detection antibody. Hence, in contrast to conventional immunoassay FLISA or ELISA, p-FLISA uses ultrabright PF instead of the conventional fluorophore, or the enzyme, horseradish peroxidase, as the signal enhancer. A nearly 1,440-fold enhancement in fluorescent intensity was achieved by applying PF-Cy7.5 compared with the conventional fluorophore (Fig. 3C). We used PF-Cy7.5 as an “add-on” biolabel on an ELISA kit of BiP (LSBio) by replacing horseradish peroxidase-labeled streptavidin with PF-Cy7.5-bearing streptavidin in the final step. p-FLISA of urine BiP was performed in 30 patients with ADTKD-UMOD carrying 12 different UMOD mutations and 17 genetically unaffected controls. Demographic and clinical characteristics of enrolled patients and controls, as well as their urinary BiP concentration normalized to urine Cr excretion (urine BiP/Cr) at the indicated eGFR, are shown in Table 1. The assay revealed that urinary excretion of BiP was significantly higher in patients with ADTKD-UMOD compared with controls (Fig. 3D and Table 1). These data demonstrate that p-FLISA is a valuable tool in detecting low abundant biomarkers in ADTKD.
Table 1.
Clinical features of genetically unaffected controls and ADTKD patients carrying disease-causing UMOD mutations
| Id | UMOD Mutation | Sex | Race | eGFR, mL/min | Age at the Listed eGFR, yr | Age at the Urine Collection, yr | Urinary BiP/Cr, fg/mg | |
|---|---|---|---|---|---|---|---|---|
| Controls | 1 | M | W | 120 | n/a | 41 | 931.263 | |
| 2 | M | NA | 120 | n/a | 12 | 0 | ||
| 3 | F | W | 119.98 | 13 | 13 | 928.863 | ||
| 4 | F | W | 121.99 | 50 | 50 | 1,155.500 | ||
| 5 | M | W | 98.15 | 21 | 21 | 2,488.973 | ||
| 6 | M | W | 82.58 | 32 | 32 | 862.768 | ||
| 7 | F | W | 111.06 | 59 | 59 | 0 | ||
| 8 | F | W | 90.01 | 58 | 58 | 0 | ||
| 9 | F | W | 58.06 | 28 | 28 | 210.543 | ||
| 10 | M | Asian or PI | 107.79 | 14 | 14 | 0 | ||
| 11 | M | NA | 161.88 | 14 | 12 | 0 | ||
| 12 | M | W | 105.48 | 30 | 31 | 259.872 | ||
| 13 | F | W | 121.99 | 50 | 50 | 0 | ||
| 14 | M | W | 100.26 | 34 | 34 | 0 | ||
| 15 | F | W | 82.25 | 53 | 53 | 2,203.974 | ||
| 16 | F | W | 129.67 | 25 | 25 | 0 | ||
| 17 | F | W | 115.22 | 31 | 31 | 996.001 | ||
| Patients | 1 | p.C77Y | M | W | 18.05 | 25 | 25 | 36,32.381 |
| 2 | p.C106F | F | W | 20.11 | 47 | 48 | 6,251.204 | |
| 3 | p.C106F | F | NA | 102.9 | 30 | 30 | 3,596.276 | |
| 4 | p.C135F | M | Asian or PI | 22.02 | 44 | 44 | 2,096.779 | |
| 5 | p.C174R | M | W | 94.92 | 21 | 21 | 2,987.861 | |
| 6 | p.D172H | M | W | 45.12 | 53 | 53 | 27,349.743 | |
| 7 | p.D172H | M | W | 27.14 | 53 | 53 | 21,423.115 | |
| 8 | p.D172H | M | W | 68.56 | 25 | 25 | 3,271.868 | |
| 9 | p.D172H | F | W | 73.69 | 43 | 43 | 3,496.655 | |
| 10 | p.D172H | M | W | 46.36 | 53 | 53 | 322.483 | |
| 11 | p.G103C | F | W | 27.71 | 28 | 30 | 49,777.121 | |
| 12 | p.H177-R185del | M | NA | 8.79 | 29 | 29 | 5,050.132 | |
| 13 | p.H177-R185del | M | W | 28.38 | 58 | 58 | 2,493.850 | |
| 14 | p.H177-R185del | F | W | 21.34 | 39 | 39 | 4,506.369 | |
| 15 | p.H177-R185del | F | W | 111.19 | 15 | 15 | 4,057.104 | |
| 16 | p.H177-R185del | F | W | 30.72 | 36 | 36 | 5,836.339 | |
| 17 | p.H177-R185del | F | W | 33.37 | 52 | 52 | 4,009.635 | |
| 18 | p.H177-R185del | F | W | 66.34 | 16 | 17 | 2,610.488 | |
| 19 | p.L257P | M | W | 42.91 | 36 | 36 | 37,932.387 | |
| 20 | p.N85S | F | W | 25.14 | 43 | 43 | 17,566.451 | |
| 21 | p.R178P | F | W | 51.55 | 29 | 29 | 8,776.746 | |
| 22 | p.R178P | F | W | 66.4 | 35 | 35 | 6,781.924 | |
| 23 | p.R178P | F | W | 75.79 | 33 | 33 | 6,809.285 | |
| 24 | p.R178P | M | W | 83.28 | 40 | 40 | 1,127.851 | |
| 25 | p.R178P | F | W | 16.36 | 28 | 28 | 4,259.507 | |
| 26 | p.V93-G97delinsAASC | F | W | 75.63 | 46 | 46 | 135.418 | |
| 27 | p.V93-G97delinsAASC | F | W | 10 | 35 | 36 | 72,664.293 | |
| 28 | p.V93-G97delinsAASC | F | W | 20.5 | 61 | 61 | 61,651.400 | |
| 29 | p.V93-G97delinsAASC | F | W | 24.59 | 62 | 62 | 75,206.646 | |
| 30 | p.V93-G97delinsAASC | F | W | 28.24 | 67 | 67 | 43,907.339 |
Sex: M, male; F, female.
Race: W, White; PI, Pacific islanders; NA, data not available.
ADTKD, autosomal dominant tubulointerstitial kidney disease; BiP, immunoglobulin heavy chain-binding protein; Cr, creatinine; eGFR, estimated glomerular filtratrion rat; UMOD, uromodulin.
Urinary BiP/Cr Levels Are Inversely Correlated With eGFR
To examine whether urine BiP/Cr values are correlated with the stage of CKD during the disease progression in ADTKD-UMOD, we performed correlation analysis between urinary BiP/Cr and eGFR. As shown in Fig. 4A, a moderate inverse correlation was observed between urinary BiP/Cr and eGFR (Pearson correlation coefficient: −0.41, P = 0.02). In addition, we noted that urinary BiP excretion in two subgroups of patients, those who were at the early stage of the disease (eGFR > 60 mL/min) and those who were toward the terminal stage of the disease (eGFR ≤ 20 mL/min), was both <10,000 fg/mg. Since sustained tubular ER stress causes TAL cell apoptosis, death, and interstitial fibrosis, urinary BiP levels would be severely decreased toward the end stage of the disease due to loss of TAL cells. When we excluded patients with eGFR ≤ 20 mL/min, as shown in Fig. 4B, urinary BiP elevation showed a stronger correlation with decline of kidney function (Pearson correlation coefficient: −0.6, P = 0.0025).
Figure 4.

Significant inverse correlation between urinary immunoglobulin heavy chain-binding protein (BiP) elevation and estimated glomerular filtration rate (eGFR). A: Pearson linear correlation analysis between urinary BiP/creatinine (Cr) and eGFR in 30 patients with autosomal dominant tubulointerstitial kidney disease (ADTKD)-uromodulin (UMOD). B: Pearson linear correlation analysis between urinary BiP/Cr and eGFR in 24 patients with ADTKD-UMOD with eGFR ≥ 20 mL/min. C: representative Western blots of crude urine samples from human patients with ADTKD-UMOD harboring disease-causing mutations, including H177-R185del, C106F, D172H, V93-G97delinsAASC, R178P, and G103C, as well as from their respective genetically unaffected family members were analyzed for urinary BiP excretion. Urinary BiP excretion was normalized to 10 µg of urine Cr excretion.
To verify that identity of the positive signals detected by p-FLISA was indeed BiP, we performed Western blot analysis on all control and patient urine samples. As the BiP-capturing and biotinylated BiP-detection antibodies contained in the BiP kit (LSBio) cannot be disclosed by the company, we used anti-BiP antibody from Proteintech. Representative blots from patients carrying UMOD mutations and controls are shown in Fig. 4C. BiP was readily detected in 5–25 μL of crude urine indexed to 10 μg of urine Cr excretion from patients with ADTKD-UMOD carrying p.H177-R185del, p.C106F, p.D172H, p.V93-G97delinsAASC, p.R178P and p.G103C mutations, whereas urinary BiP excretion was absent or much lower in genetically unaffected family members (Fig. 4C, top and bottom bands). The bottom band is most likely the cleaved BiP by active urinary proteases, since protease inhibitors were not added during the processing of these urine samples. Together, these data confirm the specificity of the p-FLISA, and the ultrasensitive “add-on” assay indicates that urinary BiP excretion levels negatively correlate with eGFR, especially in nonterminal CKD stages.
DISCUSSION
ADTKD is associated with a slow and unpredictable loss of kidney function, and the lack of biomarkers of disease activity has made interventional clinical trials impossible to conduct. Here, we demonstrate that BiP was upregulated and secreted from TAL cells at an early stage of an ADTKD-UMOD mouse model and in patients harboring various UMOD mutations. Moreover, as a proof-of-concept study, for the first time, we successfully achieved the ultrasensitive femtomolar detection of urine BiP using p-FLISA in ADTKD, which demonstrated a strong negative correlation between urinary BiP levels and eGFR in nonterminal stages of CKD in patients with ADTKD-UMOD.
Dysregulated ER proteostasis plays a pivotal role in the development of kidney disease. Recently, a few UPR-induced secreted ER-resident proteins, including ERdj3, protein disulfide isomerase A3, CRELD2, and mesencephalic astrocyte-derived neurotrophic factor have been discovered as urinary ER stress biomarkers in mouse models or patients (18, 21–23). At the COOH-terminus, these proteins either lack the ER retention sequence (ERS) KDEL or have a weaker ERS (REDL or RTDL). Thus, it may be surprising that BiP with the COOH-terminal KDEL is also excreted in the urine of patients with ADTKD-UMOD. A recent seminal study has shown that ER Ca2+ depletion causes a massive departure of ERS-containing proteins, such as BiP, from cells by overwhelming KDEL receptors in the cis-Golgi, which is responsible for coat protein I vesicle-mediated retrograde transport of ERS-containing proteins to the ER. The increased cleavage of ER resident procaspase-12, which is mostly mediated by Ca2+-dependent cytosolic protease, in kidney lysates of UmodC147W/+ mice (20) suggests ER Ca2+ leak, which likely induces BiP secretion extracellularly. The mechanistic link between ER Ca2+ depletion in mutant TAL cells and increased urinary BiP excretion in ADTKD-UMOD warrants further investigation in future studies.
BiP is a mechanistic biomarker that is linked to the central underlying pathogenesis of ER stress-mediated kidney disease. BiP is elevated early on in the disease, before significant loss of kidney function, and novel ER stress modulators, once available, will have an effect on urinary BiP excretion. Thus, a mechanistic marker will allow the initiation of mechanistic treatments and monitoring of the treatment response early on in the disease course, which will dramatically reduce the amount of follow-up time to determine treatment efficacy and make clinical trials much easier and less expensive to conduct.
ADTKD is a genetically heterogeneously disease, caused by mutations in UMOD, mucin 1 (MUC1), renin (REN), and hepatocyte nuclear factor-1β (HNF1B)(2). Besides its clinical utility in monitoring disease activity in ADTKD-UMOD, BiP has been shown to be markedly increased in an immortalized tubular epithelial cell line from a patient with ADTKD-MUC1 compared with a cell line derived from a normal human kidney (24). We plan to assemble a large prospective cohort of patients with ADTKD carrying UMOD or MUC1 mutations to determine the utility and diagnostic accuracy, including specificity, sensitivity, and positive and negative predictive values, of BiP as an ER stress biomarker in different subtypes of ADTKD. Moreover, we plan to evaluate if urinary BiP can serve as an early and sensitive ER stress biomarker in other podocyte or tubular ER stress-mediated kidney diseases.
The proof-of-principle cohort in this study consisted of 17 unaffected family members and 30 patients with ADTKD-UMOD. Since ADTKD-UMOD only affects TAL segments, and proteins released from the TAL may be reabsorbed in the distal tubules, detection and quantification of low-abundance urinary biomarkers in ADTKD is challenging. For the first time, we have developed an ultrasensitive bioanalytical tool to measure urinary BiP levels in patients with ADTKD-UMOD for the future goal of risk stratification, disease monitoring, and evaluation of ER-targeted therapies in ADTKD. Another great advantage of PF is that it can serve as an “add-on” label for a broad range of bioassays to improve their signal-to-noise ratio without altering their existing workflows (19). This cross-assay signal amplification nanotechnology may accelerate the development of more novel biomarkers for ADTKD and other kidney diseases in an easy-to-implement manner.
GRANTS
S.K. was supported by Project LTAUSA19068 from the Ministry of Education, Youth and Sports of the Czech Republic and NV17-29786A from the Ministry of Health of the Czech Republic. A.J.B. was supported by National Institutes of Health (NIH) Grant R21DK106584. J.M. was supported by NIH Grant R01CA141521. S.S. was supported by National Science Foundation Awards CBET-1908167 and CBET-1900277 and NIH Grant R21CA23665202. Y.M.C. was supported by NIH Grants R01DK105056A1, R03DK106451, and K08DK089015 and the Office of the Assistant Secretary of Defense for Health Affairs through the Peer Reviewed Medical Research Program under Award W81XWH-19-1-0320, George M. O’Brien Kidney Research Core Center (NU GoKidney, NIH Grant P30DK114857), a Mallinckrodt challenge grant, Washington University Center for Drug Discovery, Investigator Matching Micro Grant, Faculty Scholar Award (MD-FR-2013-336) from the Children’s Discovery Institute of Washington University and St. Louis Children’s Hospital, and Career Development Award from the Nephrotic Syndrome Study Network. Y.M.C. is a member of Washington University Institute of Clinical and Translational Sciences (UL1TR000448) and Diabetes Research Center (NIH Grant P30DK020579). We also thank the Slim Health Foundation and Black-Brogan Foundation for support.
DISCLOSURES
Y.M.C. and Y.K. are inventors on a patent (United States patent no. 10,156,564) entitled “Methods of detecting biomarkers of ER stress-associated kidney diseases” related to the discovery of BiP as an ER stress biomarker, which was issued by the United States Patent and Trademark Office on Dec. 18, 2018. J.J.M. and S.S. are inventors on a provisional patent related to PF. The technology has been licensed by the Office of Technology Management at Washington University in St. Louis to Auragent Bioscience, which is developing PF products. J.J.M. and S.S. are co-founders/shareholders of Auragent Bioscience. J.J.M., S.S., and Washington University are entitled to receive royalties based on royalties licensed to Auragent Bioscience. None of the other authors has any conflicts of interest, financial or otherwise, to disclose.
AUTHOR CONTRIBUTIONS
Y.K., S.S., and Y.M.C. conceived and designed research; Y.K., Z.W., and Y.W. performed experiments; Y.K., Z.W., C.L., K.K., Y.W., A.J.B., and Y.M.C. analyzed data; Y.K., Z.W., C.L., K.K., Y.W., B.J., A.B., S.S., and Y.M.C. interpreted results of experiments; Y.K. and Y.M.C. prepared figures; Y.M.C. drafted manuscript; Y.K., J.D., Z.W., C.L., K.K., Y.W., B.J., S.K., J.M., A.B., S.S., and Y.M.C. edited and revised manuscript; Y.K., J.D., Z.W., C.L., K.K., Y.W., B.J., S.K., J.M., A.B., S.S., and Y.M.C. approved final version of manuscript.
ACKNOWLEDGMENTS
We thank the Musculoskeletal Research Center Morphology Core (supported by National Institutes of Health Grant P30AR057235) for histology. Mice were housed in the Mouse Genetics Core.
REFERENCES
- 1.Gast C, Marinaki A, Arenas-Hernandez M, Campbell S, Seaby EG, Pengelly RJ, Gale DP, Connor TM, Bunyan DJ, Hodanova K, Zivna M, Kmoch S, Ennis S, Venkat-Raman G. Autosomal dominant tubulointerstitial kidney disease-UMOD is the most frequent non polycystic genetic kidney disease. BMC Nephrol 19: 301, 2018. doi: 10.1186/s12882-018-1107-y. [DOI] [PMC free article] [PubMed] [Google Scholar]
- 2.Eckardt KU, Alper SL, Antignac C, Bleyer AJ, Chauveau D, Dahan K, Deltas C, Hosking A, Kmoch S, Rampoldi L, Wiesener M, Wolf MT, Devuyst O; Kidney Disease: Improving Global Outcomes. Autosomal dominant tubulointerstitial kidney disease: diagnosis, classification, and management-A KDIGO consensus report. Kidney Int 88: 676–683, 2015. doi: 10.1038/ki.2015.28. [DOI] [PubMed] [Google Scholar]
- 3.Rampoldi L, Scolari F, Amoroso A, Ghiggeri G, Devuyst O. The rediscovery of uromodulin (Tamm-Horsfall protein): from tubulointerstitial nephropathy to chronic kidney disease. Kidney Int 80: 338–347, 2011. doi: 10.1038/ki.2011.134. [DOI] [PubMed] [Google Scholar]
- 4.Cybulsky AV. Endoplasmic reticulum stress, the unfolded protein response and autophagy in kidney diseases. Nat Rev Nephrol 13: 681–696, 2017. doi: 10.1038/nrneph.2017.129. [DOI] [PubMed] [Google Scholar]
- 5.Oslowski CM, Urano F. Measuring ER stress and the unfolded protein response using mammalian tissue culture system. Methods Enzymol 490: 71–92, 2011. doi: 10.1016/B978-0-12-385114-7.00004-0. [DOI] [PMC free article] [PubMed] [Google Scholar]
- 6.Bernascone I, Janas S, Ikehata M, Trudu M, Corbelli A, Schaeffer C, Rastaldi MP, Devuyst O, Rampoldi L. A transgenic mouse model for uromodulin-associated kidney diseases shows specific tubulo-interstitial damage, urinary concentrating defect and renal failure. Hum Mol Genet 19: 2998–3010, 2010. doi: 10.1093/hmg/ddq205. [DOI] [PubMed] [Google Scholar]
- 7.Bernascone I, Vavassori S, Di Pentima A, Santambrogio S, Lamorte G, Amoroso A, Scolari F, Ghiggeri GM, Casari G, Polishchuk R, Rampoldi L. Defective intracellular trafficking of uromodulin mutant isoforms. Traffic 7: 1567–1579, 2006. doi: 10.1111/j.1600-0854.2006.00481.x. [DOI] [PubMed] [Google Scholar]
- 8.Kemter E, Prueckl P, Sklenak S, Rathkolb B, Habermann FA, Hans W, Gailus-Durner V, Fuchs H, de Angelis MH, Wolf E, Aigner B, Wanke R. Type of uromodulin mutation and allelic status influence onset and severity of uromodulin-associated kidney disease in mice. Hum Mol Genet 22: 4148–4163, 2013. doi: 10.1093/hmg/ddt263. [DOI] [PubMed] [Google Scholar]
- 9.Rampoldi L, Caridi G, Santon D, Boaretto F, Bernascone I, Lamorte G, Tardanico R, Dagnino M, Colussi G, Scolari F, Ghiggeri GM, Amoroso A, Casari G. Allelism of MCKD, FJHN and GCKD caused by impairment of uromodulin export dynamics. Hum Mol Genet 12: 3369–3384, 2003. doi: 10.1093/hmg/ddg353. [DOI] [PubMed] [Google Scholar]
- 10.Vylet'al P, Kublová M, Kalbáčová M, Hodaňová K, Barešová V, Stibůrková B, Sikora J, Hůlková H, Živný J, Majewski J, Simmonds A, Fryns J-P, Venkat-Raman G, Elleder M, Kmoch S. Alterations of uromodulin biology: a common denominator of the genetically heterogeneous FJHN/MCKD syndrome. Kidney Int 70: 1155–1169, 2006. doi: 10.1038/sj.ki.5001728. [DOI] [PubMed] [Google Scholar]
- 11.Li M, Baumeister P, Roy B, Phan T, Foti D, Luo S, Lee AS. ATF6 as a transcription activator of the endoplasmic reticulum stress element: thapsigargin stress-induced changes and synergistic interactions with NF-Y and YY1. Mol Cell Biol 20: 5096–5106, 2000. doi: 10.1128/MCB.20.14.5096-5106.2000. [DOI] [PMC free article] [PubMed] [Google Scholar]
- 12.Parker R, Phan T, Baumeister P, Roy B, Cheriyath V, Roy AL, Lee AS. Identification of TFII-I as the endoplasmic reticulum stress response element binding factor ERSF: its autoregulation by stress and interaction with ATF6. Mol Cell Biol 21: 3220–3233, 2001. doi: 10.1128/MCB.21.9.3220-3233.2001. [DOI] [PMC free article] [PubMed] [Google Scholar]
- 13.Amin-Wetzel N, Saunders RA, Kamphuis MJ, Rato C, Preissler S, Harding HP, Ron D. A J-protein co-chaperone recruits BiP to monomerize IRE1 and repress the unfolded protein response. Cell 171: 1625–1637.e13, 2017. doi: 10.1016/j.cell.2017.10.040. [DOI] [PMC free article] [PubMed] [Google Scholar]
- 14.Delpino A, Castelli M. The 78 kDa glucose-regulated protein (GRP78/BIP) is expressed on the cell membrane, is released into cell culture medium and is also present in human peripheral circulation. Biosci Rep 22: 407–420, 2002. doi: 10.1023/a:1020966008615. [DOI] [PubMed] [Google Scholar]
- 15.Trychta KA, Back S, Henderson MJ, Harvey BK. KDEL receptors are differentially regulated to maintain the ER proteome under calcium deficiency. Cell Rep 25: 1829–1840.e26, 2018. doi: 10.1016/j.celrep.2018.10.055. [DOI] [PMC free article] [PubMed] [Google Scholar]
- 16.Kern J, Untergasser G, Zenzmaier C, Sarg B, Gastl G, Gunsilius E, Steurer M. GRP-78 secreted by tumor cells blocks the antiangiogenic activity of bortezomib. Blood 114: 3960–3967, 2009. doi: 10.1182/blood-2009-03-209668. [DOI] [PubMed] [Google Scholar]
- 17.Panayi GS, Corrigall VM. Immunoglobulin heavy-chain-binding protein (BiP): a stress protein that has the potential to be a novel therapy for rheumatoid arthritis. Biochem Soc Trans 42: 1752–1755, 2014. doi: 10.1042/BST20140230. [DOI] [PubMed] [Google Scholar]
- 18.Kim Y, Park SJ, Manson SR, Molina CA, Kidd K, Thiessen-Philbrook H, Perry RJ, Liapis H, Kmoch S, Parikh CR, Bleyer AJ, Chen YM. Elevated urinary CRELD2 is associated with endoplasmic reticulum stress-mediated kidney disease. JCI Insight 2: e92896, 2017. doi: 10.1172/jci.insight.92896. [DOI] [PMC free article] [PubMed] [Google Scholar]
- 19.Luan J, Seth A, Gupta R, Wang Z, Rathi P, Cao S, Gholami Derami H, Tang R, Xu B, Achilefu S, Morrissey JJ, Singamaneni S. Ultrabright fluorescent nanoscale labels for the femtomolar detection of analytes with standard bioassays. Nat Biomed Eng 4: 518–530, 2020. doi: 10.1038/s41551-020-0547-4. [DOI] [PMC free article] [PubMed] [Google Scholar]
- 20.Johnson BG, Dang LT, Marsh G, Roach AM, Levine ZG, Monti A, Reyon D, Feigenbaum L, Duffield JS. Uromodulin p.Cys147Trp mutation drives kidney disease by activating ER stress and apoptosis. J Clin Invest 127: 3954–3969, 2017. doi: 10.1172/JCI93817. [DOI] [PMC free article] [PubMed] [Google Scholar]
- 21.Dihazi H, Dihazi GH, Bibi A, Eltoweissy M, Mueller CA, Asif AR, Rubel D, Vasko R, Mueller GA. Secretion of ERP57 is important for extracellular matrix accumulation and progression of renal fibrosis, and is an early sign of disease onset. J Cell Sci 126: 3649–3663, 2013. [Erratum in J Cell Sci 131: jcs219014, 2018]. doi: 10.1242/jcs.125088. [DOI] [PubMed] [Google Scholar]
- 22.Kim Y, Lee H, Manson SR, Lindahl M, Evans B, Miner JH, Urano F, Chen YM. Mesencephalic astrocyte-derived neurotrophic factor as a urine biomarker for endoplasmic reticulum stress-related kidney diseases. J Am Soc Nephrol 27: 2974–2982, 2016. doi: 10.1681/ASN.2014100986. [DOI] [PMC free article] [PubMed] [Google Scholar]
- 23.Tousson-Abouelazm N, Papillon J, Guillemette J, Cybulsky AV. Urinary ERdj3 and mesencephalic astrocyte-derived neutrophic factor identify endoplasmic reticulum stress in glomerular disease. Lab Invest 100: 945–958, 2020. doi: 10.1038/s41374-020-0416-5. [DOI] [PubMed] [Google Scholar]
- 24.Dvela-Levitt M, Kost-Alimova M, Emani M, Kohnert E, Thompson R, Sidhom EH, et al. Small molecule targets TMED9 and promotes lysosomal degradation to reverse proteinopathy. Cell 178: 521–535.e523, 2019. doi: 10.1016/j.cell.2019.07.002. [DOI] [PubMed] [Google Scholar]