

Abstract
Aim:
Critical illness myopathy (CIM) is a consequence of modem critical care, leading to skeletal muscle atrophy/paralysis with negative consequences for mortality/morbidity and health care costs. Glucocorticoids (GCs) have been proposed to trigger CIM. Here, we compare outcomes of two GCs, the commonly used prednisolone and the newly developed dissociative vamorolone in response to the intensive care unit (ICU) condition for 5 days, ie, sedation, immobilization, and mechanical ventilation.
Methods:
Rats were divided into a 0-day sham-operated control group, and three groups exposed to 5 days ICU condition during treatment with prednisolone (PRED) or vamorolone (VAM) or none of these GCs (ICU-group). Survival, body and muscle weights, cytokine concentrations, regulation of muscle contraction in single fast- and slow-twitch muscle fibres, myofibrillar protein expression and protein degradation pathways were studied.
Results:
Critical illness myopathy geno- and pheno-types were confirmed in the ICU group. However, VAM and PRED groups showed reduced atrophy/weakness than the ICU group, and muscle specific differences with more severe negative effects on fast-twitch muscle fibres in the PRED than the other groups.
Conclusion:
These results show that vamorolone provides a GC intervention superior to typical GCs in improving CIM outcomes. Further, the findings do not support the notion that moderate-dose GC treatment represents a factor triggering CIM.
Keywords: Glucocorticoids, ICU, muscle wasting, prednisolone, vamorolone
1 |. INTRODUCTION
Severe muscle wasting and impaired muscle function in critically ill patients, usually termed as critical illness myopathy (CIM), is a debilitating condition that complicates recovery from primary disease. CIM develops rapidly in intensive care unit (ICU) patients due to common interventions such as immobilization, sedation, and mechanical ventilation with or without neuromuscular blockade. CIM is characterized by progressive atrophy and weakness due to increased protein breakdown and transcriptional down-regulation of the motor protein myosin leading to the hallmark of CIM: the preferential loss of thick filament proteins.1 CIM has significant negative effects on patients quality of life as well as economic consequences due to longer ICU stays, complications, and post-ICU rehabilitation. Thus, there is a significant need for an improved understanding of CM mechanisms and the development of interventions alleviating the severe muscle wasting and impaired muscle function associated with CIM.
Systemic inflammation contributes to the pathology of many disorders including CIM.2 Glucocorticoids (GCs) can reduce inflammation but can also have morbid side effects on muscle mass.3 Systemic GC administration has led to mixed skeletal muscle outcomes depending on exposure duration and dose.1,4–7 One of the main concerns in using GCs in CIM patients is the acceleration of protein degradation, thus exacerbating muscle wasting. Glucocorticoids have therefore been forwarded as a major factor triggering CIM.8 However, a new class of dissociative GCs is reportedly able to activate anti-inflammatory pathways selectively and minimize activation of mechanisms that lead to negative side effects, and can thus “dissociate” the two pathways. VBP15, given the name vamorolone more recently, is a dissociative GC derived from prednisolone and has shown promising effects in multiple mouse models9,10 and most recently has shown pharmacodynamics safety in a first-in-human Phase 1 Clinical Trial.11
This study compares effects of prednisolone and vamorolone on skeletal muscle function in an experimental ICU model not limited by early mortality. We have, in a series of previous studies, shown that this model induces a geno- and pheno-type resembling CIM, including progressive muscle atrophy and weakness, preferential myosin loss in limb muscles,12,13 early diaphragm dysfunction,14,15, and relative preservation of masticatory muscles16 in response to long-term exposure to the ICU condition. Hence, this model offers the opportunity to study the effects of both the typical GC, prednisolone, and the recently developed vamorolone without the confounding impact of early mortality or underlying disease.
2 |. RESULTS
During the initial 48 hours of the experiments, mortality is primarily related to technical problems related to instrumentation or complications during initial surgery. Survival has therefore been calculated after the initial 48 hours of the 5-day experimental period. An improved survival was observed in animals treated with vamorolone (VAM group) compared with animals treated with prednisolone (PRED group) or the 5-day mechanically ventilated controls (ICU group). Survival at the third day was 61, 86, and 100% for the ICU, PRED, and VAM groups, respectively, and 50, 57, and 86% at 5 days (Figure 1A).
FIGURE 1.
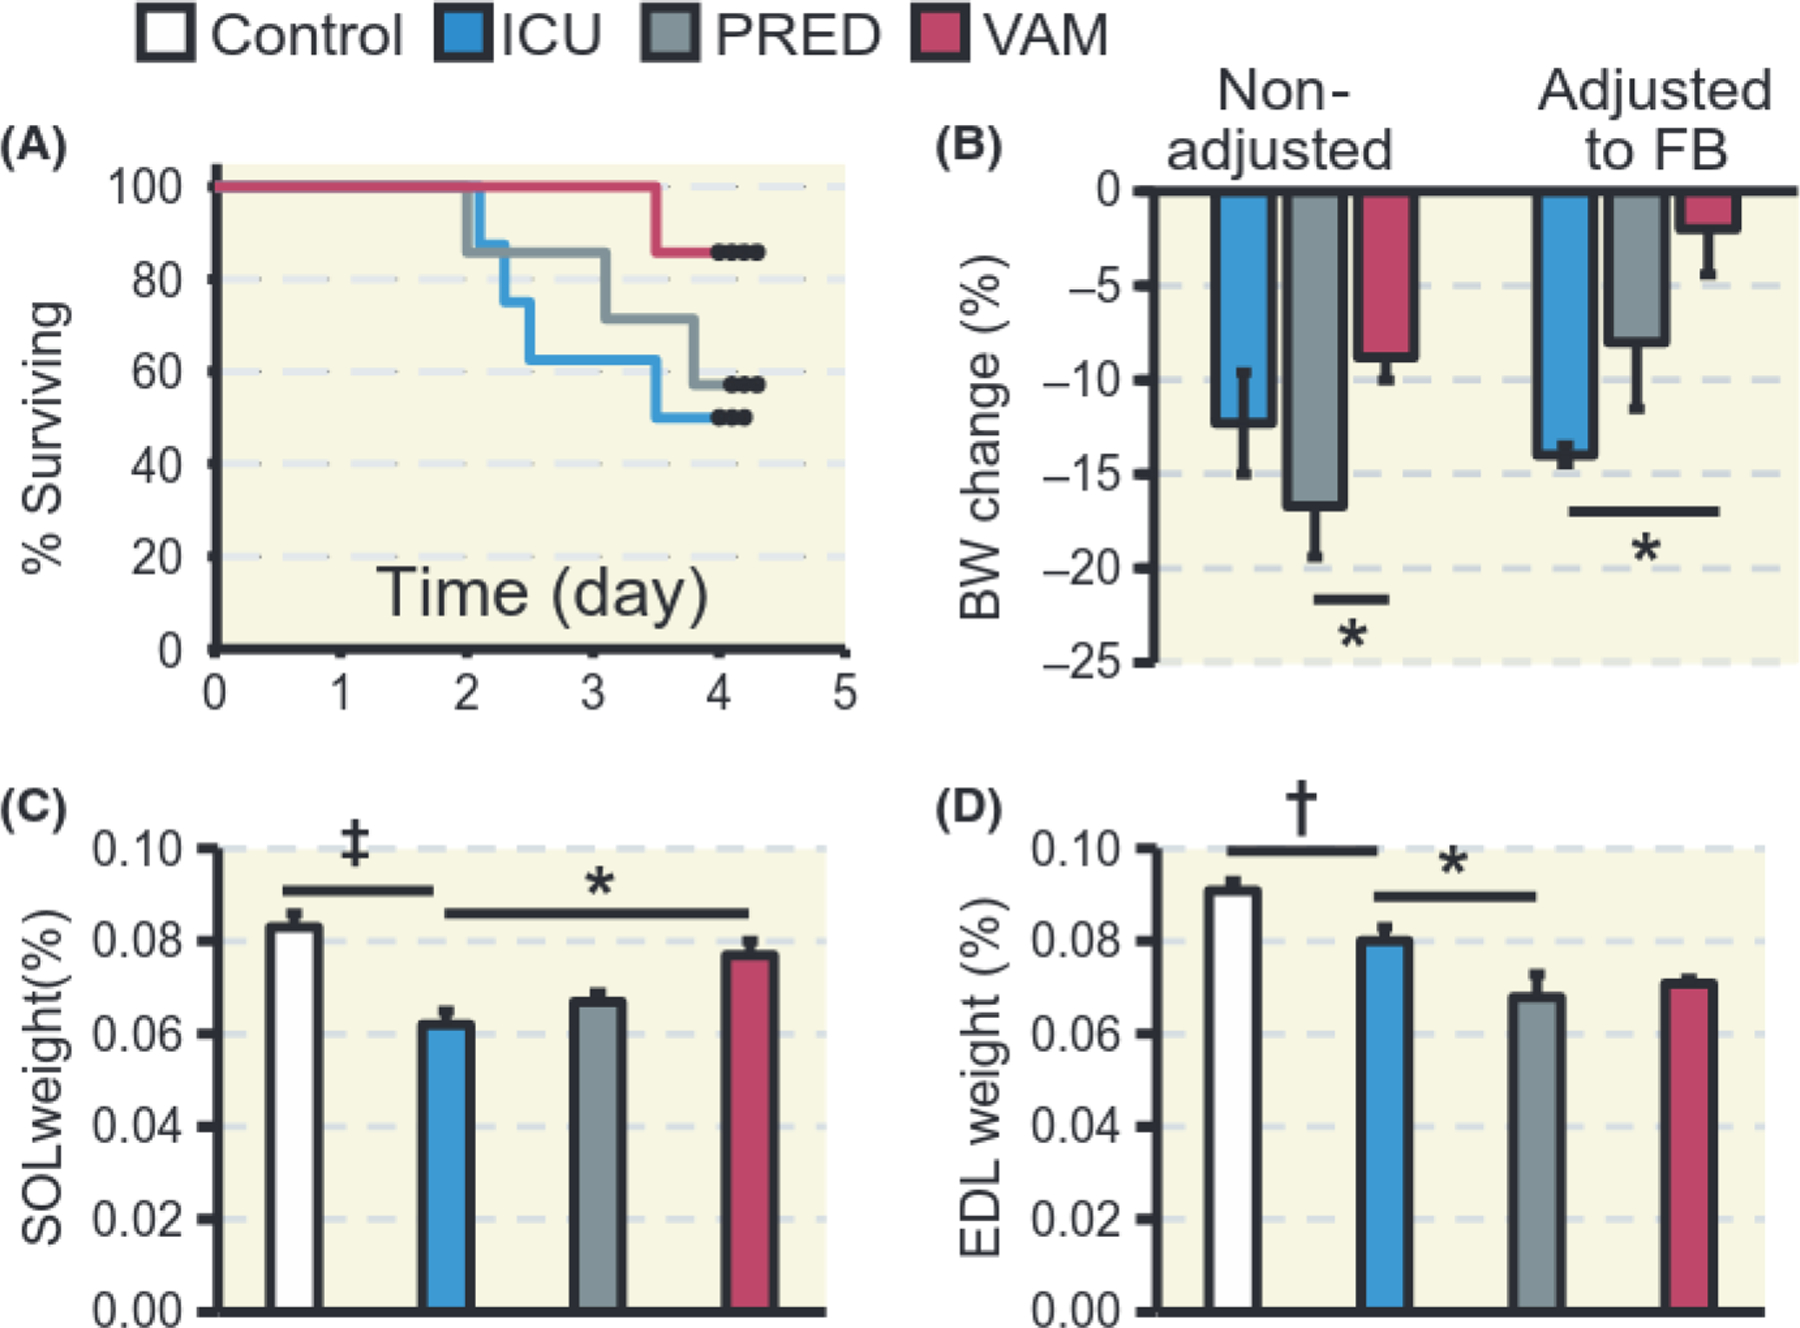
Survival, body, and muscle weights. A, Kaplan-Meier’s survival plot excluding mortality before the initial 2 days of ICU intervention (N = 8, 7, and 7, ICU, PRED, and VAM respectively). B, Relative changes in body weight (BW) before and after adjustment for fluid balance (FB). C, Soleus and D, EDL muscle weights expressed as per cent of BW. In B, C, D, N = 6, 5, 4 and 5, for Control, ICU, PRED, and VAM respectively. Controls are sham-operated rats; ICU are exposed to 5 days of sedation, pharmacological paralysis and mechanical ventilation with no glucocorticoid treatment; PRED, with prednisolone treatment and VAM with vamorolone treatment. Values are means ± SEM. T test was used to compare Control and ICU and one-way ANOVA to compare ICU, PRED and VAM. Asterisk (*) represents P < 0.05, obelisk (†) P < 0.01 and diesis (‡) P < 0.001
2.1 |. Body and muscle weights
Total body weight decreased (P < 0.01) in response to 5 days exposure to the ICU condition, ie, immobilization and mechanical ventilation, independent of intervention. Body weight decreased by 12, 17%, and 9% in the ICU, PRED, and VAM groups, respectively, although body weight decreased less in the VAM than in the PRED group (P < 0.05) (Figure 1B).
Prednisolone has a diuretic effect in both humans and animals by increasing renal plasma flow and glomerular filtration rate.17,18 This effect resulted in a negative fluid balance at the end of the 5-day period, especially in the PRED group. The ICU group, on the other hand, had a net positive fluid balance. When adjusting body weights for net fluid balance, body weight loss in the ICU, PRED, and VAM groups were 14%, 8%, and 2%, respectively, resulting in a significantly (P < 0.05) improved maintenance of body mass in the VAM vs the ICU group (Figure 1B). Fluid balance differences resulted in significant 2% (P < 0.05) dehydration only in the PRED group (Table 1).
TABLE 1.
Body weights and water content in control rats and those exposed to sedation, mechanical ventilation, and immobilization for 5 days (ICU) with prednisolone (PRED) or vamorolone (VAM)
| Variable | Control (1) | ICU (2) | PRED (3) | VAM (4) | P valuea |
|---|---|---|---|---|---|
| N | 6 | 5 | 4 | 5 | |
| Initial body weight, mean (± SEM) | 325 ± 7 | 302 ± 17 | 309 ± 23 | 321 ± 15 | NS |
| Body weight change (g), mean (± SEM) | 0(2) | −36 ± 8(1) | −52 ± 5(4) | −28 ± 4(3) | (1,2) < 0.01, (3,4) < 0.05 |
| Fluid balance (mL), mean (± SEM) | – | 11.7 ± 2.2(3,4) | −27.5 ± 8.7(2) | −20.7 ± 8.6(2) | <0.05 |
| Muscle water content (%), mean (± SEM) | 75.4 ± 0.416 | 75.9 ± 0.259(3) | 73.9 ± 0.37(2,4) | 76.2 ± 0.5(3) | (2,3) < 0.05, (3,4) < 0.05 |
P value from t test (Control and ICU) or one-way ANOVA (ICU. PRED and VAM), Numbers in brackets (1,2,3,4) indicate the two groups being compared.
In the slow-twitch soleus, muscle weight decreased by 25% in the ICU group compared with controls (P < 0.001), by 20% in the PRED group, and by 7% in the VAM group, ie, significantly less (P < 0.05) than in the ICU group (Figure IC). On the other hand, in the fast-twitch EDL, muscle weight decreased significantly in the ICU group relative to controls (P < 0.01) and further in the PRED (P < 0.05) but not in the VAM group relative to ICU group (Figure ID).
2.2 |. Single fibre contractile measurements
In order to eliminate the influence of adjacent muscle fibres and interstitial tissue, regulation of muscle contraction was studied at the single muscle fibre level.19 Maximum force and fibre size were measured in 399 soleus and EDL myofibres. In the soleus, the majority of muscle fibres expressed the type I MyHC isoform and a smaller proportion (7%−18%) of the muscle fibres expressed the type IIa or the combination of type I and IIa MyHCs, but there was no difference in MyHC isoform expression between the ICU, PRED, or VAM groups. In the EDL, the proportion of the type I MyHC isoform was negligible in all groups and hybrid fibres expressing isoforms IIx and IIb of MyHCs dominated, but there was no significant difference between groups (58%, 79%, 60%, and 79% in controls, ICU, PRED, and VAM groups respectively).
Immobilization for 5 days resulted in a 25% (P < 0.001) decline in soleus muscle fibre CSA in the ICU group compared with controls. However, in the two GC-intervention groups (PRED, VAM), soleus muscle fibre size did not differ from controls and was significantly larger than in the ICU group (P < 0.001; Figure 2A). Similarly, maximum force (P0) declined (P < 0.001) by 45% in the ICU group compared with controls, but was less reduced in the PRED (27%) or VAM (21%) groups, where P0 was significantly higher (P < 0.001), than in the ICU group (Figure 2B). Maximum force (P0) normalized to size (CSA), ie, specific force (P0/CSA), was 20, 23, and 18% lower in the ICU, PRED, and VAM groups, respectively, albeit statistically significant only in the ICU group (P < 0.001; Figure 2C).
FIGURE 2.
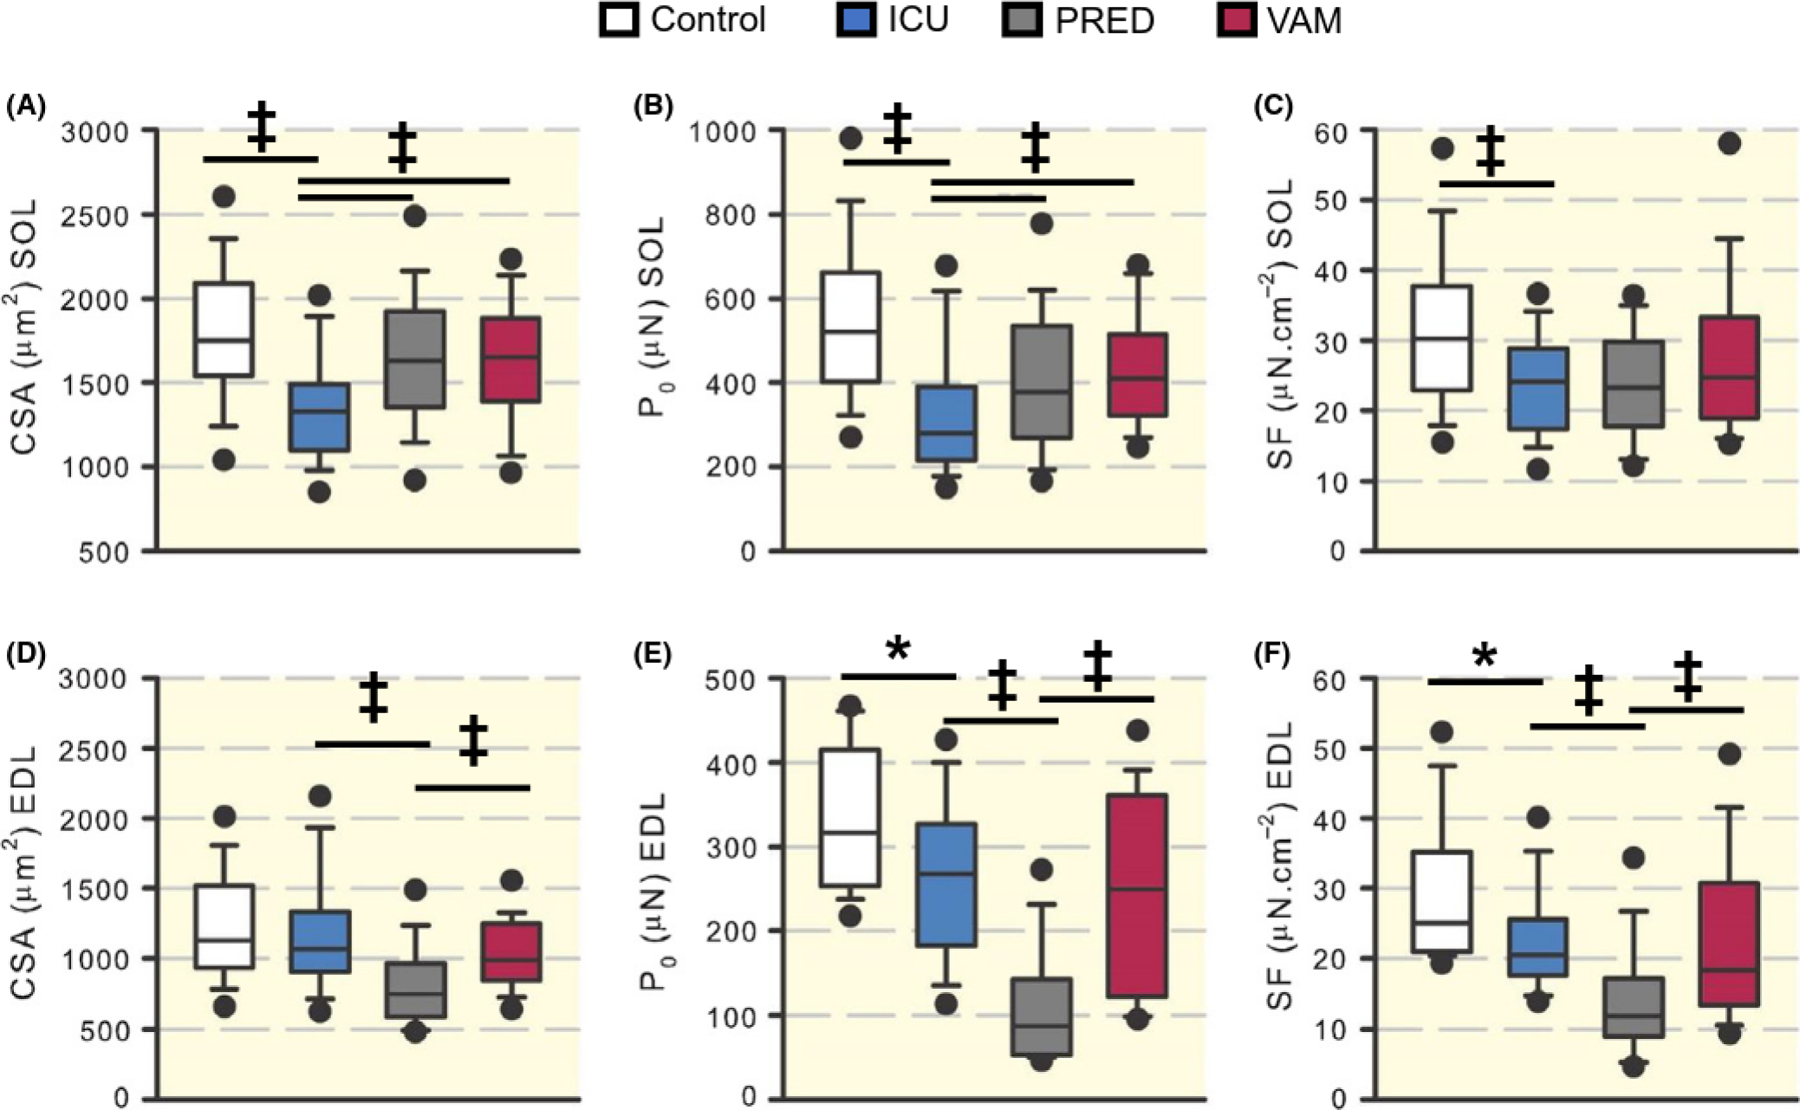
Single muscle fibre measurements. Box plots representing cross-sectional area (CSA) at a defined sarcomere length (A, D), maximal force (P0) (B, E), and specific force (SF) (C, F) in soleus and EDL muscles. Filled circles are the 95th percentiles. Asterisk (*) represents P < 0.05, obelisk (†) P < 0.01 and diesis (‡) P < 0.001
In the EDL, myofibre CSA was 5%, 34%, and 12% lower in the ICU, PRED, and VAM groups, respectively, than in controls and a more pronounced fibre atrophy (P < 0.001) was observed in the PRED group than in the ICU and VAM groups (Figure 2D). P0 and specific force changes followed the same pattern in the EDL (Figure 2E, F). In the ICU group, P0 decreased by 20% and SF by 18% compared to controls (P < 0.05). In the VAM group, P0 and SF were 25% and 27%, respectively, less than controls, with no statistical difference between the ICU and VAM groups. In the PRED group, on the other hand, the declines in P0 (74%) and SF (53%) were greater compared with controls, and significantly lower (P < 0.001) than in the ICU and VAM groups.
2.3 |. Contractile proteins
Preferential myosin loss is a hallmark of CIM in limb muscles and is secondary to transcriptional downregulation of myosin synthesis and activation of protein degradation pathways.20 The decline in mRNA expression of the dominant myosin heavy chain (MyHC) isoforms in the soleus (MyHC type I, P < 0.05) and EDL (MyHC type IIx and IIb, P < 0.01) were significant in the ICU compared with the control group (Figure 3A,C), Actin expression, on the other hand, did not differ from controls in the ICU and VAM experimental groups in either soleus or EDL muscles (Figure 3B,D) except for the increased (P < 0.05) actin expression in the soleus PRED group. At the protein level, in the soleus muscle, myosin to actin ratio was decreased by 19% (P < 0.05), 2%, and 6% in ICU, PRED, and VAM groups, compared with controls (Figure 3E). In the EDL, myosin to actin ratios were 16% and 13% lower (P < 0.05) than controls in the ICU and PRED groups, respectively, but did not differ from controls in the VAM group (5%) (Figure 3F).
FIGURE 3.
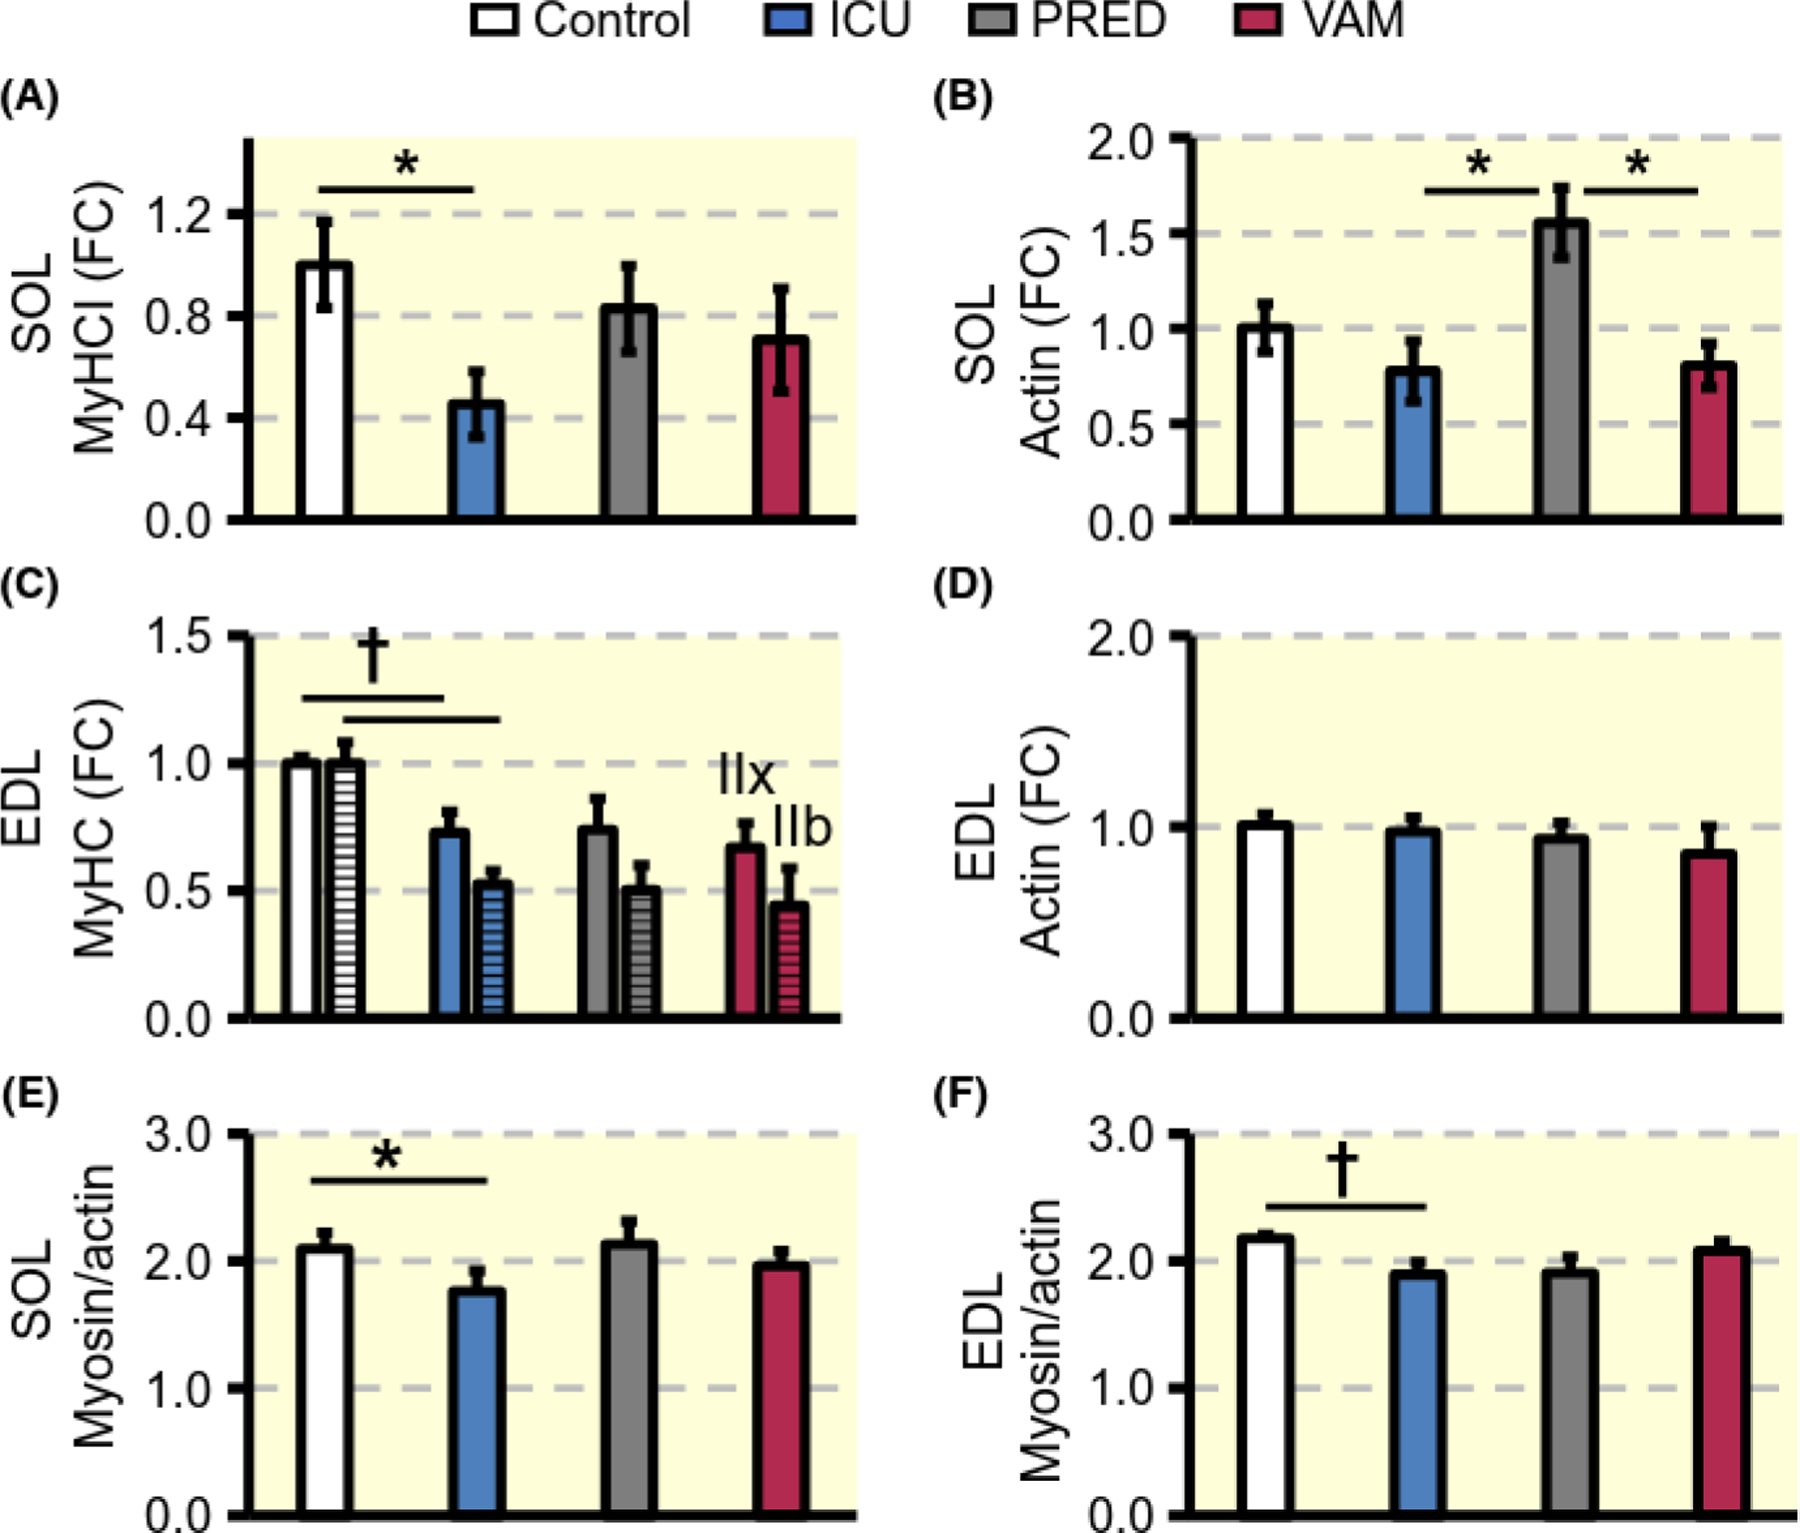
Contractile proteins. Fold change (FC) in mRNA expression of dominant MyHC isoforms (A, C), and actin (B, D) in soleus and EDL muscles respectively. Myosin:actin protein ratio (E, F). Values are means ± SEM. Asterisk (*) represents P < 0.05 and obelisk (†) P < 0.01
2.4 |. Protein degradation
The ubiquitin proteasome protein degradation pathway has been shown to play an important role in the muscle wasting associated with CI NI in both clinica120–21 and experimental studies.12,15,22 In this study, four different E3 ligases were investigated, ie, the two atrogenes MuRF1 and atrogin-1 as well as FBOX31 and SMART, which have recently been identified as muscle atrophy-related ubiquitin ligases.22,23 In the soleus, MuRF1 expression levels were 8-fold higher (P < 0.05) in the ICU group than in controls and 20-fold higher (P < 0.001) in the PRED than in the ICU group. In the VAM group, on the other hand, MuRF1 transcription levels were lower than in both the ICU (P < 0.05) and PRED groups (P < 0.001; Figure 4A). Atrogin-1 mRNA levels were 3- to 4-fold higher in ICU and PRED groups compared with controls, while a lower (P < 0.05) atrogin-1 expression was observed in the VAM than in the PRED group (Figure 4B). A significant increase (P < 0.05) in FBOX31 expression was observed in the ICU group, while SMART expression did not change significantly (Figure 4C, D). In the EDL, however, increases of the four assayed E3 ligases were not significantly different across the three groups (ICU, PRED, and VAM) and all the four E3 ligases were up-regulated (P < 0.05–0.001) compared with controls (Figure 4E–H).
FIGURE 4.
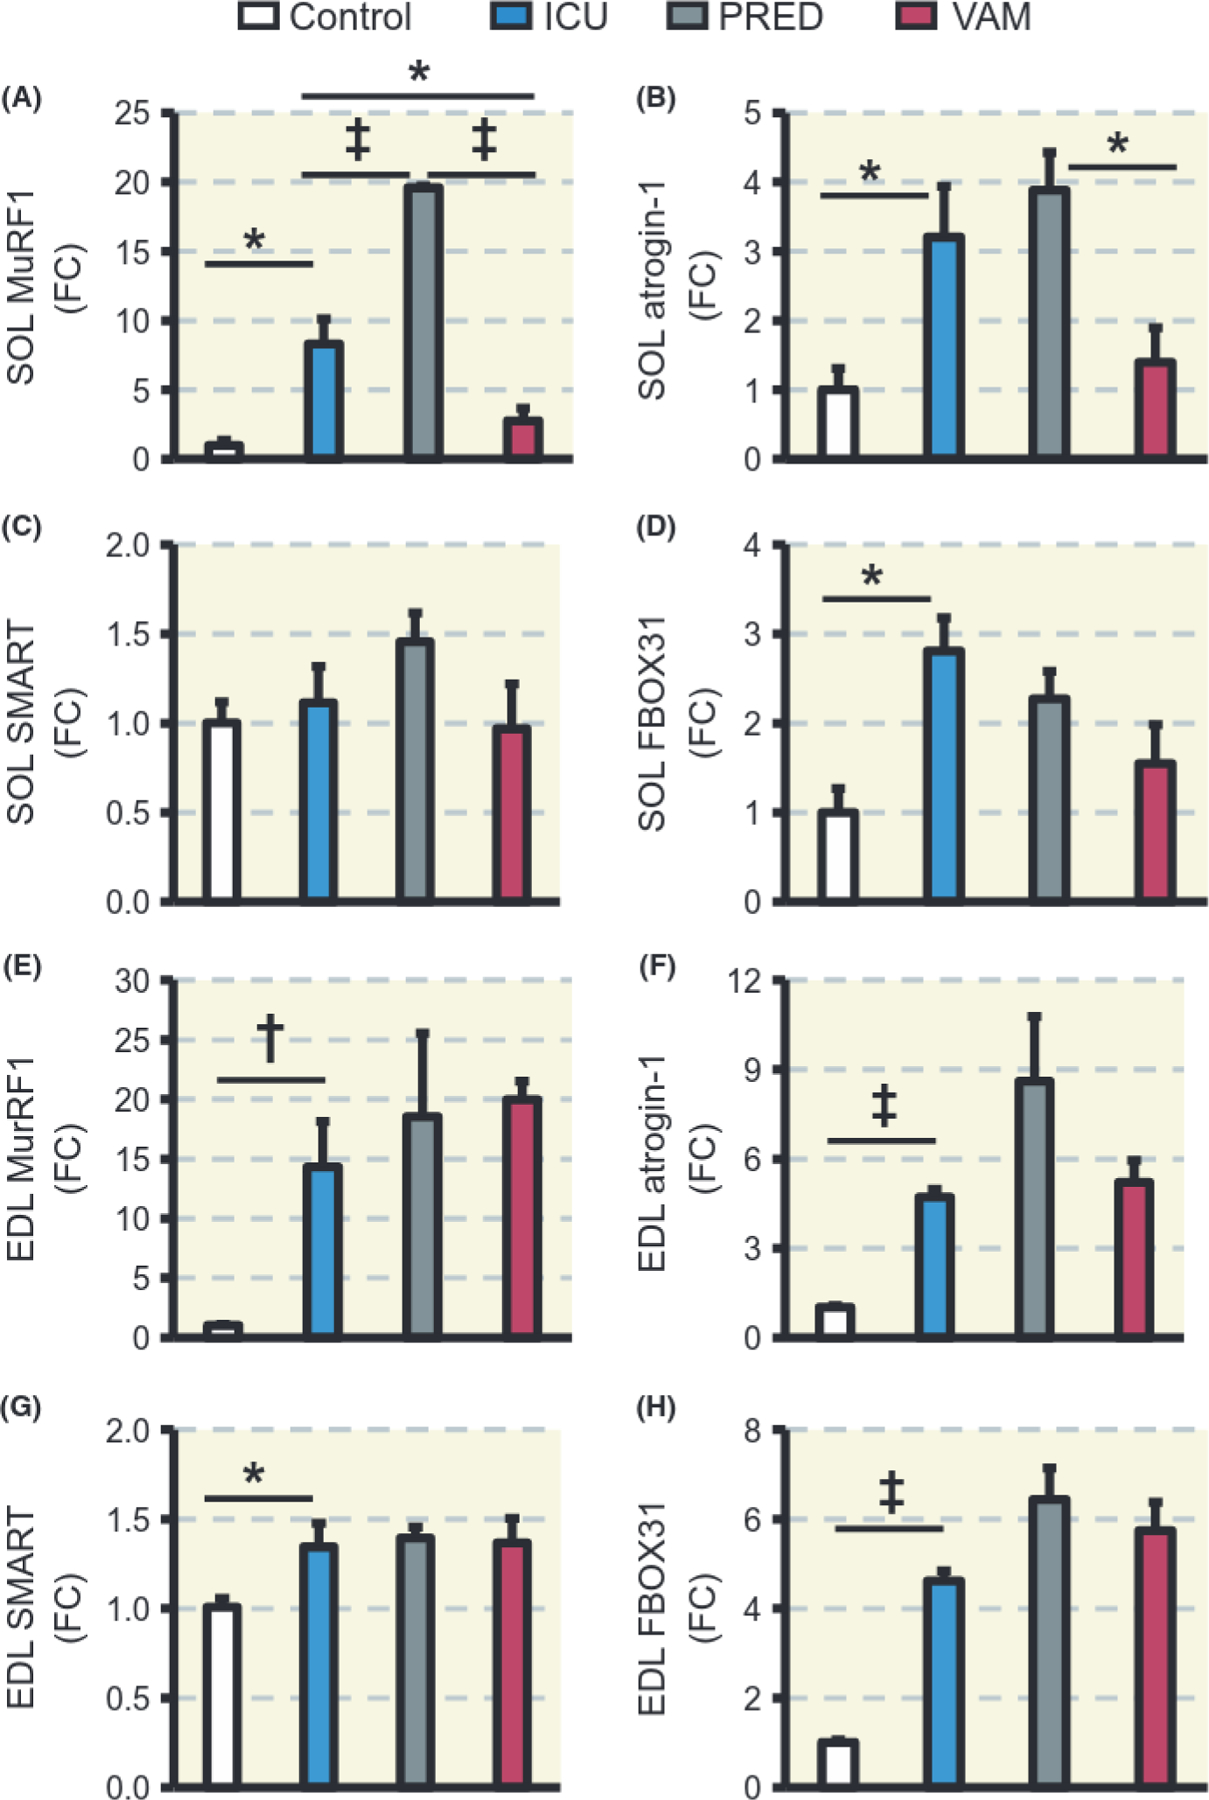
Protein degradation. Quantitative PCR expression levels as fold change (FC) of MuRF1 (A, E), atrogin-1 (B, F), SMART (C, G), and FBOX31 (D, H) in soleus and EDL muscles respectively. Values are means ± SEM. Asterisk (*) represents P < 0.05, obelisk (†) P < 0.01 and diesis (‡) P < 0.001
In order to validate the mRNA analyses, protein expression of MuRF-1 and atrogin-1 in the soleus and EDL was measured by immunoblotting (Figure 5A, B and G, H respectively). In the soleus and EDL, unlike mRNA levels, MuRF1 and atrogin-1 protein levels were not statistically different between the three treatment groups. Since there were no differential muscle effects by PRED and VAM on the atrogenes, the lysosomal autophagy and the calcium-dependent calpain protein degradation pathways were investigated, as these degradation pathways are also activated by GCs. conversion from LC3B-I to LC3B-II is a widely used marker of autophagy.25 The LC3B-II to I ratio was not changed and did not differ significantly between the ICU, PRED, and VAM groups in either the soleus or EDL (Figure 5C, D and I, J respectively). The calcium-dependent calpain 1 protease primarily degrades cytoskeletal rather than contractile proteins. Full length calpain 1 and its active truncated form were highly expressed in the PRED group compared with the ICU or VAM groups in both the soleus and EDL. Specifically, prednisolone induced significantly higher levels of calpain 1 in the soleus compared with the ICU group (p < 0.05), whereas in the EDL, calpain 1 induction was significantly lower in the VAM compared with the PRED group (Figure 5E, F and K, L respectively).
FIGURE 5.
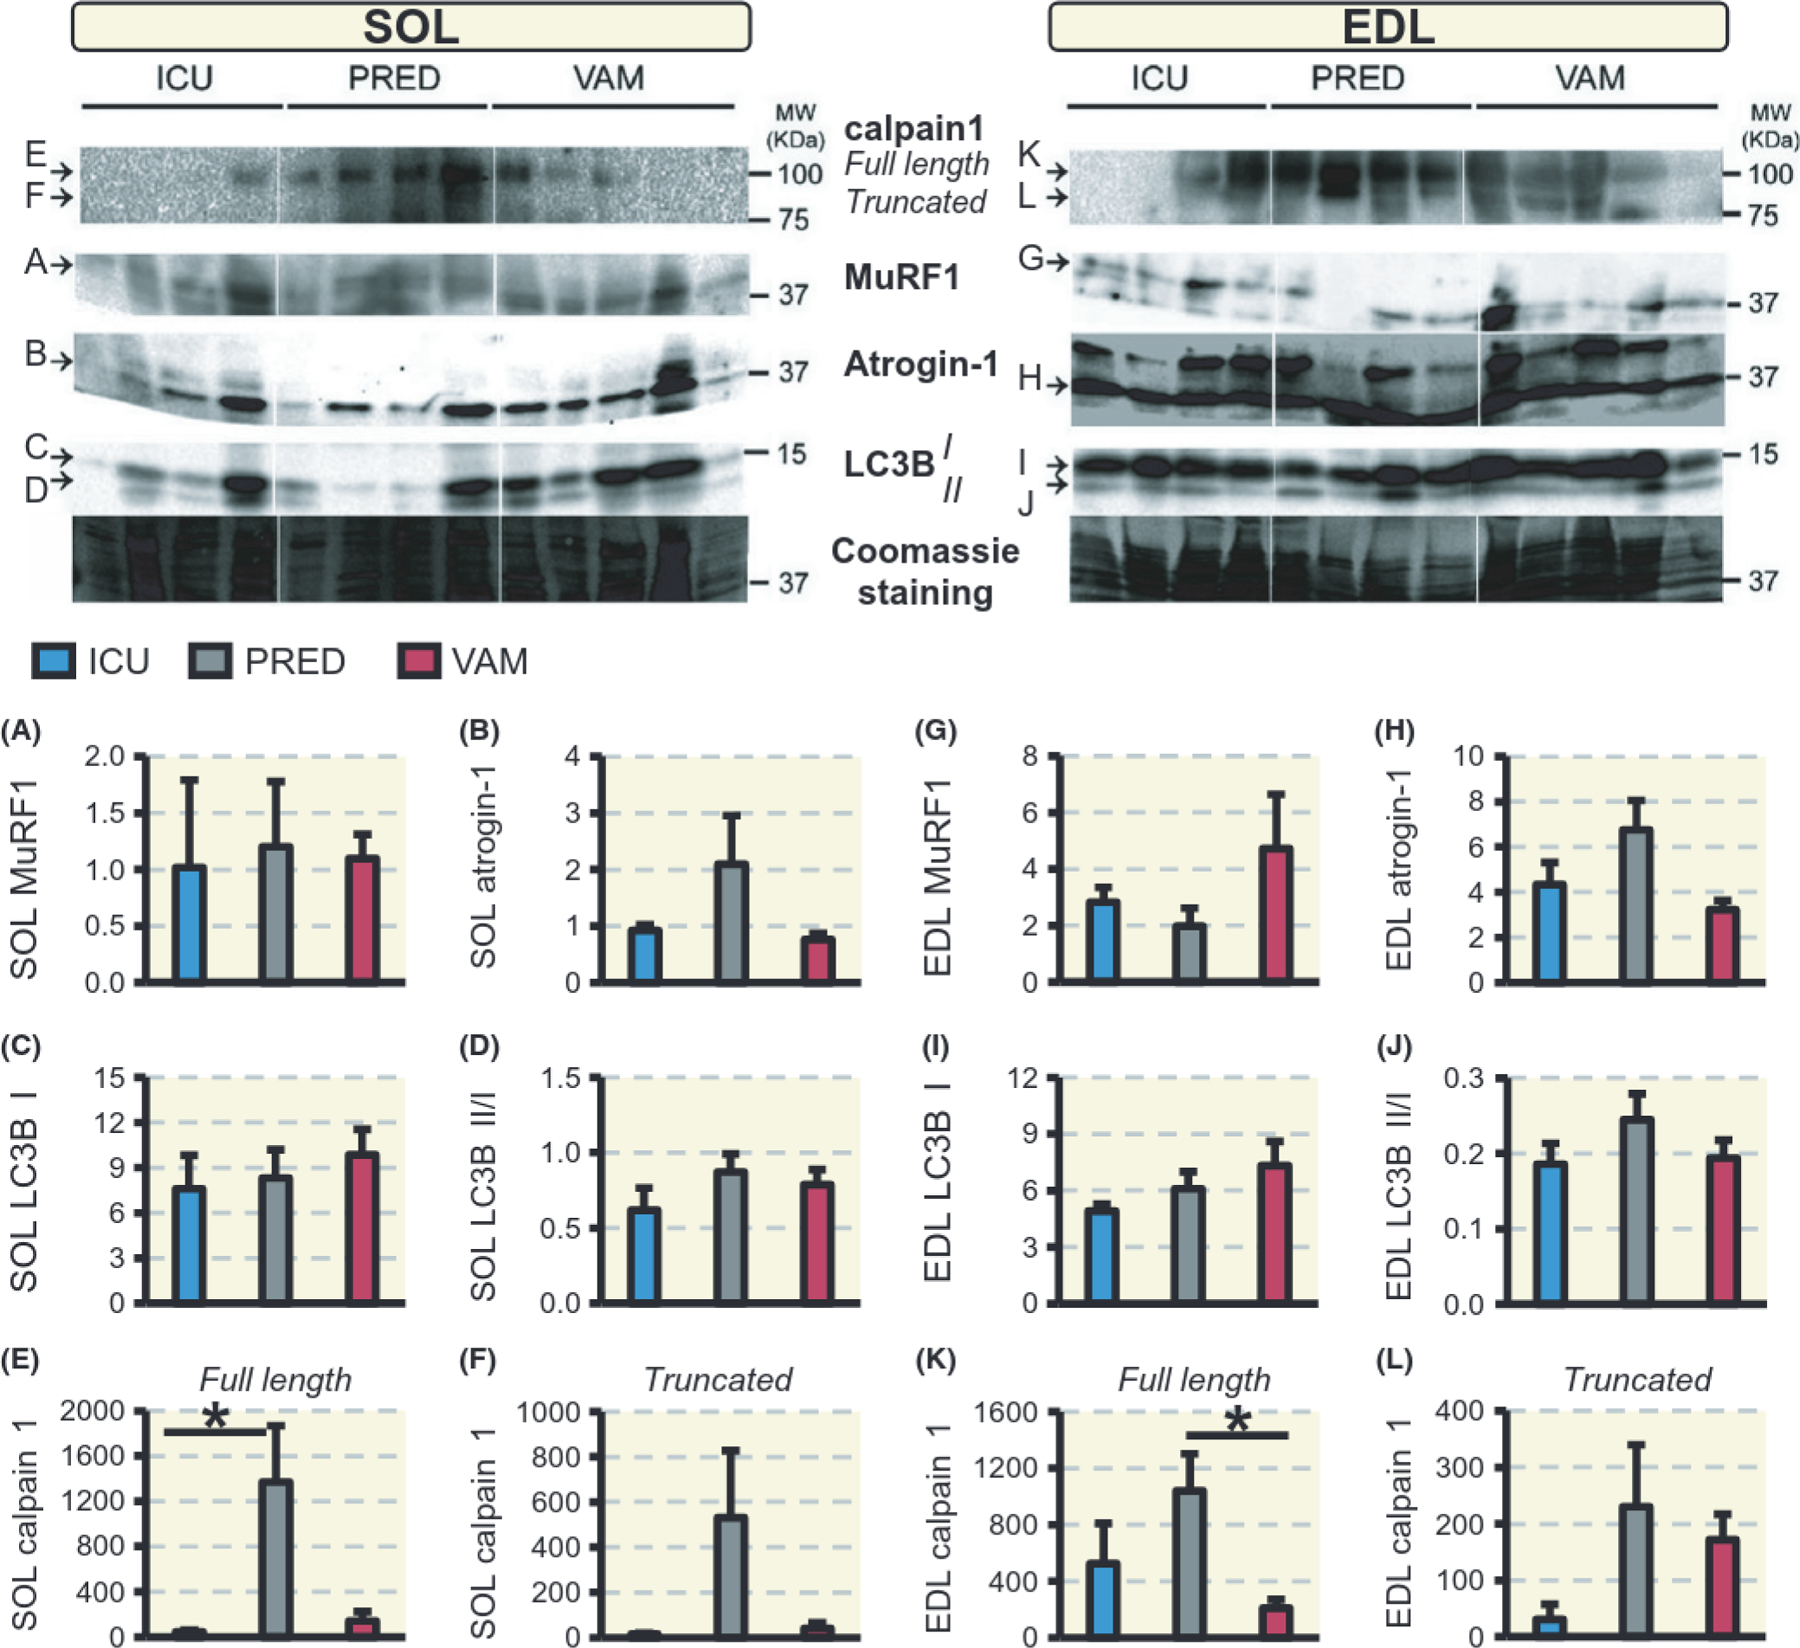
Western blot analysis. Protein levels in the soleus and EDL, respectively, of MuRF1 (A, G), atrogin-1 (B, H), and LC3B I (C, I), ratio of LC3B II:I (D, J) and calpain 1 full-length (E, K) and truncated calpain 1 (F, L). Values are means ± SEM of protein blot signal intensities normalized to Coomassie staining. Asterisk (*) represents P < 0.05
2.5 |. Systemic cytokines
Systemic inflammation has been postulated to play an important role in the development of CIM.26 Serum cytokine levels were therefore measured using a 27-plea array, but three cytokines had to be removed (IFN-γ, EGF, and GRO) due to low sensitivity in multiple samples. Only three of the investigated cytokines in serum showed significant changes in response to 5 days prednisolone treatment, ie, IL-18, fractalkine, and IP-10 levels were increased compared with the ICU and VAM groups (P < 0.05; Table 2).
TABLE 2.
Serum cytokines concentration (means ± SEM, pg/mL)
| Group | G-CSF | SEM | Eotaxin | SEM | GM-CSF | SEM | IL-1a | SEM |
|---|---|---|---|---|---|---|---|---|
| Control | 54 | 9.0 | 5.5 | 0.2 | 81 | 8.8 | 51 | 8.8 |
| ICU | 70 | 6.4 | 4.9 | 0.6 | 47 | 8.9 | 44 | 9.3 |
| PRED | 44 | 18.1 | 7.0 | 1.7 | 41 | 9.3 | 109 | 37.3 |
| VAM | 44 | 9.3 | 3.6 | - | 59 | 7.8 | 37 | 8.2 |
| Leptin | SEM | MIP-1a | SEM | IL-4 | SEM | IL-1B | SEM | |
| Control | 14 103 | 6229 | 3.5 | 0.4 | 13.8 | 3.1 | 19.3 | 3.4 |
| ICU | 9771 | 2515 | 5.2 | 1.3 | 9.3 | 2.5 | 19.0 | 2.7 |
| PRED | 19 041 | 5313 | 32.0 | 15.1 | 14.0 | 5.2 | 48.0 | 12.0 |
| VAM | 24 489 | 13 240 | 3.7 | 2.2 | 7.9 | 0.4 | 17.8 | 5.4 |
| IL-2 | SEM | IL-6 | SEM | IL-13 | SEM | IL-10 | SEM | |
| Control | 26.4 | 5.9 | 294 | 99.1 | 5.9 | 1.19 | 28.5 | 6.55 |
| ICU | 20.5 | 3.8 | 150 | 463 | 8.6 | 1.65 | 47.1 | 14.01 |
| PRED | 57.0 | 20.4 | 243 | 124.6 | 12.0 | 5.65 | 68.0 | 17.78 |
| VAM | 13.7 | 4.4 | 143 | 6.0 | 0.47 | 35.4 | 22.4 | |
| IL-12(p70) | SEM | IL-5 | SEM | IL-17A | SEM | IL-18 | SEM | |
| Control | 202 | 26.3 | 21.4 | 4.87 | 10.3 | 3.17 | 145.2 | 46.26 |
| ICU | 145 | 23 | 23.7 | 5.65 | 9.5 | 1.4 | 100.3 | 15.93 |
| PRED | 163 | 23.2 | 21.0 | 8.04 | 10 | 6.38 | 271# | 59.16 |
| VAM | 154 | 18.5 | 19.9 | 5.19 | 4.9 | 1.19 | 45.8* | 1.63 |
| MCP-1 | SEM | IP-10 | SEM | GRO/KC | SEM | VEGF | SEM | |
| Control | 474 | 71.7 | 84.3 | 17.4 | 180 | 83.05 | 28 | 5.9 |
| ICU | 528 | 83.4 | 132.5 | 20.6 | 209 | 37.52 | 24 | 3.9 |
| PRED | 768 | 233.1 | 257.0# | 30.3 | 224 | 20.56 | 24 | 1.8 |
| VAM | 509 | 77.2 | 85.6* | 14.6 | 63 | 22.07 | 19 | 0.6 |
| Fractalkine | SEM | LIX | SEM | MIP-2 | SEM | TNFa | SEM | |
| Control | 36 | 1.4 | 475 | 123.8 | 79 | 36.0 | 9.5 | 1.35 |
| ICU | 41 | 2.4 | 852 | 573.8 | 60 | 22.48 | 11.5 | 1.67 |
| PRED | 135# | 45.6 | 166 | 38.7 | 55 | 29.2 | 14.0 | 1.34 |
| VAM | 43* | 1.8 | 189 | 4.52 | 28 | 9.4 | 10.4 | 0.35 |
| RANTES | SEM | |||||||
| Control | 294 | 63 | ||||||
| ICU | 477 | 229 | ||||||
| PRED | 272 | 47 | ||||||
| VAM | 253 | 15 | ||||||
Statistically significant difference (P < 0.05) with ICU group and
between the drug groups (PRED and VAM).
3 |. DISCUSSION
Glucocorticoids (GCs) are widely used in the treatment of different clinical conditions due to strong anti-inflammatory effects, but GCs are also associated with significant side effects such as skeletal muscle atrophy and loss of function. In addition, GCs have been postulated to be a major factor triggering the debilitating quadriplegia associated with CIM in ICU patients exposed to long-term mechanical ventilation and immobilization8 The recently described dissociative steroid vamorolone (VBP15) has similar anti-inflammatory effects to prednisolone, but fewer harsh hormonal side effects on skeletal muscle.10,11 In this study, we have compared the effects of prednisolone and vamorolone on skeletal muscle in a unique rat experimental ICU model where animals develop the geno- and pheno-type associated with CLM. Rats were immobilized and exposed to 5 days mechanical ventilation and the major results from this study are as follows: (a) Both GCs improved survival rates with vamorolone showing superior survival. (b) Less body weight loss was observed in the vamorolone-treated rats compared with untreated rats. (c) In the slow-twitch soleus, muscle weight loss and muscle fibre atrophy were most pronounced in the untreated 5-day ICU-intervention rats and least affected in the vamorolone-treated animals. Muscle fibre maximum force and CSA declined in the non-GC treated rats but were maintained in the two GC-treated groups. Specific force declined regardless of treatment. (d) In the fast-twitch EDL, the declines in muscle fibre size, maximum force, and specific force were 2- to 3-fold larger in the prednisolone-treated animals compared to untreated and vamorolone-treated animals. (e) The preferential myosin loss in ICU patients with CIM was observed in response to 5 days exposure to the ICU condition in the rat experimental ICU model in soleus and EDL muscles and coupled to transcriptional downregulation of myosin and activation of the ubiquitin proteasome degradation pathway. However, a statistically significant preferential myosin loss was only observed in the 5-day mechanically ventilated controls and not in those treated with GCs. In the soleus, vamorolone treatment protected the muscle from the MuRF1 and atrogin-1 up-regulation observed in untreated and prednisolone-treated animals. In the EDL, an atrogene up-regulation was observed in all three groups mechanically ventilated for 5 days, Protein expression of the atrogenes or the autophagy sensor LC3B was not statistically different in either muscle among the treatments; however, the calcium-induced protease calpain 1 was significantly and uniquely induced by prednisolone, an effect largely absent in vamorolone-treated animals.
We have previously shown in both clinical and experimental studies that the preferential myosin loss is the dominant factor underlying the decreased specific force in membrane permeabilized muscle fibres from limb muscles 1,12,13,15,27 However, a significant decline in specific force was observed in response to the 5-day ICU condition in rats treated with prednisolone and vamorolone even in the absence of significant preferential myosin loss. Thus, other factors besides the myosin loss may impact on the force generation capacity after 5 days exposure to the ICU condition. In the diaphragm, we have previously shown that the dramatic loss in specific force in response to long-term mechanical ventilation was secondary to post-translational modifications of myosin impairing myosin function in the absence of preferential myosin loss.14 In the diaphragm, myosin was protected from these modifications by the chaperone co-inducer BGP-15 and thereby alleviated the negative effects on myosin and muscle fibre function.28 Preliminary unpublished results from our group show that post-translational modifications of myosin are also observed in limb muscles prior to the dramatic preferential myosin loss causing the strong negative impact on force generation capacity, ie, specific force (Cacciani N, Salah H, Akkad, H, Sriramoju V, Alfano R, Larsson L. In manuscript). Thus, despite the positive effects of GCs on muscle mass, the present results indicate that the GCs are less efficient in protecting myosin from the post-translational modifications associated with 5 days of exposure to the ICU condition.
Glucocorticoids were originally forwarded as one of the most important triggers of CIM based on observations from clinical and experimental studies using very high doses/concentrations of GCs.8 However, this has not been confirmed in clinical studies where GCs were given in low to moderate doses.26,29–35 GCs play an important role in survival and recovery in ICU patients by counteracting ischaemia and inflammation and thereby reducing the duration of organ failure and mechanical ventilation.36–38 In previous studies using the rat experimental ICU model, we have shown that the loss of body weight is primarily due to loss of muscle mass. 2 However, the effects of prednisolone and vamorolone on muscle and body weight in this study are in part obscured by the diuretic effect of prednisolone in the rat,13 resulting in a negative fluid balance in prednisolone-treated animals. However, muscle fibre size was measured in rehydrated single muscle fibres at a fixed sarcomere length, eliminating the effects of dehydration and differences in contractile state of muscle fibres from muscle cross-sections.39 Muscle fibre size measurements confirmed the muscle type-specific negative effects of prednisolone,24 ie, an attenuated decrease in size and force in the slow-twitch muscle fibres from the soleus and an exaggerated decline in size and force generating capacity in fast-twitch muscle fibres from the EDL. In vamorolone-treated animals, on the other hand, a similar attenuated decline in muscle fibre size and function was observed in the slow-twitch soleus but there was no exaggerated decline in size and function in the fast-twitch EDL fibres. Prednisolone animal studies showed both increased and decreased muscle force,40,41 but the effects appear to be dose and muscle type specific and have been observed in freely moving rats and not in immobilized animals as in the current study. The vamorolone literature has so far focused on long-term consequences, while less is known of 5-day effects. In Duchenne muscle dystrophy, 4-week experiments, in vivo strengths measurements of whole limbs in young mice showed that only vamorolone improved forelimb grip maximal strength in a dose-dependent manner, while prednisolone decreased it.10 Another mouse study reported that long-term (5 week) vamorolone treatment (30 mg/kg) did not reduce diaphragm muscle mass while prednisolone (10 mg/kg) did.42 In clinical and animal studies, vamorolone was shown to induce less immunotoxicity, insulin resistance, HPA axis suppression, and cardiac or skeletal muscle fibrosis than prednisolone,11 Moreover, vamorolone can alter physicochemical properties of the myofibre plasma membranes, reducing oxidative stress and enhance cellular signalling.10 Collectively, these effects may underlie the advantageous effects of vamorolone over prednisolone in this study.
GC-induced muscle atrophy preferentially affects fast-twitch glycolytic myofibres, reducing CSA and myosin content,43 GCs bind to glucocorticoid receptors (GRs) in the cytoplasm followed by nuclear translocation where the GC-GR complex either induces transactivation or transrepression of multiple genes. In transactivation, GRs bind directly to DNA leading to many side effects, while in transrepression, GRs, instead, interact with transcription factors (largely AP-1 and NF-κB), directly or indirectly producing most anti-inflammatory effects. Transactivations (side effects) are thought to occur at very high GR concentrations while transrepression (anti-inflammation) appears to be activated at lower concentrations,44 Vamorolone is a steroidal compound modified in a way that reduces the ability of transactivating genes due to lack of formation of GRiligand dimers and thus shows fewer unwanted side effects. In an earlier study using the same rat ICU model, we observed that nuclear levels of GRs are much higher in fast-twitch fibres and their concentration increases in the soleus over 2 weeks of ICU intervention.45 Thus, the different EDL response to prednisolone and vamorolone might be explained by differences in GR abundance.
Prednisolone exacerbated muscle weakness and atrophy in the EDL muscle in response to the ICU condition in contrast to vamorolone, while both drugs did not affect the myosin:actin ratio, This may reflect a key difference in protein degradation mechanisms between the two drugs. GCs stimulate protein breakdown in skeletal muscle by activating three main proteolysis systems, ie, the ubiquitin protea-some system (including E3 ubiquitin ligases), the autophagy system, and the calcium-dependent calpains. The transcriptional up-regulation of the E3 ligases (MuRF1, atrogin-1, and FBOX3 1) in the ICU group was consistent with declined MyHC gene expression and decreased the myofibre size and force seen previously in experimental and clinical studies of CIM.1 However, E3 ligases did not explain the differential effects of prednisolone and vamorolone in the EDL muscle, thus suggesting the involvement of another degradation mechanism, GC-stimulated autophagy in animal models of skeletal muscle atrophy is indicated by an increased LC3B-II to LC3B-I ratio, however, this ratio was almost constant across the treatment groups regardless of the muscle. Calpains are responsible for disassembling myofibrils of the sarcomere, facilitating the release of actin and myosin into the cytoplasm for further degradation by the proteasome. Previously, we found that ICU intervention in rats increased calpain 1 in limb muscle but only after 9 days. Here, it seems that prednisolone but not vamorolone hastens the activation of calpains, thus enhancing the degradation of cytoskeletal proteins and releasing myosin and actin, which may explain the loss of force in the EDL that precedes the drop in myosin to actin ratio.
An additional contrasting effect was observed on serum cytokine levels between prednisolone- and vamorolone-treated animals. Vamorolone did not induce any changes in the assayed cytokines, while prednisolone induced significant increases in the levels of IP-10, fractalkine, and IL-18. The first two are chemokines involved in chemoattraction and immunity and IL-18 is a pro-inflammatory cytokine. Glucocorticoids clinical effects are considered to be anti-inflammatory, although this need not hold true for all concentration levels and it is becoming increasingly evident that GCs have a full spectrum from being permissive to suppressive of inflammatory processes, There have been interesting reports that low-dose GCs can stimulate different inflammatory processes and modulate cytokine/chemokine secretion.46 The immunomodulatory role of prednisolone in different muscle types needs further scientific attention.
The major hallmarks observed in CEV1 patients were all produced after 5 days exposure to the ICU condition, including preferential myosin loss, transcriptional downregulation of myosin, muscle atrophy, and decreased specific force.1 However, despite the optimization of this animal model, a relatively high mortality rate was observed especially in the ICU group, reducing the statistical power of the study. Moreover, cytokine activation/suppression was investigated in blood and not at the muscle tissue level, representing a limitation of our cytokine data. Finally, specific interest was focused on limb muscles and not on other muscles, such the diaphragm, since we were primarily interested in CIM-related changes in limb muscles. However, the diaphragm muscle is also significantly affected by 5 days mechanical ventilation, but this is outside the scope of the current study.
In conclusion, this study on rats exposed to the ICU condition revealed that a 5-day vamorolone treatment was associated with effects which were advantageous compared with its analogue, prednisolone, in ICU outcomes, muscle and body weight loss, muscle fibre atrophy, and maximal force in slow-twitch fibres. Furthermore, unlike prednisolone, vamorolone did not exacerbate atrophy and dys-function in fast-twitch muscle fibres. This indicates that vamorolone use as a prednisolone replacement might have the potential to reduce the risk of negative muscle outcomes in the ICU settings.
4 |. MATERIALS AND METHODS
4.1 |. Study design
The objective of this study was to evaluate effects of prednisolone and vamorolone on muscle size and function in the early stage of MI. Twenty adult female Sprague-Dawley rats weighing 311 ± 7.5 g were included in this study. The rats were randomly divided into one control group (n = 6) and three treatment groups exposed to controlled mechanical ventilation, neuromuscular blockade, and deep sedation for 5 days with no drug treatment (ICU group, n = 5), with prednisolone (PRED group, n = 4) or with vamorolone (VAM group, n = 5). At the end of the experimental period, rats were killed and samples were collected for analyses. Controls were sham-operated and underwent the same interventions as the experimental rats, but without the administration of α-cobratoxin and were killed within 2 hours of the initial surgery. Muscles were dissected after killing and one part was quickly frozen in liquid propane cooled by liquid nitrogen and stored at −160°C for further analyses and another part was prepared for skinning (see single muscle fibre). Water content was measured by weighing a part from the quadriceps femoris before and after lyophilization.
4.2 |. The rat model
Experimental details on sedation, anaesthesia, surgery (intravenous and infra-arterial catheterization of v. jugularis and a. carotis), mechanical ventilation, protein and fluid balance, parenteral solutions, and monitoring can be found elsewhere.12,19,47,48 Briefly, all experimental group animals were mechanically ventilated, sedated with inhalational isoflurane, and pharmacologically paralysed post-synaptically with α-cobratoxin in continuous infusion. Prednisolone 5 mg/kg/day (Prednisolon Alternova, Alternova, skælskør, Denmark), and vamorolone 20 mg/kg/day11 (ReveraGen BioPharma, Rockville, MD, USA) were administered to their respective groups by oral gavage. Experiments were terminated at day 5.
4.3 |. Single muscle fibre experimental procedure
Muscle fibre sample treatments and contractile measurements are detailed elsewhere.19,49,50 Briefly, the soleus and EDL (extensor digitontm longus) muscles were dissected immediately after killing. Muscle bundles were then chemically skinned by a glycerol solution19 and then cryo-protected using an increasing sucrose concentration and finally frozen at −160°C pending use.49 On the experiment day, muscle bundles were de-sucrosed and individual fibre cross-sectional area (CSA) was calculated from the diameter and depth, assuming an elliptical circumference at a fixed sarcomere length of 2.75 μm. Force was measured by immersing muscle fibre segments in a relaxing and then activating Ca2+ solutions using the slack-test procedure.50 Maximal force (P0) was calculated as the difference between the maximal steady-state isometric force in the activating solution and the resting force measured in the same segment while in the relaxing solution. Maximal force production was normalized to CSA (specific force equals to maximal force (P0)/CSA). For contractile measurements, we applied strict acceptance criteria. A muscle fibre was accepted and included in the analyses if the sarcomere length of a single muscle fibre changed <0.10 μm between relaxation and maximum activation, and if maximal force changed less than 10% between activations.19
4.4 |. Sodium dodecyl sulphate-polyacrylamide gel electrophoresis (SDS-PAGE)
Silver stained 6% acrylamide gels were used to determine the composition of myosin isoforms. After contractile measurements, the muscle fibres were dissolved in sample buffer (2.1 mL Glycerol, 1.4 mL 10% w/v SDS, 1.75 mL 0.5 mol/L Tris pH 6.8, 0.32 nil, bromophenol blue solution, 32.4 mg DTT, and 5 mg leupeptin and H2O up to 15 mL) and stored at −80°C. The total acrylamide and Bis concentrations were 4% (w/v) in the stacking gel and 6% (w/v) in the running gel, The gel matrix included 30% glycerol. Tris–glycine electrode buffer (pH 8.3) and the SE 600 vertical slab gel unit (Hoefer Scientific Instruments, San Francisco, CA, USA) were used at a constant voltage of 120 V for 20–22 hours at 10°C.
Myosin:actin ratio measurements were done using Coomassie blue-stained 12% acrylamide gels. Samples were prepared by dissolving 10-μm cross-sections of the muscle in urea buffer (120 g urea, 38 g thiourea, 2,89 g dithiothreitol, 1.51 g Trizma base, 7.5 g SDS and 0.004% bromophenol blue, H2O up to 250 mL). A volume of 5 μL was loaded on 12% acrylamide gel and was finally stained by Coomassie blue (SimplyBlue SafeStain, Invitrogen, Carlsbad, CA, USA). The total acrylamide and Bis concentrations were 4% (w/v) in the stacking gel and 12% (w/v) in the running gel. The gel matrix included 10% glycerol. Tris–glycine electrode buffer (pH 8.3) and the SE 600 vertical slab gel unit were used at a constant current of 16 mA for 5 hours at 15°C.
Soft laser densitometer (Molecular Dynamics, Sunnyvale, CA, USA) was used to scan the gels with a high spatial resolution (50 μm pixel spacing) and 4096 optical density levels to determine the relative contents of myosin heavy chain (MyHC) isoforms. The volume integration function (ImageQuant TL Software v. 2003.01, Amersham Biosciences, Uppsala, Sweden) was used for quantification of protein content on the gels.
4.5 |. Quantitative real-time RT-PCR
Real-time PCR was used to quantify the mRNA levels for rat MyHC I, MyHC IIx, MyHC IIb, MyHC IIa, skeletal α-actin, MAFbx/atrogin-1, MuRF-1, FBOX31, and SMART. Total RNA was isolated from frozen soleus and EDL muscle tissue using spin column purification RNAeasy (QIA-GEN, Hilden. Germany). A 200 ng aliquot of total RNA was reverse transcribed to cDNA using Qscript cDNA Super Mix (Quanta Biosciences, Gaithersburg, MD, USA) and was diluted into a final volume of 100 μL. Primers were designed using the software Primer 3 (http://biotools.umassmed.edu/bioapps/primer3_www.cgi) and ordered from Sigma-Aldrich (Munich, Germany). cDNA was amplified in triplicate using MyiQ single color real time PCR detection system (BioRad, Hercules, CA, USA). Gene expression analyses were performed using the ΔΔCt method based on correction to GAPDH.
4.6 |. Immunoblotting
About 20 mg of the frozen soleus and EDL muscles was lysed and homogenized in ice-cold RIPA lysis buffer (IRIS HC1 50 mmol/L, NaCI 150 mmolIL, SDS 1%, deoxycholate 0.5%, EDTA 5 mmol/L, pH 8.0, and NP-40 1%,) and Halt Protease Inhibitor Cocktail was added (Thermo Scientific, Rockford, IL, USA). Total protein concentration was assayed using Pierce 660 nm Protein Assay Kit (Thermo Scientific). About 30 μg total protein was added to Laemmli lysis-buffer (Sigma-Aldrich) to a total volume of 10 μL and loaded onto a 15-well 12% acrylamide gels and ran for 90 minutes under constant voltage of 120 volts. Proteins were then blotted onto PVDF membranes (Immobilon-P, Merck, Darmstadt, Germany) for 60 minutes under constant 120 volts. Membranes were then blocked by a 3% BSA solution then incubated overnight in the cold with anti-MuRF1 (AF5366; R&D Systems, Minneapolis, MN, USA), anti-atrogin-1 (AP2041 ECM Bio-sciences, ECM Biosciences, Versailles, KY, USA), anti-LC3b (L754, Sigma-Aldrich), and anti-calpain-1 (HPA005992, kindly provided by the Human Protein Atlas project; www.proteinatlas.org), The next day the membranes were washed with TBST 0.1% buffer and incubated with corresponding secondary antibodies [anti-rabbit P0217 (DAKO AIS, Glostrup, Denmark) and donkey anti-goat (G0709, Santa Cruz, CA, USA)] for 1 hour at room temperature, washed with TBST 0.1% buffer and incubated with ECL Prime Western Blotting Detection Reagent (GE Healthcare, Chicago, IL, USA) to be finally scanned (ChemiDOC, Biorad, Hercules, CA, USA), Membranes were stripped one time using a mild stripping solution (1.5% glycine, 0.1% SDS, 11 Tween20, pH 2.2) in order to detect MuRF1 and atrogin-1 on the same membranes.
4.7 |. Cytokine analysis
Blood samples were centrifuged and stored at −80°C, and subsequently assayed for 27 cytokines simultaneously using Rat Cytokine Array/Chemokine Array 27-Plex Discovery Assay (Eve Technologies, Calgary, AB, Canada) according to the manufacturer’s protocol. The 27 cytokinetchemokines are: Tumour Necrosis Factor alpha (TNFα), Interleukin-lα (IL-1α), IL-1β, IL-18, IL-12(p70), IL-6, IL-17A, Interferon-γ (IFN-γ), Leptin, IL-2, IL-5, IL-4, IL-13, IL-10, Macrophage Inflammatory Protein 1 alpha (MIP-1α), Macrophage Inflammatory Protein 2 (MIP-2), Regulated on Activation, Normal T Expressed and Secreted (RANTES), Monocyte Chemotactic Protein 1 (MCP-1), Eotaxin, IFN-γ-inducible protein 10 (IP-10), human Growth-Regulated Oncogene/Keratinocyte Chemoattractant/Cytokine-Induced Neutrophil Chemoattractant 1 (GRO/KC/CINC-1), Lipopolysaccharide-Induced CXC chemokine (LIX), Fractalkine, Epidermal Growth Factor (EGF), Vascular Endothelial Growth Factor (VEGF), Granulocyte-Colony Stimulating Factor (G-CSF), and Granulocyte-Macrophage Colony-Stimulating Factor (GM-CSF).
4.8 |. Statistics
Statistical analysis was performed using SigmaPlot 13 software. Intervention groups ICU, PRED, and VAM were compared using one-way analyses of variance (ANOVA) and the Tukey post hoc test. The ICU group was compared with controls using Student’s t test. When the analysed data failed normality testing, we used ANOVA on ranks. Unless stated otherwise, data are presented as means ± SEM. P < 0.05 was considered statistically significant.
4.9 |. Study approval
All the animal experiments were carried out according to the guidelines of the Swedish Board of Agriculture and approved by the ethics committees at Uppsala University and Karolinska Institutet (ethical permit number N263/14).
ACKNOWLEDGEMENTS
This study was supported by grants from the Erling-Persson Family Foundation, the Swedish Research Council (8651), Stockholm City Council (Alf 20150423, 20170133), and Karolinska Institutet to L.L. We are also grateful to Ms. Yvette Hedström for excellent technical assistance.
Funding information
Stockholms Läns Landsting, Grant/Award Number: 20150423, 20170133; Vetenskapsrådet, Grant/Award Number: 8651; Familjen Erling-Perssons Stiftelse: Karolinska Institutet
Footnotes
CONFLICT OF INTEREST
The authors declare no conflict of interest.
REFERENCES
- 1.Larsson L, Li XP, Edstrom L, et al. Acute quadriplegia and loss of muscle myosin in patients treated with nondepolarizing neuromuscular blocking agents and corticasteroids: mechanisms at the cellular and molecular levels. Crit Care Med 2000;28(1):34–45. [DOI] [PubMed] [Google Scholar]
- 2.De Letter M, van Doom PA, Savelkoul HFJ, et al. Critical illness polyneuropathy and myopathy (CIPNM): evidence for local immune activation by cytokine-expression in the muscle tissue. J Neuroinununol 2000;106(1–2):206–213. [DOI] [PubMed] [Google Scholar]
- 3.Henry J, Kaminski RLR. 1994. Endocrine myopathies (hyper-and hyponinction of adrenal, thyroid, pituitary, and parathyroid and iatrogenic corticosteroid myopathy) Chapter 66. In: Engel AG, Franzini-Armstrong C, (eds) Myology, pp. 1726–1753. McGraw-Hill, New York, NY, USA. [Google Scholar]
- 4.Perrot S, Le Jeunne C. Steroid-induced myopathy. Presse Med 2012;41(4):422–426. [DOI] [PubMed] [Google Scholar]
- 5.Tang BMP, Craig IC, Eslick GD, Seppelt I, McLean AS. Use of corticosteroids in acute lung injury and acute respiratory distress syndrome: a systematic review and meta-analysis. Crit Care Med 2009;37(5):1594–1603. [DOI] [PubMed] [Google Scholar]
- 6.Casuso RA, Melskens L, Bruhn T, Secher NH, Nordsborg NB. Glucocorticoids improve high-intensity exercise performance in humans. Ear J App! Physic! 2014;114(2):419–424. [DOI] [PubMed] [Google Scholar]
- 7.Baudry S, Lanfranco F, Merletti R, Duchateau I, Minetto MA. Effects of short-term dexamethasone administration on corticospinal excitability. Med Sci Sports Exerc 2014;46(4):695–701. [DOI] [PubMed] [Google Scholar]
- 8.Pereira RMR, de Carvalho JF. Glucocorticoid-induced myopathy. Joint Bone Spine 2011;78(1):41–44. [DOI] [PubMed] [Google Scholar]
- 9.Reeves EKM, Roffman EP, Nagaraju K, Damsker JM, McCall JM. VBP15: preclinical characterization of a novel anti-inflammatory delta 9,11 steroid. Bioorg Med Chem 2013;21(8):2241–2249. [DOI] [PMC free article] [PubMed] [Google Scholar]
- 10.Heier CR, Damsker JM, Yu Q, et al. VBP15, a novel anti-inflammatory and membrane-stabilizer, improves muscular dystrophy without side effects. EMBO Mol Med 2013;5(10):1569–1585. [DOI] [PMC free article] [PubMed] [Google Scholar]
- 11.Hoffman EP, Riddle V, Siegler MA, et al. Phase 1 trial of vamorolone, a first-in-class steroid, shows improvements in side effects via biomarkers bridged to clinical outcomes. Steroids 2018;134:43–52. [DOI] [PMC free article] [PubMed] [Google Scholar]
- 12.Ochala J, Gustafson AM, Diez ML, et al. Preferential skeletal muscle myosin loss in response to mechanical silencing in a novel rat intensive care unit model: underlying mechanisms. J Physiol 2011;589(8):2007–2026. [DOI] [PMC free article] [PubMed] [Google Scholar]
- 13.Llano-Diez M, Renaud G, Andersson M, et al. Mechanisms underlying ICU muscle wasting and effects of passive mechanical loading. Crit Care 2012;16(5):R209. [DOI] [PMC free article] [PubMed] [Google Scholar]
- 14.Corpeno R, Dworkin B, Cacciani N, et al. Time course analysis of mechanical ventilation-induced diaphragm contractile muscle dysfunction in the rat. J Physiol 2014;592(17):3859–3880. [DOI] [PMC free article] [PubMed] [Google Scholar]
- 15.Renaud G, Llano-Diez M, Ravara B, et al. Sparing of muscle mass and function by passive loading in an experimental intensive care unit model. J Physiol 2013;591(5):1385–1402. [DOI] [PMC free article] [PubMed] [Google Scholar]
- 16.Akkad H, Corpeno R, Larsson L. Masseter muscle myofibrillar protein synthesis and degradation in an experimental critical illness myopathy model. PLoS ONE 2014;9(4):e92622. [DOI] [PMC free article] [PubMed] [Google Scholar]
- 17.Liu C, Liu G, Zhou C, Ji ZG, Zhen YZ, Liu KS. Potent diuretic effects of prednisone in heart failure patients with refractory diuretic resistance. Can J Cardiol 2007;23(11):865–868. [DOI] [PMC free article] [PubMed] [Google Scholar]
- 18.Baylis C, Handa RIC, Sorkin M. Glucocorticoids and control of glomerular filtration rate. Semin Nephrol 1990;10(4):320–329. [PubMed] [Google Scholar]
- 19.Moss RL. Sarcomere length-tension relations of frog skinned muscle-fibers during calcium activation at short lengths. J Physiol 1979;292:177–192. [DOI] [PMC free article] [PubMed] [Google Scholar]
- 20.Friedrich O, Reid MB, Van den Berghe G, et al. The sick and the weak: neuropathies/myopathies in the critically ill. Physiol Rev 2015;95(3):1025–1109. [DOI] [PMC free article] [PubMed] [Google Scholar]
- 21.Klaude M, Fredriksson K, Tjäder I, et al. Proteasome proteolytic activity in skeletal muscle is increased in patients with sepsis. Clin Sci (Lond) 2007;112(9):499–506. [DOI] [PubMed] [Google Scholar]
- 22.Kalamgi RC, Larsson L. Mechanical signaling in the pathophysiology of critical illness myopathy. Front Physiol, 2016;7:23. [DOI] [PMC free article] [PubMed] [Google Scholar]
- 23.Milan G, Romanello V, Pescatore F, et al. Regulation of autophagy and the ubiquitin-proteasome system by the FoxO transcriptional network during muscle atrophy. Nat Comman 2015;6:6670. [DOI] [PMC free article] [PubMed] [Google Scholar]
- 24.Schakman O, Kalista S, Barbe C, Loumaye A, Thissen JP. Glucocorticoid-induced skeletal muscle atrophy. Int J Biochem Cell 2013;45(10):2163–2172. [DOI] [PubMed] [Google Scholar]
- 25.Kabeya Y, Mizushima N, Ueno T, et al. LC3, a mammalian homologue of yeast Apg8p, is localized in autophagosome membranes after processing. EMBO J 2000;19(21):5720–5728. [DOI] [PMC free article] [PubMed] [Google Scholar]
- 26.de Letter M, Schmitz PIM, Visser LH, et al. Risk factors for the development of polyneuropathy and myopathy in critically ill patients. Crit Care Med 2001;29(12): 2281–2286. [DOI] [PubMed] [Google Scholar]
- 27.Norman H, Zackrisson H, Hedstrom Y, et al. Myofibrillar protein and gene expression in acute quadriplegic myopathy. J Neurol Sci 2009;285(1–2):28–38. [DOI] [PMC free article] [PubMed] [Google Scholar]
- 28.Salah H, Li M, Cacciani N, et al. The chaperone co-inducer BGP-15 alleviates ventilation-induced diaphragm dysfunction. Sci Transl Med 2016;8(350):12. [DOI] [PubMed] [Google Scholar]
- 29.Weber-Carstens S, Deja M, Koch S, et al. Risk factors in critical illness myopathy during the early course of critical illness: a prospective observational study. Crit Care 2010;14(3):R119. [DOI] [PMC free article] [PubMed] [Google Scholar]
- 30.Bednarik J, Vondracek P, Dusek L, Moravcova E, Cundrle I. Risk factors for critical illness polyneuromyopathy. J Neural 2005;252(3):343–351. [DOI] [PubMed] [Google Scholar]
- 31.Bercker S, Weber-Carstens S, Deja M, et al. Critical illness polyneuropathy and myopathy in patients with acute respiratory distress syndrome. Crit Care Med 2005;33(4):711–715. [DOI] [PubMed] [Google Scholar]
- 32.Garnacho-Montero J, Madrazo-Osuna J, Garcia-Garmendia JL, et al. Critical illness polyneuropathy: risk factors and clinical consequences. A cohort study in septic patients. J Intensive Care Med 2001;27(8):1288–1296. [DOI] [PubMed] [Google Scholar]
- 33.Nanas S, Kritikos K, Angelopoulos E, et al. Predisposing factors for critical illness polyneuromyopathy in a multidisciplinary intensive care unit. Ada Neurol Scand 2008;118(3):175–181. [DOI] [PubMed] [Google Scholar]
- 34.Steinberg KP, Hudson LD, Goodman RB, et al. Efficacy and safety of corticosteroids for persistent acute respiratory distress syndrome. N Engl J Med 2006; 354(16):1671–1684. [DOI] [PubMed] [Google Scholar]
- 35.Van den Berghe G, Schoonheydt K, Becx P, Bruyninckx F, Wouters PJ. Insulin therapy protects the central and peripheral nervous system of intensive care patients. Neurology 2005;64 (8):1348–1353. [DOI] [PubMed] [Google Scholar]
- 36.Sapolsky RM, Romero LM, Munck AU. How do glucocorticoids influence stress responses? Integrating permissive, suppressive, stimulatory, and preparative actions. Endocr Rev 2000;21(1):55–89. [DOI] [PubMed] [Google Scholar]
- 37.Meduri GU, Headley AS, Golden E, et al. Effect of prolonged methylprednisolone therapy in unresolving acute respiratory distress syndrome: a randomized controlled trial. JAMA 1998;280 (2):159–165. [DOI] [PubMed] [Google Scholar]
- 38.Annane D, Sebille V, Bellissant E, Ger-Inf-05 Study Group. Effect of low doses of corticosteroids in septic shock patients with or without early acute respiratory distress syndrome. Crit Care Med 2006;34(1):22–30. [DOI] [PubMed] [Google Scholar]
- 39.Larsson L, Skogsberg C. Effects of the interval between removal and freezing of muscle biopsies on muscle-fiber size. J Neural Sci 1988:85(1):27–38. [DOI] [PubMed] [Google Scholar]
- 40.Dodd SL, Powers SK, Vrabas IS, Eason Mt Interaction of glucocorticoids and activity patterns affect muscle function. Muscle Nerve 1995;18(2):190–195. [DOI] [PubMed] [Google Scholar]
- 41.Shin YS, Fink H, Khiroya R, Ibebunjo C, Martyn J. Prednisolone-induced muscle dysfunction is caused more by atrophy than by altered acetylcholine receptor expression. Anesth Analg 2000;91(2):322–328. [DOI] [PubMed] [Google Scholar]
- 42.Dillingham BC, Knoblach SM, Many GM, et al. VBP15, a novel anti-inflammatory, is effective at reducing the severity of murine experimental autoimmune encephalomyelitis. Cell Mol Neurobiol 2015;35(3):377–387. [DOI] [PMC free article] [PubMed] [Google Scholar]
- 43.Schakman O, Gilson H, Kalista S, Thissen JP. Mechanisms of muscle atrophy induced by glucocorticoids. Horm Res 2009;72:3641. [DOI] [PubMed] [Google Scholar]
- 44.Asadullah K, Schäcke H, Cato AC. Dichotomy of glucocorticoid action in the immune system. Trends Immumol 2002;23(3):120–122. [DOI] [PubMed] [Google Scholar]
- 45.Nordquist J, Hoeglund AS, Norman H, Tang X, Dworkin B, Larsson L. Transcription factors in muscle atrophy caused by blocked neuromuscular transmission and muscle unloading in rats. Mol Med 2007;13(9–10):461–470. [DOI] [PMC free article] [PubMed] [Google Scholar]
- 46.Yeager MP, Guyre PM, Munck AU. Glucocorticoid regulation of the inflammatory response to injury. Acta Anaesthesiol Scand 2004;48(7):799–813. [DOI] [PubMed] [Google Scholar]
- 47.Dworkin BR, Dworkin S. Learning of physiological-responses.1. habituation, sensitization, and classical-conditioning. Behav Neurosci 1990;104(2):298–319. [DOI] [PubMed] [Google Scholar]
- 48.Dworkin BR, Dworkin S. Baroreflexes of the rat. III. Open-loop gain and electroencephalographic arousal. Am J Physiol Regul Integr Comp Physiol, 2004;286(3):R597–R605. [DOI] [PubMed] [Google Scholar]
- 49.Frontera WR, Larsson L. Contractile studies of single human skeletal muscle fibers: a comparison of different muscles, permeabilization procedures, and storage techniques. Muscle Nerve 1997;20(8):948–952. [DOI] [PubMed] [Google Scholar]
- 50.Edman KAP. Velocity of unloaded shortening and its relation to sarcomere length and isometric force in vertebrate muscle-fibers. J Physiol 1979;291:143–159. [DOI] [PMC free article] [PubMed] [Google Scholar]